
Automated Evaluation and Narratives in Computer Science Education
Zsigmond Imre
1
, Andrei Zamfirescu
2
and Horia F. Pop
1
1
Faculty of Mathematics and Computer Science, Babes
,
- Bolyai University,
1 Mihail Kog
˘
alniceanu, RO-400084 Cluj - Napoca, Romania
2
Faculty of Letters, Babes
,
- Bolyai University, 31 Horea, RO-400202 Cluj - Napoca, Romania
Keywords:
Automated Evaluation, Gamification, e-Learning.
Abstract:
For university level computer science teachers assignment verification and validation uses disproportionate
amount of time. This leaves them with little time to help struggling students or for newer teaching techniques.
We set out o automate the tedious work, and incorporate instant feedback and narrative gamification mechan-
ics. During our semester long study our solution freed up a lot of time. The result suggest that more research,
and more gamification mechanics are warranted.
1 INTRODUCTION
University-level computer science teachers face la-
borious work to verify the correctness, coding style,
conventions and predefined technical details of stu-
dent exercises (Cheang et al., 2003). Even with highly
skilled personnel, typically not enough time is left to
tackle complex coding situations, help struggling stu-
dents and conduct complex anti-plagiarism checks.
Luckily the field does lend itself to partial automa-
tion, and newer teaching techniques like gamification.
Indeed, many gamification techniques require some
level of automation, for example near instant feed-
back requires software assisted evaluation.
Gamification itself is a new concept, grouping a
large array of techniques. Even its definition: the use
of game design elements in non game contexts, is less
than a decade old (Deterding et al., 2011). Because
of this, it has been applied in many contexts, and re-
search is ongoing. Literature reviews report mostly
positive and mixed results (Hamari et al., 2014).
With the proliferation of gamification techniques
being used, we noticed a lack of basic research in
the literature. A sentiment shared by (Dicheva et al.,
2015), when, following their systematic mapping
study, the conclusion was drawn that empirical re-
search on the effectiveness of gamification elements is
still scarce. We set out to do a systematic exploration
of the paradigm by starting from the current best prac-
tices and gradually adding new gamification elements
and comparing them to previous ones. This approach
is in contrast to merely improving evaluation tech-
niques (Chrysafiadi et al., 2018). The first two gam-
ification elements chosen were: instant feedback and
narrative, more on those in section 3.1. We conducted
a semester long study comparing them against control
groups and themselves.
This paper is structured as follows: previous work
on the subject can be found in Section 2, gamification
elements are detailed in Section 3.1, description of the
automated grading in Section 3.2, description of the
conducted study are in Section 3.3, and analysis of the
results in Section 3.4. Finally conclusions and further
work can be found in Section 4.
2 BACKGROUND
This work is a continuation of (Zsigmond, 2019),
where the groundwork for the automated evaluation
was laid. With various prototyping done, two experi-
mental settings were chosen, more on that in Section
3.1. Various modifications to the original solution was
made to accommodate the experiment.
Ever since 1965 there were attempts to automate
grading of computer science assignments. We can see
a progressive sophistication of needs and technologies
from punch cards in the aforementioned first attempts
(Forsythe and Wirth, 1965), to batch punch card eval-
uation (Taylor and Deever, 1976), to multiple choice
tests in (Rottmann and Hudson, 1983). From complex
Matlab graders (Von Matt, 2001), to the first website
evaluators (Fu et al., 2008), each decade we see better
attempts to solve the latest technical challenges. The
430
Imre, Z., Zamfirescu, A. and Pop, H.
Automated Evaluation and Narratives in Computer Science Education.
DOI: 10.5220/0009415704300437
In Proceedings of the 15th International Conference on Evaluation of Novel Approaches to Software Engineering (ENASE 2020), pages 430-437
ISBN: 978-989-758-421-3
Copyright
c
2020 by SCITEPRESS – Science and Technology Publications, Lda. All rights reserved

work continues even in recent years (Po
ˇ
zenel et al.,
2015).
Shorter attention spans among students, and ever
more potent distractions has prompted research into
the gamification of learning, in an attempt to cap-
ture their engagement and to inspire learning (Ma-
juri et al., 2018). There are a lot of interesting ex-
periments with gamification in the literature. An il-
lustrative study of early attempts at gamifying com-
puter science education is (Leong et al., 2011). A
large number of gamification mechanics were used:
missions, one type of generalized narrative, points in
the form of experience, one type of leader-board, 24h
feedback cycle. While the authors report positive re-
sults, because of the large amount of changes and lack
of control groups, it is not possible to say why. In
(Amriani et al., 2013) one group of the students ex-
perienced half a semester of gamified teaching fol-
lowed by half a semester of traditional teaching meth-
ods, and the other group of students experienced the
reverse. The result was a moderate decrease in activ-
ity for the group where gamification was taken away
and a slight increase for the group where gamifica-
tion was added. There was a lack of control groups
with gamification/traditional approaches throughout
the semester. (Ruip
´
erez-Valiente et al., 2017) also
aimed for empirical research by adding digital badges
to an engineering course. The authors aimed to mea-
sure the intention to get a badge by counting attempts
to get prerequisites for a given badge.
Regarding the matter of implementing narrative
driven gamification in various fields of education,
(Palomino et al., 2019) begin their own research en-
deavor by mapping an overview of the pragmatic
employment of narrative devices and constructs in
video games, subsequently shifting towards their ap-
plied function in gamification, the transition from the
medium of video games being deemed both beneficial
and natural.
(Sailer et al., 2013) add their conclusions pertain-
ing to the psychological impact that gamification can
have with regard to motivation and other forms of
positive reinforcement. Admittedly, the scarcity of
conclusive results may as of yet still seem daunting.
However, this current state of affairs need not assuage
any future enthusiasm: the benefits yielded by the im-
plementation of gamification into myriad fields (with
the added coda that any unanimously positive results
derived from said implementations should be taken
cum grano salis) should only encourage such ventures
and experiments in the years to come.
3 GAMIFIED COMPUTER
SCIENCE EDUCATION
3.1 Gamification Elements
Out of the vast array of game design elements used
in non-game contexts the most frequent tend to be
points, badges, leader-boards and quests. Investigat-
ing just a little bit more, we find a myriad of other
mechanics, used from industry to governments, from
education to sales (Raftopoulos et al., 2015). Some
of these elements in their turn come from psychology
and entertainment, for example Skinner boxes (Skin-
ner, 1935). A commonality of developed countries is
that most children grow up using digital devices from
early childhood. Because of this familiarity, we can
rely on student’s familiarity with video games as if
it was basic literacy skills, allowing us to use similar
concepts without the need to explain them.
Instant feedback is one of the simplest ideas in
gamification, it is also one of the hardest to do. At
it’s core it aims to give near instant feedback for any
desired action the student does. This feedback loop
makes desired actions clear, rewards and punishments
fast. In video games where all actions have to be taken
through the game system, as well as having desired
behaviors precisely defined, an easily achievable goal.
Outside of a game world, feedback tends to come late
if ever, and goals tend to be unclear or unknown.
To achieve a fast feedback cycle, an automated
evaluation platform had to be designed. We decided
on fully automating correctness checks and exercise
assignment, while semi-automating anti-plagiarism
checks. In practice the students received their assign-
ments though our website, where they uploaded their
solutions, upon which it was compiled, executed, and
through I/O redirection the tested application behav-
ior was compared to predefined behaviors. More on
the technical details in Section 3.2. Having near in-
stant feedback might not be technically achievable in
the future, especially with certain gamification me-
chanics requiring static code analysis. A simulacrum
of instant feedback may be achieved by using short
animations in succession for completed results to buy
time for computationally intensive results.
Applied gamification entails a vast spectrum of
options and strategies. In the case of the current study
the more specialized approach that has been opted for
was of a mainly diegetic nature. Employing a back-
ground rooted in literature to support four branching
narratives, the infrastructure of our gamified courses
most closely resembled interactive literary fiction – of
which game-books or Choose Your Own Adventure
literary works are prime relevant examples – entwined
Automated Evaluation and Narratives in Computer Science Education
431

with elements of role-playing and genre fiction.
The students provided with gamification narra-
tives were immersed in one of four diegetic cycles
in which progression would occur and results would
steadily accrue according to their own progress during
the semester. Broader personality traits and prefer-
ences were taken into account when selecting the the-
matic and stylistic array of the four cycles (labelled
as ”fantasy”, ”science-fiction”, ”horror” and ”mys-
tery”), as well as generally outlined aversive / ap-
petitive stimuli tailored to match different archetypal
genres with more dismal or soothing rhythms of pro-
gression. All the while the control groups got classi-
cal computer science assignments, with no link narra-
tive between them, sometimes only technical require-
ments.
Observing the research results of (Majuri2018),
ten out of thirteen analyzed implementations of narra-
tive gamification yielded predomninantly positive af-
fordance (the total number of papers researched by
the group in question amounting to ninety-one).
Regarding the present implementation, while each
of the four narrative cycles provided a cohesive
story, alternate exercise varieties would offer three-
fold branching ”sub-paths” or scenarios within the
larger established framework. The varieties mainly
differed thematically, being randomly allocated to
each group of students and effectively ensuring that
each of the four main narratives esentially developed
along three paralel directions (nevertheless only to ul-
timately converge towards the same unified conclu-
sion in the case of each cycle).
In order to facilitate the assigning of these branch-
ing sub-paths to different groups of students, all cy-
cles and their structure were modelled to resemble
directed graphs. The final sum encompassing ev-
ery possible branching path, example and conclusion
amounted to a total of 85.000 words (the equivalent
of approximately 300 A4 sized pages).
The multiple ”endings” which the students re-
ceived at the end would offer closure for both the nar-
rative cycle and the respective course, in the form of
overlapping ”peak” narrative moments / exams and
endings / final grades. The complexity and final out-
come of each of the four narrative cycles was directly
influenced by the amount of effort invested by a given
student throughout the semester, effectively reinforc-
ing participation by offering an impetus in the form of
emotional attachment to the progression of a chosen
story.
3.2 Automated Evaluation and
Gamification Workbench
When designing our automated evaluation and gam-
ification workbench platform we had the following
goals:
• Personalized Content: assignment text and UX
personalized to each student.
• Accessible from Anywhere: students could use
our solutions from outside faculty infrastructure.
• Multiple Programming Language Support: for
reuse in other courses.
• Pluginable: for courses different technical re-
quirements like databases, the core gamification
part should still be usable while technical require-
ments can be moved to a plugin.
• Anti-plagiarism Checks: to ensure students
make their own exercises and to ensure data va-
lidity.
• Measurable: student behavior is logged for re-
search purposes.
• Configurable: different groups / individuals can
have different experiences with the platform to al-
low for experimentation.
Our goals dictated part of the design, we chose a web-
site to display personalized exercises and results that
can be accessed from anywhere. For a typical use case
a student would access the site -> they would view
their assignments -> pick one they wanted to attempt
-> write it -> upload a solution -> verification and
pre-processing -> compilation -> execution -> test-
ing -> database storage -> finally display the results
to the student who in turn may try again if they were
not satisfied with the results.
For student exercises to be testable we had to
clearly specify the requirements. In turn the tests are a
set of provided input and expected output sequences.
The expected output is usually a regular expression.
Let us illustrate with an example before we continue
discussing the internals: one requirement of one of the
assignment needed to catalogue old maps, the ”add”
and ”display” console commands were specified to
take the form:
• add mapCatalogueNumber, stateOfDeterioration,
type, yearsOfStorage
• list
One test aiming to check the ”add” command with
a valid input, started with sending the application:
”add 1234, used, geographic, 20, then sent: ”list”, fi-
nally the regular expression checking the output was:
”.*(1234)*.*used.*geographic.*20”. Note, that the
ENASE 2020 - 15th International Conference on Evaluation of Novel Approaches to Software Engineering
432
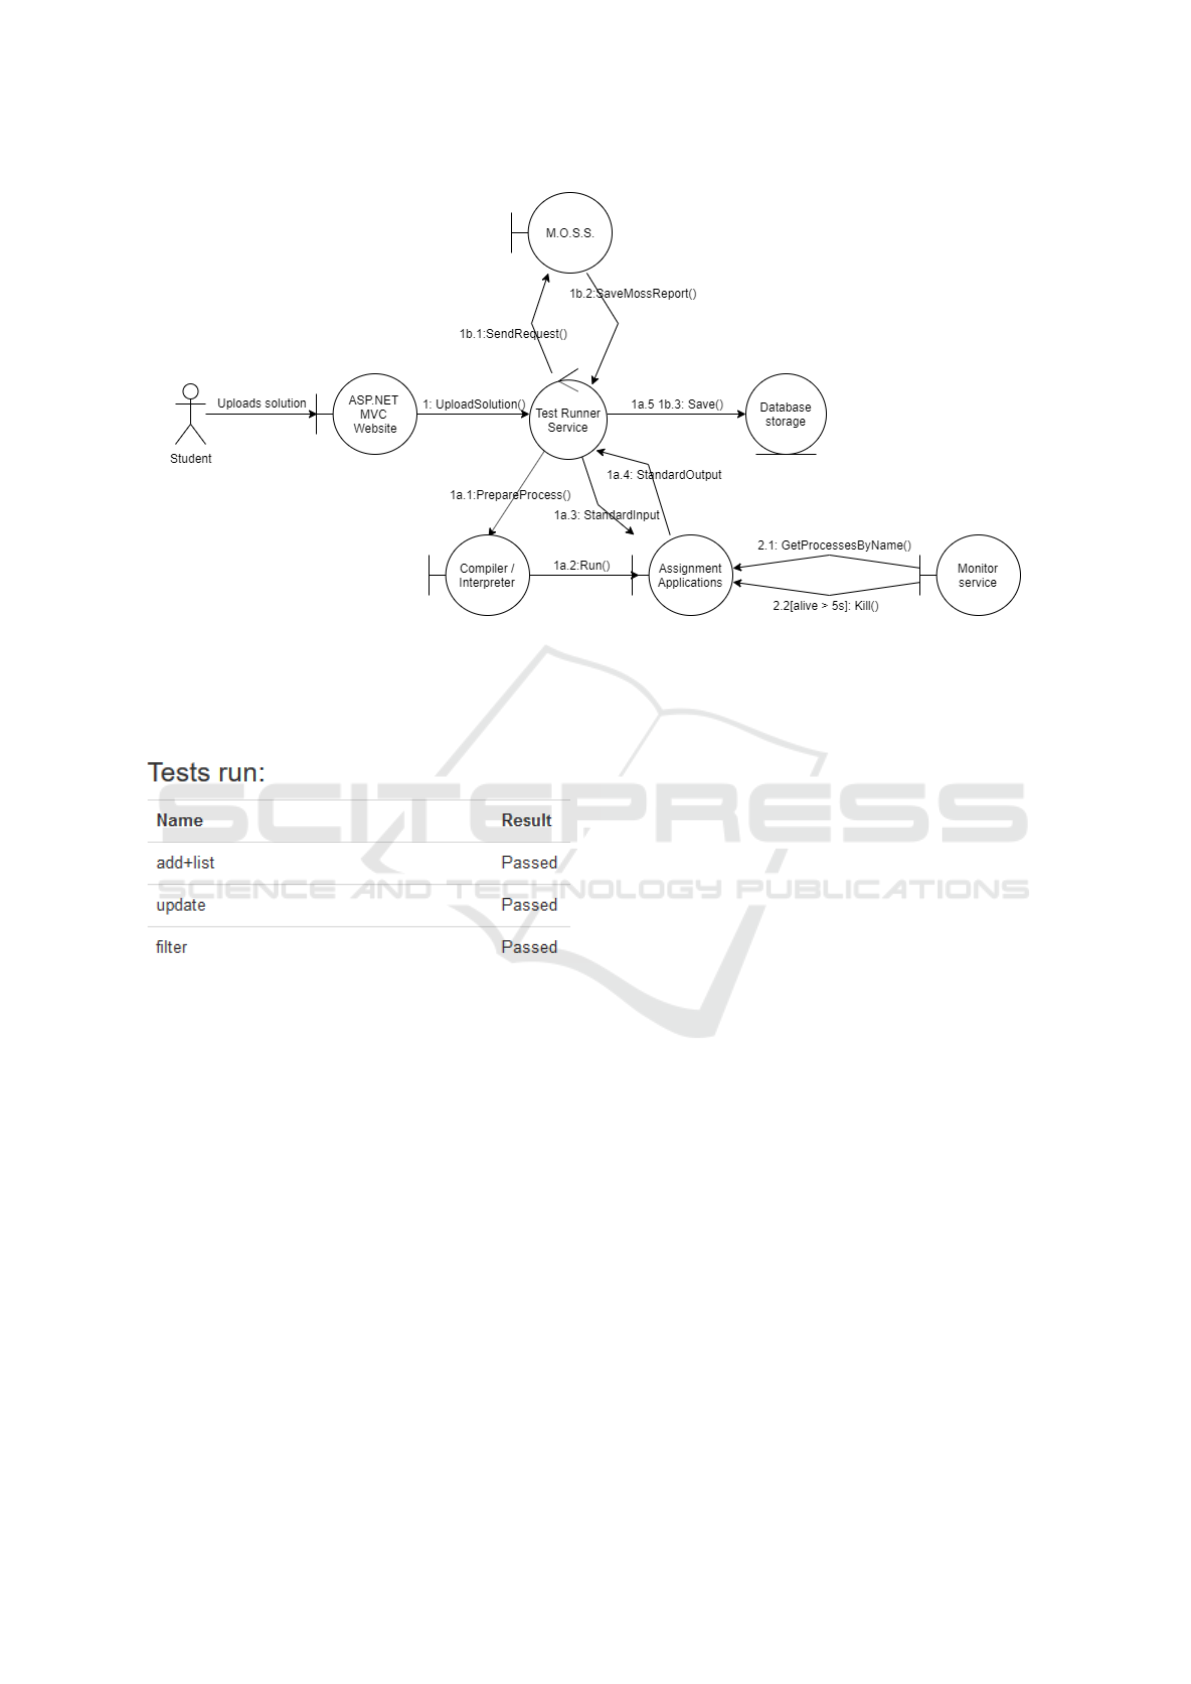
Figure 1: GamifyCS architecture.
regular expression ignores any formatting the student
might have added. In Figure 2 we have an example of
what the students would see after an upload.
Figure 2: Test run example.
To support multiple programming languages we opted
for external compilers/interpreters. During the exper-
iment we only used the C++ instance, although we
also had it working for Python and C#. Upon suc-
cessful compilation the server would execute the so-
lution while redirecting the standard input, output and
error. Separate threads are started for the different
streams, which in turn send and record input and out-
puts respectively. To guard against situations where
a given piece of code would hang, or spin in an in-
finite loop, the threads have timeouts. The running
application is monitored for activity and termination
from both the TestRunnerService, and an external OS
level service. We had to create the second one because
some executables would not respond to kill requests.
The service looks for applications with a given name
and terminate those with more than 5 seconds of run-
times. An unforeseen use of the system was during
the exams when the uploaded partial solution served
as a runable backup when their system crashed. For
a better view of the different threads and endpoints
we demonstrated the previously mentioned use case
in Figure 1.
Anti-plagiarism is a necessity in education and it
is also one that cannot be fully automated (Hage et al.,
2010). Issues range from files generated by IDEs, to
the occasional false positives, which if not handled
carefully can be detrimental to learning. We opted to
use Stanford’s MOSS API (Schleimer et al., 2003),
then check results manually. Data collection was in
the form of file logs and database fields.
From a teaching point of view the solution allowed
for significantly faster correctness evaluation to the
point of a couple of seconds per student, which al-
lowed for more time in code review per student.
3.3 Study
The research question, on which we based our study,
was how does instant feedback and/or narrative com-
pare to traditional methods. To this effect the afore-
mentioned gamification workbench was built (Zsig-
mond, 2019). The platform was configured to use
instant feedback and narrative elements. The exper-
iment ran an entire semester of 14 weeks, with all 210
students being divided into 14 subgroups. Subgroups
were allocated randomly by software. 4 experimental
settings were devised, with all combinations of ele-
ments, refer to Table 1 for further details.
The experimental setup warrants some further
clarifications. Students in subgroups with instant
feedback could upload solutions, any time of the day
Automated Evaluation and Narratives in Computer Science Education
433

Table 1: Subgroup allocation.
Experimental setting Group count
Instant feedback, Narrative 3 subgroups
Late feedback, Narrative 3 subgroups
Instant feedback, No narrative 3 subgroups
Late feedback, No narrative
(control)
5 subgroups
from anywhere with internet access. Students in sub-
groups without instant feedback had to come to the
faculty during scheduled laboratory hours and upload
solutions only in that 2 hour interval, otherwise up-
load was disabled. Test result were set up to either
show Passed/Failed and hints, to increase narrative
immersion as it was though that interacting with test
data would take away from the story. This turned out
to confuse/annoy students who would have preferred
I/O logs when they couldn’t figure out why a test
failed. Students in subgroups with narrative, chose
one narrative type at the first laboratory they came
to. After that all assignment texts including labora-
tory exams formed a narrative of that type. Students
in subgroups without narrative received a random ex-
ercise to do without much text besides technical de-
tails.
To ensure comparability of assignments between
narratives and to decrease workload, any particular
assignment had a version without narrative and one
for each of the 4 narrative types. Technically all
versions were equivalent, and thus no groups had a
harder or easier experience. For the example in Sec-
tion 3.2 the add operation expects an integer, string,
string, and an integer input. All texts for that par-
ticular exercise were constructed such to also expect
an integer, string, string, and integer as input. To
make grading comparable, all submitted solutions had
to pass all predefined tests for a given exercise to be
gradable. If there were any predefined technical re-
quirements for an exercise they also had to be done.
Once all requirements were done the student’s grade
was maximum minus the number of weeks past dead-
line.
For each student various data was gathered which
was anonymized before analysis. All uploaded so-
lutions were stored, together with their time and test
results. This allowed to check for engagement lev-
els. Anti plagiarism check results were also available.
For sanity check we asked for laboratory grades for
a course with similar skill requirements a semester
prior, and one from the same semester. A mainly Lik-
ert scale survey was was conducted at week 4 and 12
with the same questions to gauge change over time.
We added a couple of free form questions in the sec-
ond set to get more detailed data. We asked for iden-
tification on the surveys, to help ensure that students
gave honest answers, they filled out printed surveys
which were sealed in an envelope. The sealed en-
velopes then remained with them until all grading had
been done, only after that did we get access to their
data.
The questions we were interested in were about:
the degree to which text could be interesting to them,
whether they perceived text clarity, on automated test-
ing usefulness in doing and presenting their exercises,
and whether they would like to use automated testing
in other courses. The second set of survey asked about
their preferred narrative to technical ratio, and if they
were happy with their narrative choice. By the end
students uploaded a total of 5865 code variations, ac-
cumulating around 17000 test results.
3.4 Results
Various data analysis experiments have been per-
formed to verify the relations between evaluation re-
sults at lab works for students with different lab se-
tups, and, also, the relations between these lab results
and exam results at two pre-requisite examinations.
Evaluation grades were available for a number of
199 students and 3 disciplines, after all students with
no grades at all were removed from the analysis. The
disciplines at hand were the pre-requisite Fundamen-
tals of Programming (FP) and Data Structures (DS),
and the final lab grade for Object Oriented Program-
ming (OOP). The 199 students were split along their
lab work duties, in groups as follows: student items 1-
63 (with traditional lab duties), items 64-113 (with No
Story Instant Feedback), items 114-157 (with Story
Instant Feedback), and items 158-199 (with Story
Late Feedback).
Various traditional and fuzzy data analysis meth-
ods were used for this series of experiments. The
fuzzy sets theory was created by Lotfi A. Zadeh in
1965 (Zadeh, 1965) as a way to deal with vagueness
and uncertainty. A fuzzy set takes thus into account
the variate degrees of membership each data item be-
longs to classes. As Lotfi A. Zadeh himself said,
“Fuzzy logic is not fuzzy. Basically, fuzzy logic is
a precise logic of imprecision and approximate rea-
soning. More specifically, fuzzy logic may be viewed
as an attempt at formalization/mechanization of two
remarkable human capabilities. First, the capability
to converse, reason and make rational decisions in an
environment of imprecision, uncertainty, incomplete-
ness of information, conflicting information, partial-
ity of truth and partiality of possibility – in short, in an
environment of imperfect information. And second,
the capability to perform a wide variety of physical
ENASE 2020 - 15th International Conference on Evaluation of Novel Approaches to Software Engineering
434

Table 2: Survey data.
Experimental group Text Interesting Text Clarity A.T. for
creation
A.T. for pre-
sentation
A.T. preferred
No Story, Instant Feedback 3.14 2.60 3.28 3.53 3.52
Story, Instant Feedback 3.63 2.26 4.10 4.32 3.90
Story, Late Feedback 3.58 2.48 3.19 3.39 3.55
and mental tasks without any measurements and any
computations” (Zadeh, 1999; Zadeh, 2001; Zadeh,
2008).
We have used here fuzzy data analysis methods
developed in Cluj. Very effective for our purpose
are the various fuzzy clustering and fuzzy regression
methods. The Fuzzy Divisive Hierarchical Clustering
(FDHC) method, originally designed by Dumitrescu
(Dimitrescu, 1988) and extended by Pop, has been
confirmed to be able to describe the cluster substruc-
ture of data at various degrees of granularity; see, for
example, (Pop et al., 1996). The Fuzzy Linear Re-
gression (FLR) method, originally developed by Pop
and S
ˆ
arbu (Pop and S
ˆ
arbu, 1996) is most effective at
dealing with outliers, as well as with heteroskedastic
and homoskedastic data. We have used here an exten-
sion of the FLR for the case of linear varieties pro-
totypes of order higher than 1, i.e. two-dimensional
prototypes in a tree-dimensional space (Fuzzy Lin-
ear Varieties Regression, FLVR). We have also used
here the traditional Multiple Least Squares Regres-
sion (MLSR) method (Rencher and Schaalje, 2008)
and its fuzzy variant (FMLSR), developed using the
same mechanism outlined in (Pop and S
ˆ
arbu, 1996).
3.4.1 Linear Regression Testing
We try to determine the relationships between exami-
nation grades at pre-requisite exams and the final lab
grade for all 199 students, as they were distributed in
the four classes of lab work setup. The equation of
the regression plane computed for all the three meth-
ods we have used is described in Table 3.
Table 3: Equations of the regression planes.
Equation: OOP =
MLSR 1.03032 + 0.10148 FP + 0.67748 DS
FMLSR 0.02429 + 0.14382 FP + 0.77618 DS
FLVR 0.13274 + 0.00120 FP + 0.92084 DS
In order to evaluate the quality of the regression
planes, the coefficient of determination R
2
has been
computed. The comparative values of R
2
are depicted
in Table 4. They show a very good value for the Fuzzy
Linear Varieties Regression method.
All these methods show the same trend. That the final
lab grades of all the 199 students are mostly correlated
Table 4: Coefficients of determination R
2
.
MLSR 0.72134
FMLSR 0.69897
FLVR 0.67767
with the final grade at the Data Structures discipline,
with a rather irrelevant dependency on the grade at the
Fundamentals of Programming discipline. This is im-
portant, because a simple analysis of the correlation
matrix is less relevant here, as the Table 5 shows.
Table 5: Correlation matrix for the grades at FP, DS, OOP.
1 0.775861 0.697716
0.775861 1 0.846868
0.697716 0.846868 1
3.4.2 Cluster Substructure Testing
We now try to determine whether a cluster analysis
of the set of grades for the same 199 students with 3
disciplines is structured in any was around the four
pre-labelled classes. This is relevant, since our aim
is to see how the level of preparation of students is
related to the choice for a particular lab work setup.
At this point we have used the FDHC algorithm, with
a fuzzy partition threshold of 0.4. This led to a fuzzy
clustering hierarchy of four classes, as described in
Table 6.
It is quite interesting to remark that the structure
of the fuzzy prototypes (centroids) of the four final
fuzzy classes, show a notable grade split-up, confirm-
ing that the identified four classes cluster substructure
is indeed real, as we see in Table tab:fuzzy-cluster-
centers. As well, the centroids of the four initial
classes are depicted in Table 8.
The fact that the students of the control group are
mostly placed in the higher-grades classes may seem
to indicate a different grading performed by another
teacher. Also, these results may seem to show overall
higher grades to FP as compared to DS and OOP.
There is less correlation between the four final
classes and the four pre-labelled classes. However,
an analysis of the centroids seems to indicate a bet-
ter students evolution for the Story-Instant class, with
students reaching higher final lab grades at OOP from
a lower grade standing for FP and DS.
Automated Evaluation and Narratives in Computer Science Education
435
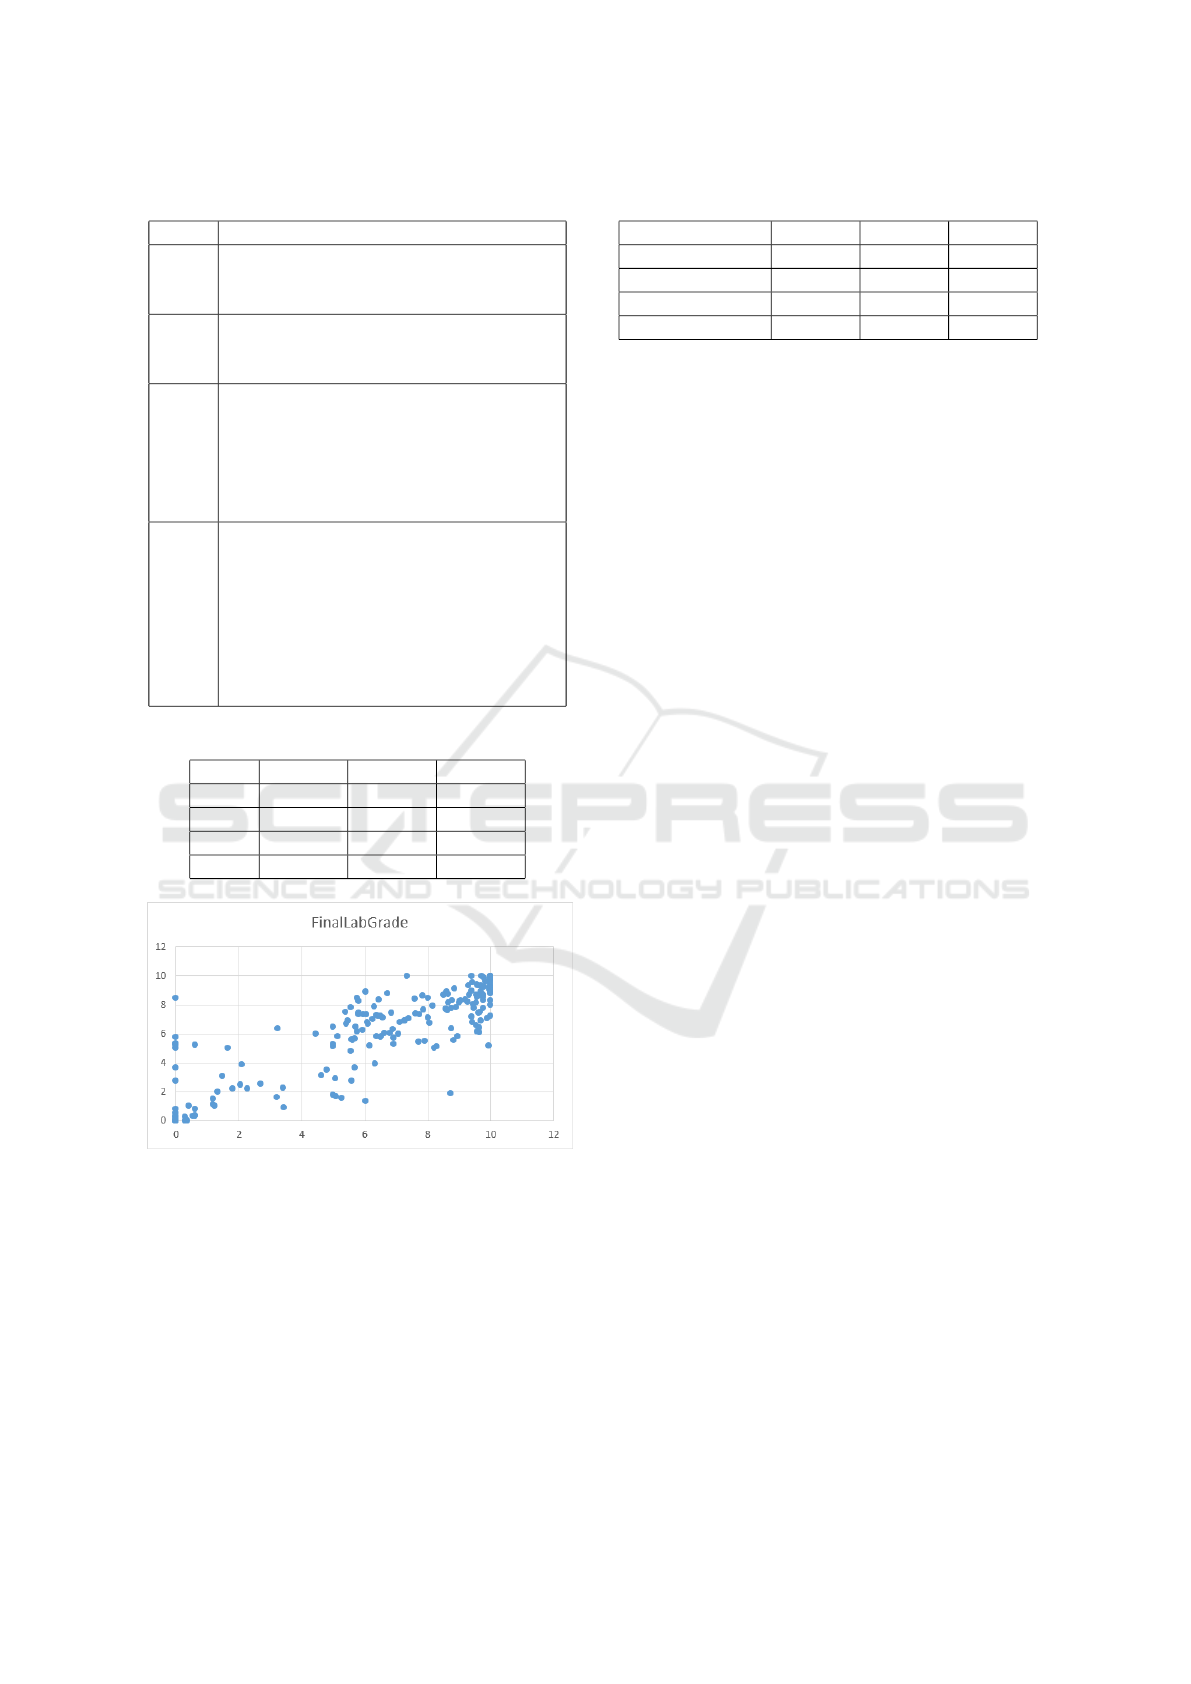
Table 6: Final fuzzy partition.
Class Items
1.1 13 22 24 25 70 71 75 77 82 87 88 93 97
98 99 118 125 139 142 147 148 153 157
167 168 169 170 175 181 186 187 198
1.2 19 21 26 32 36 64 83 86 96 102 103 112
116 121 129 130 144 158 159 171 173
176 182 191 196 199
2.1 4 5 9 14 16 20 23 27 28 29 33 34 40 41
42 43 44 48 49 51 58 60 62 63 65 66 68
69 79 81 90 95 104 105 117 120 122 124
127 128 132 136 140 141 145 146 149
150 151 155 156 161 163 165 166 174
177 183 185 188 192
2.2 1 2 3 6 7 8 10 11 12 15 17 18 30 31 35
37 38 39 45 46 47 50 52 53 54 55 56 57
59 61 67 72 73 74 76 78 80 84 85 89 91
92 94 100 101 106 107 108 109 110 111
113 114 115 119 123 126 131 133 134
135 137 138 143 152 154 160 162 164
172 178 179 180 184 189 190 193 194
195 197
Table 7: Centroids of the final fuzzy partition.
Class FP DS OOP
1.1 5.66689 2.27304 1.92099
1.2 0.82834 0.66195 1.66045
2.1 8.03091 6.58492 6.61258
2.2 9.40195 9.43486 8.62232
Figure 3: All students final lab grades vs DS grades.
Survey data must also be mentioned, the centroids for
the Likert scale results can be found in Table 2. Since
the control group did not use the automated testing at
all, questions regarding automated testing do not ap-
ply, hence they were removed. Overall the trend is
clear: text is more interesting with story elements and
automated testing is preferred with instant feedback.
As discovered from the free form responses, the val-
ues at text clarity actually refer to test result clarity.
Table 8: Centroids of the initial classes.
Class FP DS OOP
Control 7.84515 7.17269 7.03039
NoStory-Instant 7.04090 6.29840 5.66195
Story-Instant 6.75988 5.98888 6.09366
Story-Late 6.74243 5.41414 4.92890
4 CONCLUDING REMARKS
We set out to investigate gamification elements in
comparison with traditional teaching techniques. This
is an ongoing basic research which warrants further
study. The tool developed to aid in gamification tech-
niques greatly increased teacher time to assist with
technical difficulties, and to do more code review. All
the while the experiments it yields generate a wealth
of data.
We used various fuzzy data analysis techniques to
capture the relationships between different examina-
tions for relevant student groups. We were able to re-
mark a better students evolution for the Story-Instant
class as well as a very good correlation of the OOP
final lab grade with the pre-requisite DS grade. We
were able to identify grade-based student groupings,
confirming slightly higher FP grades for students as
compared to DS and OOP grades.
It must be reiterated that the validity of the results
is strengthened by the existence of control groups,
random allocation of groups, survey gathering tech-
nique, and grade comparison with similar courses for
the same students. All the while there are inherent
limitations in the limited scope of the study when
addressing the research questions. The knowledge
gained during the experiment will help in future ex-
perimental design, and tool improvements. From free
form responses the two most asked for features were:
improved test result feedback, and an option for a no
narrative for those who only want to see technical re-
quirements.
There is great potential int this line of research and
further gamification elements need to be compared to
the story and instant feedback variant. Prototypes of
the tool with static code analysis proved promising
which lends itself to achievements and mastery me-
chanics. A parallel research branch concerns itself
with the use of ontologies, to personalize gamifica-
tion user experience, to the personality traits of the
students.
ENASE 2020 - 15th International Conference on Evaluation of Novel Approaches to Software Engineering
436

REFERENCES
Amriani, A., Aji, A. F., Utomo, A. Y., and Junus, K. M.
(2013). An empirical study of gamification impact on
e-learning environment. In Proceedings of 2013 3rd
International Conference on Computer Science and
Network Technology, pages 265 – 269. IEEE.
Cheang, B., Kurnia, A., Lim, A., and Oon, W.-C. (2003).
On automated grading of programming assignments
in an academic institution. Computers —& Education
41, page 121 – 131.
Chrysafiadi, K., Troussas, C., and Virvou, M. (2018).
A framework for creating automated online adaptive
tests using multiple-criteria decision analysis. In 2018
IEEE International Conference on Systems, Man, and
Cybernetics (SMC), pages 226–231. IEEE.
Deterding, S., Dixon, D., Khaled, R., and Nacke, L. (2011).
From game design elements to gamefulness: Defin-
ing gamification. In Proceedings of the 15th inter-
national academic MindTrek conference: Envisioning
future media environments, volume 11, pages 9 – 15.
ACM.
Dicheva, D., Dichev, C., Agre, G., and Angelova, G. (2015).
Gamification in education: A systematic mapping
study. Educational Technology & Society, 18:75–88.
Dimitrescu, D. (1988). Hierarchical pattern classification.
Fuzzy Sets and Systems, 28:145–162.
Forsythe, G. E. and Wirth, N. (1965). Automatic grading
programs. Communications of the ACM, 8(5), pages
275 – 529.
Fu, X., Peltsverger, B., Qian, K., Tao, L., and Liu, J. (2008).
Apogee: automated project grading and instant feed-
back system for web based computing. In ACM
SIGCSE Bulletin, volume 40, pages 77–81. ACM.
Hage, J., Rademaker, P., and van Vugt, N. (2010). A com-
parison of plagiarism detection tools. Technical Re-
port UU-CS-2010-015.
Hamari, J., Koivisto, J., and Sarsa, H. (2014). Does gamifi-
cation work? - A literature review of empirical studies
on gamification. In HICSS, volume 14, pages 3025–
3034.
Leong, B., Koh, Z. H., and Razeen, A. (2011). Teaching
introductory programming as an online game. De-
partment of Computer Science, National University of
Singapore.
Majuri, J., Koivisto, J., and Hamari, J. (2018). Gamifica-
tion of education and learning: A review of empiri-
cal literature. In Proceedings of the 2nd International
GamiFIN Conference, GamiFIN 2018. CEUR-WS.
Palomino, P. T., Toda, A. M., Oliveira, W., Cristea, A. I.,
and Isotani, S. (2019). Narrative for gamification in
education: Why should you care? 2019 IEEE 19th In-
ternational Conference on Advanced Learning Tech-
nologies (ICALT), pages 97–99.
Pop, H. F. and S
ˆ
arbu, C. (1996). A new fuzzy regression
algorithm. Analytical Chemistry, 68:771–778.
Pop, H. F., S
ˆ
arbu, C., Horowitz, O., and Dumitrescu, D.
(1996). A fuzzy classification of the chemical ele-
ments. Journal of Chemical Information and Com-
puter Sciences, 36:465–482.
Po
ˇ
zenel, M., F
¨
urst, L., and Mahni
ˇ
c, V. (2015). Introduc-
tion of the automated assessment of homework as-
signments in a university-level programming course.
In 2015 38th International Convention on Information
and Communication Technology, Electronics and Mi-
croelectronics (MIPRO), pages 761–766. IEEE.
Raftopoulos, M., Walz, S., and Greuter, S. (2015). How
enterprises play: Towards a taxonomy for enterprise
gamification. In Conference: Diversity of Play:
Games–Cultures-Identities. DiGRA. Recuperado de
https://goo. gl/3PD4f9.
Rencher, A. C. and Schaalje, G. B. (2008). Linear models
in statistics. John Wiley & Sons.
Rottmann, R. M. and Hudson, H. (1983). Computer grad-
ing as an instructional tool. Journal of college science
teaching, 12, pages 152 – 165.
Ruip
´
erez-Valiente, J. A., Mu
˜
noz-Merino, P. J., and Del-
gado Kloos, C. (2017). Detecting and clustering
students by their gamification behavior with badges:
A case study in engineering education. Interna-
tional Journal of Engineering Education, 33(2-B):816
– 830.
Sailer, M., Hense, J., Mandl, H., and Klevers, M. (2013).
Psychological perspectives on motivation through
gamification. Interaction Design and Architecture(s)
Journal, pages 28–37.
Schleimer, S., Wilkerson, D. S., and Aiken, A. (2003). Win-
nowing: local algorithms for document fingerprinting.
In Proceedings of the 2003 ACM SIGMOD interna-
tional conference on Management of data, pages 76–
85. ACM.
Skinner, B. F. (1935). Two types of conditioned reflex and a
pseudo type. Journal of General Psychology 12, pages
66 – 77.
Taylor, J. A. and Deever, D. L. (1976). Constructed-
response, computer-graded homework. American
Journal of Physics, 44, pages 598 – 599.
Von Matt, U. (2001). Kassandra: The automatic grading
system. ACM Special Interest Group on Computer
Uses in Education Outlook, 22.
Zadeh, L. A. (1965). Fuzzy sets. Information and Control,
8:338–353.
Zadeh, L. A. (1999). From computing with numbers to
computing with words – from manipulation of mea-
surements to manipulation of perceptions. IEEE
Transactions on Circuits and Systems, 45:105–119.
Zadeh, L. A. (2001). A new direction in ai – toward a com-
putational theory of perceptions. AI Magazine, 22:73–
84.
Zadeh, L. A. (2008). Is there a need for fuzzy logic? Infor-
mation Sciences, 178:2751–2779.
Zsigmond, I. (2019). Automation and gamification of com-
puter science study. Studia Universitatis Babes
,
-Bolyai
Informatica, 64(2):96–105.
Automated Evaluation and Narratives in Computer Science Education
437
