
Designing a Decision Support System for Predicting Innovation
Activity
Olga N. Korableva
1a
, Viktoriya N. Mityakova
2b
and Olga V. Kalimullina
3c
1
St. Petersburg State University, Institute of Regional Economic Studies of Russian Academy of Science,
S-Petersburg, Russian Federation
2
St. Petersburg Electrotechnical University "LETI" (ETU), S-Petersburg, Russian Federation
3
The Bonch-Bruevich Saint-Petersburg State University of Telecommunications, S-Petersburg, Russian Federation
Keywords: Decision Support System, Innovation Activity, Potential of Economic Growth, Ontology, Semantic Search.
Abstract: Decision support systems for predicting innovation activity at the macro level are not yet widely used, and
the authors have not been able to find direct analogues of such a system. The relevance of creating the system
is due to the need to take into account heterogeneous structured and unstructured information, including in
natural language, when predicting innovation activity. The article describes the process of designing a
decision support system for predicting innovation activity, based on the system for integrating macroeconomic
and statistical data (described by the authors in previous articles) by adding a module of decision-making
methods. The UML diagram of use cases and the UML diagram of the components of this module, the general
architecture of the prototype of the decision support system, are presented. It also describes an algorithm for
predicting innovation activity and its impact on the potential for economic growth using DSS.
1 INTRODUCTION
The progressive development of the country's
economy and its level of competitiveness are
inextricably linked to innovation activity. However,
the concept under study is extremely complex and for
its comprehensive assessment, it is necessary to
evaluate a variety of indicators, both quantitative and
qualitative. Innovation, investment, efficiency of
knowledge management, problems of transferring
knowledge from the fundamental to the practical
sphere, influence of intellectual capital, susceptibility
to innovations, as well as other factors need to be
taken into account in order to assess and predict
innovation activity.
Until now, the problem of automating the process
of collecting and processing heterogeneous
information in order to forecast innovation activity at
the macro level has only been partially solved.
The previous stage of the study described a system
for collecting macroeconomic and statistical data
based on the ontology of innovation activity and
a
https://orcid.org/0000-0002-2699-8396
b
https://orcid.org/0000-0003-3772-7943
c
https://orcid.org/0000-0002-7782-6148
economic growth potential (Korableva et al., 2018,
2019). Forecasting innovation activity and its impact
on the potential of economic growth is a labor-
intensive process that requires a lot of time and effort
to prepare parameters for models, as well as to
perform calculations. Creating a decision support
system that provides models for predicting innovation
activity at the macro level and its impact on economic
growth potential by analyzing data from various types
of sources (PDF, HTML, XLS, web services) would
significantly increase the accuracy of forecasts of
innovation activity, and, as a result, the effectiveness
of decision-making in the field of managing a
country's innovation development.
2 LITERATURE REVIEW
The most complete analysis of the DSS is given in the
article (Wagner, 2017), affecting 311 systems. Let us
consider the most important comparative
characteristics.
Korableva, O., Mityakova, V. and Kalimullina, O.
Designing a Decision Support System for Predicting Innovation Activity.
DOI: 10.5220/0009565706190625
In Proceedings of the 22nd International Conference on Enterprise Information Systems (ICEIS 2020) - Volume 1, pages 619-625
ISBN: 978-989-758-423-7
Copyright
c
2020 by SCITEPRESS – Science and Technology Publications, Lda. All rights reserved
619

* The most popular areas of application of expert
systems are accounting and financial services,
manufacturing and medicine.
* The most popular way to acquire knowledge is to
interview an expert in the subject area, including
using questionnaires. Dependency diagrams,
knowledge maps, cognitive maps, and decision trees
are also used. The recent growth of popularity of
automated knowledge acquisition methods may be
related to increased interest in neural networks and
ontologies. In addition, the multi-criteria group
decision-making (MCGDM) method (Xue et al.,
2020) is noteworthy.
* Rules are widely usable way to represent
knowledge, while frames and cognitive maps are less
popular.
The most complete analysis of the DSS is given in the
article (Wagner, 2017), affecting 311 systems.
Consider the most important comparative
characteristics.
* The most popular areas of application of expert
systems were accounting and financial services,
manufacturing and medicine.
The literature covers the process of developing a
DSS (Kossiakoff et al., 2011), describes in detail the
process of elaborating a rules-based DSS. In (Dokas
and Alapetite, 2006), modifications are described for
developing DSS as a web application in order to
increase the availability of the system via the Internet.
In General, it can be concluded that the scientific
community is interested in DSS and actively
developing methods for their building, including
using neural networks and big data processing.
DSS are the most common in areas that have a
fairly limited set of input parameters (compared to the
model at the macro level). For example, the model for
predicting the behavior of future customers provides
key information for effectively directing resources to
sales and marketing departments, planning inventory
in the warehouse and at points of sale, and for making
strategic decisions in the production process
(Martínez et al., 2020). A model for predictive group
maintenance for multi-system multicomponent
networks (MSMCN) is also interesting (Liang and
Parlikad, 2020). The key innovation in the model is
that the developed approach combines analytical and
numerical methods to optimize the service policy of
predictive groups.
The article (Wu and Wu, 2020) presents a
decision support approach for the network structured
stochastic multi-purpose index problem. The authors
also suggest an optimization - based approach to
generating scenarios to protect against the risk of
evaluating parameters for SMILP (Stochastic Mixed
Integer Linear Program).
Building a decision support system at the macro
level involves a lot of difficulties, such as the need to
take into account a huge number of parameters, both
qualitative and quantitative. A complete analogue of
the developed system was not found. However,
platforms that support the construction of
macroeconomic models and forecasting are similar to
the function being developed, such as Dynare, which
is a software platform for processing a wide class of
economic models, in particular dynamic stochastic
general equilibrium (DSGE) and overlapping
generations (OLG) models. Dynare internally uses a
complex panel of applied mathematics and computer
technologies: multidimensional nonlinear solution
and optimization, matrix factorizations, local
functional approximation, Kalman filters and
smoothers, MCMC methods for Bayesian estimation,
graph algorithms, optimal control, etc.
(https://www.dynare.org/about/).
Also it is worth noting BI platform of a company
Prognoz http://www.prognoz.ru/platform.This is an
IT solution for creating applications that combines
modern technologies of data storage, visualization,
operational data analysis (OLAP), reporting,
modeling and forecasting of various economic
processes.
The approaches include vide range of analytical
tools and gives opportunity to make forecasts.
However, the set of tools used differs significantly
from the one designed for this study and does not
provide enough tools to evaluate qualitative non-
formalized parameters.
3 RESULTS AND DISCUSSION
3.1 The Architecture of the Prototype
of Decision Support System based
on Ontology
Decision-making process (Kossiakoff et al., 2011) in
the general case has 5 stages:
1. Planning the decision-making process, which
defines:
a. Goals and objectives
b. Type of solution
c. Solution context
d. Stakeholders
e. Legacy solutions
f. Additional data
ICEIS 2020 - 22nd International Conference on Enterprise Information Systems
620
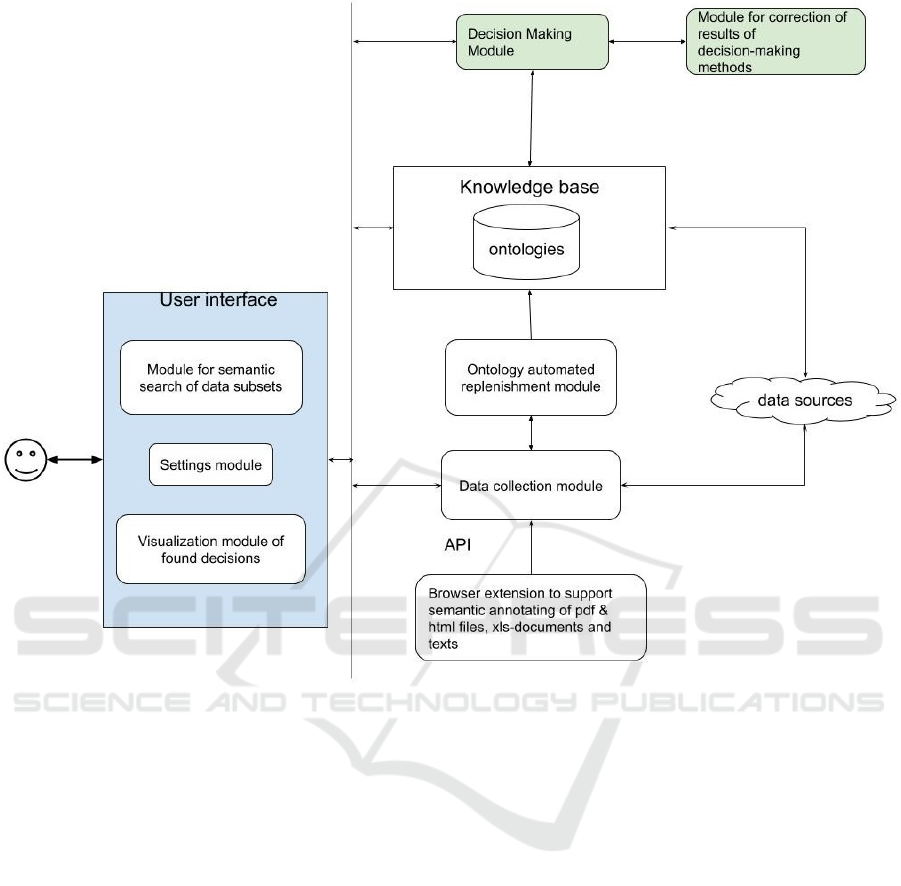
Figure 1: The General architecture of the DSS.
2. Data collection
3. Organization and processing of information
4. Taking decision
5. Implementation of decisions
In accordance with the logic of the study, point 1
was defined when determine the whole framework of
the study (Korableva et al., 2018). Then the tasks of
collecting macroeconomic and statistical data were
solved on the basis of an ontological approach and
building an ontology of innovative development and
its impact on the potential for economic growth
(automatic data aggregation system - ADAS).
At this stage, a decision support system (DSS) is
being built on the basis of the ADAS, which would
automate point 4, namely, provide models for
predicting innovation activity and its impact on the
potential for economic growth. At the current stage, a
decision support system (DSS) is being built on the
basis of ADAS, which would allow using automated
approaches for decision-making within the process of
forecasting innovation activity taking into account
multi-factor influence.
It is supposed that using this type of system will
increase the productivity of the decision-making
process and improve the quality of the decisions
themselves. The General architecture of the DSS is
shown in Fig. 1
To consider a variant of the approach to
automating forecasting, this paper describes the
process of building a prototype of a decision support
system based on the ontology of innovation activity
and economic potential growth.
Since the DSS is designed as an extension of the
ADAS, it is a client-server web application that the
user interacts with through a web interface. The web
application contains a module for collecting data from
various types of sources (PDF, HTML, XLS, web
services). Using this module, the web application
receives potential RDF triples, which are first
processed in the automated ontology replenishment
Designing a Decision Support System for Predicting Innovation Activity
621

module and stored in the knowledge base (KB). The
KB is built on the ontology of innovation activity and
economic potential. It also requests data to be
displayed in the web interface by the semantic search
system for subsets of data.
There are several types of classifications of
forecasting methods. According to one of them, all
forecasting methods can be divided into heuristic
methods, which are based on the predominance of
intuition, i.e. subjective principles, and economic and
mathematical methods, which are dominated by
objective principles (Sonina, 2014). To get a
completer and more objective picture when building
an empirical model for predicting innovation activity,
we will consider methods from both groups. The
vector autoregressive model and dynamic stochastic
model of general equilibrium are chosen as an
example of economic and mathematical approaches,
while the technological foresight method represents
heuristic methods.
Thus, several competing methods are used in the
decision-making module:
* Vector autoregressive model (VAR)
* Dynamic stochastic general equilibrium model
(DSGE)
• Neural network.
The module works as follows. The user of the DSS
submits the necessary parameters for input by
selecting them from the KB:
- For a neural network, the user selects a set of
economic indicators for the past years, based on
which it will be trained.
- For the vector autoregressive model, the user
chooses indicators for forecasting the innovation
activity of the economy as variables for building the
VAR model and the period on which the forecast will
be made.
- For DSGE, a list of parameters are selected. Some
of them are set as constants, taking into account
adaptation for the Russian economy.
This is followed by a prediction process, and
results that can be installed by the user in the decision
method adjustment module (for example, by
changing the values of input parameters or adding
them). The results obtained are used by experts in
determining forecast data, and can also be introduced
in the foresight system.
Despite the advantages of the DSGE model, there
is a criticism of it, which highlights the following
shortcomings (Andrianov et al., 2014):
* Using the concept of rational expectations, which
assumes that economic agents make the most
effective use of all available information and all
available experience when making decisions;
* Using the representative agent principle, which
reduces complex economic systems to separate
elements, and as a result neglects holistic basis of a
system;
* Applying filters depending on the selected method,
smoothing parameters, initial and final filtering
periods, and so on.
* Time-consuming procedure for deriving and
parameterizing equations.
Therefore, in the course of the study, it seems
appropriate to search for an analogue for this method,
which most fully meets the tasks set.
3.2 UML Diagram of Options for using
the Decision Methods Module
The UML diagram of the options for using the
decision-making methods module is shown in Fig.2.
Firstly, it is necessary to select the type of forecast
model.
Аlso, economic indicators and forecast period are
chosen. The indicators are submitted to the model as
input data. In the DSS, these indicators are stored in
the previously created ontology of macroeconomic
and statistical data.
Next, preliminary steps before forecasting are
performed. For DSGE models it is the calibration of
input parameters, for the VAR model – definition of
the maximum length of the lag, for the Neural
network - training on selected economic indicators
during the particular time period.
After that, the user receives the result of the
selected forecasting models, which can be viewed in
tabular and graphical form, filtered by different
criteria. The results obtained by different methods
can be compared with each other.
The models are built iteratively: each run can be
followed by a process of adjusting the results, which
changes the input parameters, and for the neural
network – training on the adjusted data.
Thus, the decision-making module works as a
"black box" for the end user: the user selects
economic indicators to submit for input (the
indicators themselves and their values for N years are
stored in the ontology), and at the output receives the
result of forecasting indicators.
3.3 UML-diagram of the Class of the
Decision Methods Module
UML-diagram of the class of the decision methods
module is shown in Fig. 3. Let us look at it
ICEIS 2020 - 22nd International Conference on Enterprise Information Systems
622
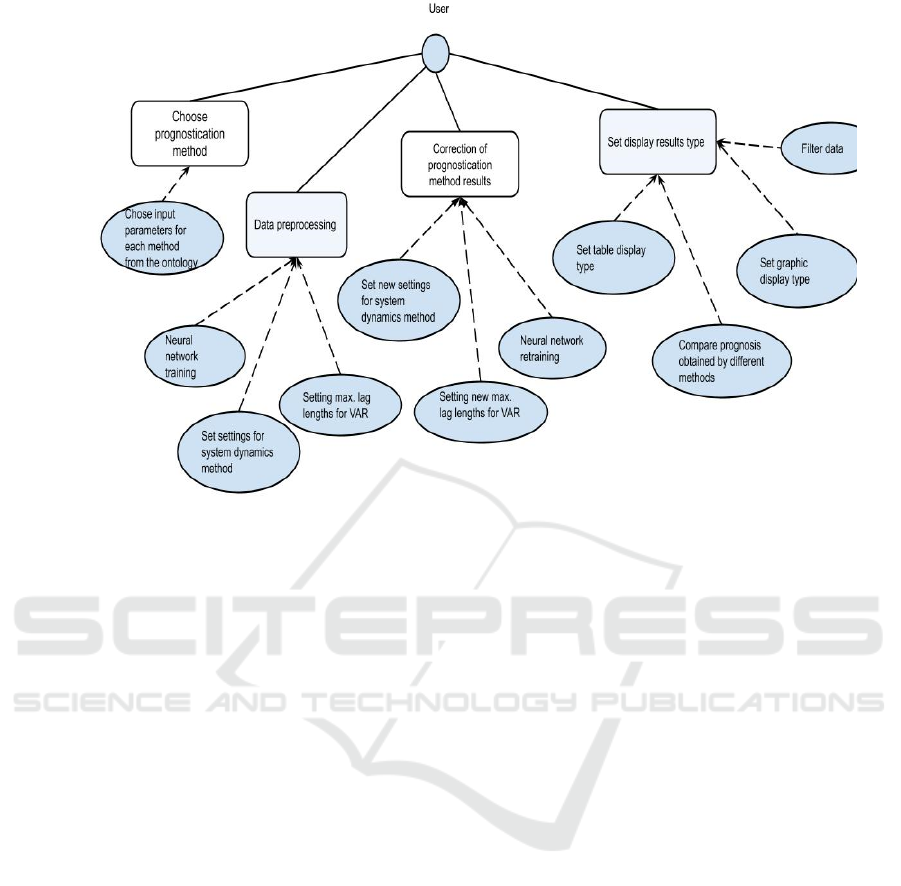
Figure 2: The UML diagram of the options for using the decision-making methods module.
in more detail. The main class for the decision module
is Solutions. The class defines functions for getting
all the getMethods () methods defined in the DSS, a
function for selecting user-defined prediction
methods for a specific case, setUserMethods (), and a
function for starting the executePrognosis ()
prediction. The app interface get accesses to these
features through the app API.
The Solutions class also stores a set of prediction
methods described using the method classes in Fig. 3.
This is DSGE, VAR, NeuroNetwork. Prediction
methods implement the Method interface. Each
method class contains a setMethodParams function to
install input parameters for the method and an
executeMethod () that performs method prediction
(used in the executePrognosis).
The input parameters for each method are
described by the DSGESettings, VARSettings, and
NeuroNetworkSettings classes, which are inherited
from the Settings interface. They contain collections
of input parameters with values for each prediction
method.
The prediction results for each method are also
described by separate classes (DSGEResult,
VARResult, and NeuroNetworkResult) and
implement the Result interface. They contain
collections of predicted parameters with values for
each method.
The classes of the prediction result correction
implement the ResultCorrection interface and contain
functions for correcting the prediction results of a
particular method by changing input parameters
(setMethodParams).
The relationships between the prediction method and
its settings, results, and correction class are shown
only for the DSGE class for clarity as sample.
3.4 Algorithm for Predicting
Innovation Activity and Its Impact
on the Potential for Economic
Growth using the DSS
Let’s take a closer look at the steps that need to be
taken when predicting innovation activity using the
DSS. Steps 1-3 were described in more detail in the
paper (Korableva et al., 2019).
1. Setting up the DSS by the operator. For the step, it
is necessary to specify:
* Initial data sources of selected types (PDF and XLS
documents, HTML pages, web services, and
ontologies);
• System parameters for collection: the frequency of
automatic collection, the need for automatic source
search, and so on;
* Queries to find new data sources.
2. The data collection system collects data
according to the algorithm depending on the types of
sources and leads to the structure of the ontology.
3. The automated ontology replenishment system
brings
data to the ontology structure and saves it to
Designing a Decision Support System for Predicting Innovation Activity
623
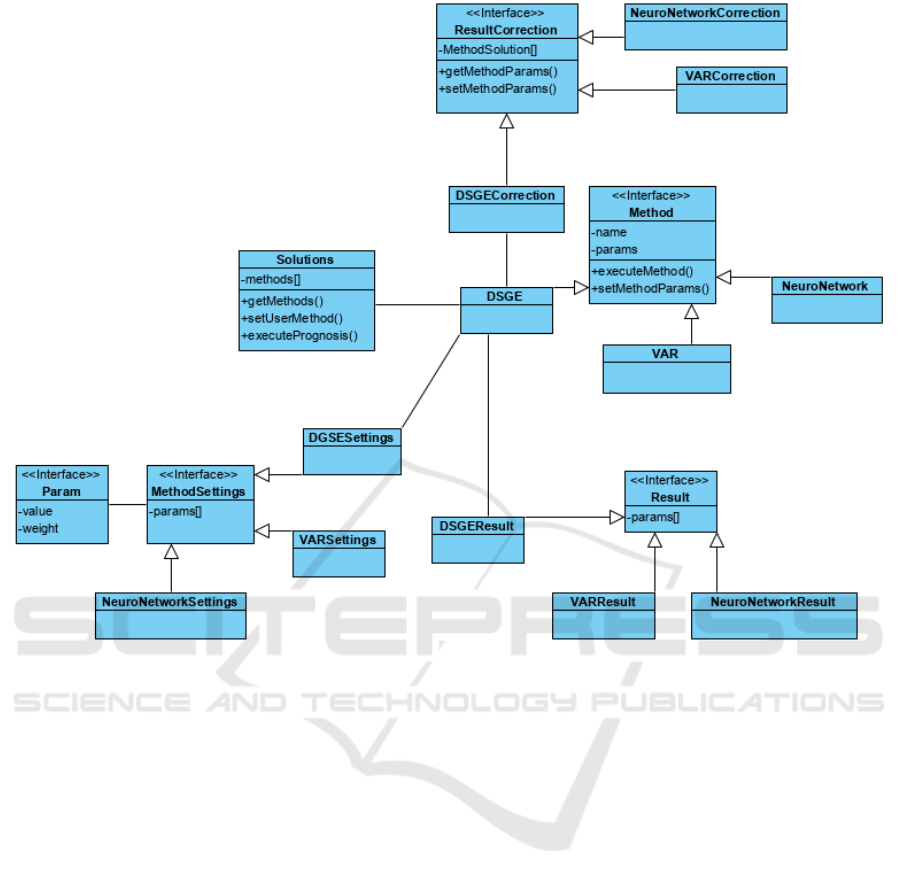
Figure 3: UML-diagram of the class of the decision methods module.
the knowledge base.
Steps 1-3 are realized iteratively for updating data and
adding new sources.
4. An operator selects economic indicators (from
those presented in the ontology) and the forecast
period, and the information is passed as input
parameters to the forecasting systems used in the DSS
(DGSE model, VAR model, neural networks).
5. The operator initiates forecasting of innovation
activity using the selected methods. The output
provides results that characterize the forecast of
macroeconomic activity (depending on the settings in
the previous step and methods).
6. Experts make adjustments to the results
obtained. In this case, the input parameters can be
changed in order to check the response of the model,
as well as to cut off the boundary values of the
predicted indicators by a specific model. For a neural
network, repeated training can occur on corrected
input data.
Steps 5-6 are also undertaken iteratively until
prediction models that satisfy the experts are got.
7. Data is transmitted to all interested parties for
use in the technological foresight and creation of the
most probable forecasting scenarios.
The developed system has been tested. The
algorithm for predicting innovation activity and its
impact on the potential for economic growth using the
DSS was used by experts to forecast macroeconomic
indicators for 2017-2019. During testing, insufficient
accuracy was revealed due to deviations in the DSGE
model. That is why further research is needed on how
to more correctly simulate expectations in DSGE
models or replace this model in the DSS.
4 CONCLUSION
This paper describes the process of designing a
decision support system for predicting innovation
activity, based on the system for integrating
macroeconomic and statistical data (described by the
authors earlier) by adding a module of decision-
making methods. The UML diagram of use cases, the
ICEIS 2020 - 22nd International Conference on Enterprise Information Systems
624

UML diagram of the components of this module, and
the General architecture of the prototype of the
decision support system are presented. It also
describes an algorithm for predicting innovation
activity and its impact on the potential for economic
growth using the DSS.
The presented DSS for forecasting of innovative
activity allows to develop a knowledge base to build
models to predict the target macroeconomic
indicators (in particular indicators of the growth
potential of the Russian Federation and innovative
activity). It also gives opportunity to automate the
process of building forecasting models for the target
macroeconomic indicators, improving the quality of
the results of the technological foresight with experts,
and make the assessment more objective and reduce
the time of forecasting.
The algorithm for predicting innovation activity
and its impact on the potential for economic growth
using the DSS has been subject to validation in the
field of forecasting of the macroeconomic indicators
for 2017-2019. In the future, it is planned to improve
the models already used, as well as finalize the
prototype of the DSS as the release version.
REFERENCES
Andrianov D.L., Schulz D.N., & Oshchepkov I.A. (2014).
Dynamic stochastic models of general economic
equilibrium. UEkS. No7 (67).
Dokas, I. & Alapetite, A. (2006). Risø-R-1570(EN) A
development process meta-model for Web based expert
systems: the Web engineering point of view.
Kossiakoff A, Sweet W. N., Seymour S. J., Biemer S. M.
(2011). Systems Engineering Principles and Practice.
Korableva, O. N., Kalimullina, O. V., & Mityakova, V. N.
(2018). Innovation activity data processing and
aggregation based on ontological modelling. Paper
presented at the 2018 4th International Conference on
Information Management, ICIM 2018, 1-4.
doi:10.1109/INFOMAN.2018.8392659
Korableva, O.N., Kalimullina, O.V., & Mityakova, V.N.
(2019). Designing a System for Integration of
Macroeconomic and Statistical Data Based on
Ontology. Advances in Intelligent Systems and
Computing, 998, p. 157-165
Liang, Z., & Parlikad, A. K. (2020). Predictive group
maintenance for multi-system multi-component
networks. Reliability Engineering and System Safety,
195 doi:10.1016/j.ress.2019.106704
Martínez, A., Schmuck, C., Pereverzyev, S., Jr., Pirker, C.,
& Haltmeier, M. (2020). A machine learning
framework for customer purchase prediction in the non-
contractual setting. European Journal of Operational
Research, 281(3), 588-596.
doi:10.1016/j.ejor.2018.04.034
Sonina O.V. (2014). Methods of forecasting the national
economy in market conditions. Diskurs-Pi. No4.
Wagner, W. P. (2017). Trends in expert system
development: A longitudinal content analysis of over
thirty years of expert system case studies. Expert
Systems with Applications, 76, 85-96.
doi:10.1016/j.eswa.2017.01.028
Wu, D., & Wu, D. D. (2020). A decision support approach
for two-stage multi-objective index tracking using
improved lagrangian decomposition. Omega (United
Kingdom), 91 doi:10.1016/j.omega.2018.12.006
Xue, M., Fu, C., & Yang, S. -. (2020). Group consensus
reaching based on a combination of expert weight and
expert reliability. Applied Mathematics and
Computation, 369 doi:10.1016/j.amc.2019.124902
Designing a Decision Support System for Predicting Innovation Activity
625
