
Gait-based Person Identification using Multiple Inertial Sensors
Osama Adel
1 a
, Yousef Nafea
1
, Ahmed Hesham
1
and Walid Gomaa
1,2 b
1
Cyber-Physical Systems Lab, Department of Computer Science and Engineering,
Egypt-Japan University of Science and Technology, Borg El-Arab, Alexandria, Egypt
2
Faculty of Engineering Alexandria University, Alexandria, Egypt
Keywords:
Gait, Person Identification, Multi-sensory, Intertial Sensors, Human-centered Computing.
Abstract:
Inertial sensors such as accelerometers and gyroscopes have gained popularity in recent years for their use
in human activity recognition. However, little work has been done on using these sensors for gait-based
person identification. Gait-based person identification turns out to be important in applications such as where
different people share the same wearable device and it is desirable to identify who is using the device at a
given time while walking. In this research, we present the first multi-sensory gait-based person identification
dataset EJUST-GINR-1 and present our work on gait-based person identification using multi-sensory data,
by mounting 8 wearable inertial sensory devices on different body locations and use this data to identify the
person using it. Two of these sensors are smart watches worn on both wrists. We explore the correlation
between each body location and the identification accuracy, as well as exploring the effect of fusing pairs of
sensory units in different locations, on the final classification performance.
1 INTRODUCTION
Inertial sensors such as accelerometers and gyro-
scopes have gained a renowned reputation in re-
cent years for their use in human activity recognition
(HAR). These sensors can capture the motion dynam-
ics of different parts of the human body, and stream
this data to a processing unit for further analysis. By
analyzing the streamed data (either in real-time or of-
fline), we can classify the motion done by a human as
one of different activities, which proved to be helpful
in a plethora of applications specifically, in the sports
and healthcare fields (Patel et al., 2012).
However, inertial sensors haven’t received enough
attention in Gait-based Person Identification. Gait-
based Person Identification using inertial sensors is
concerned with the problem of identifying a person
from a predefined set of people using one or more in-
ertial measurement units mounted on the body while
walking. It’s different from person authentication or
verification in the sense that the later addresses the
problem of identifying if a certain person is proper
one wearing the (embedded) inertial sensors or not.
Since gait patterns are unique for each individual,
given the inertial sensors readings of an individual’s
a
https://orcid.org/0000-0003-3471-5787
b
https://orcid.org/0000-0002-8518-8908
gait patterns, that individual should be correctly and
uniquely identified (Tao et al., 2018).
Machine learning algorithms (including deep
learning) have been widely used in human activity
recognition (Lara and Labrador, 2013) and should
show good results in person identification as well.
Despite the wide use of deep learning techniques,
some traditional machine learning still achieves com-
parable performance in activity recognition espe-
cially, with much less computational demands, when
the amount of data available is small (Abdu-Aguye
and Gomaa, 2019).
Person identification is of interest, for example,
when a wearable device is shared among a group of
people, and it is desirable to distinguish the person
who is wearing or using the device. It can be espe-
cially helpful in sports teams, where activity tracking
devices are shared among different members and an
automatic detection of the person wearing the device
at a given moment is desired to automatically stream
data to her profile. Hence, it has become really im-
portant to identify the person who uses the device at
that moment.
In this work, we focus on person identification us-
ing multiple inertial sensory devices mounted on dif-
ferent locations on human body. We try to answer two
questions:
Adel, O., Nafea, Y., Hesham, A. and Gomaa, W.
Gait-based Person Identification using Multiple Inertial Sensors.
DOI: 10.5220/0009791506210628
In Proceedings of the 17th International Conference on Informatics in Control, Automation and Robotics (ICINCO 2020), pages 621-628
ISBN: 978-989-758-442-8
Copyright
c
2020 by SCITEPRESS – Science and Technology Publications, Lda. All rights reserved
621

1. Which body locations/placements for an inertial
sensory device, are the most indicative of a person
identity assuming the action of ‘walking’?
2. What is the impact of fusing pairs of those sensory
devices on the final classification performance?
To answer these two questions, we constructed a
new dataset, EJUST-GINR-1
1
, of 20 persons using
8 inertial wearable devices mounted on 8 fixed loca-
tions on each person’s body. We used three differ-
ent machine learning models for person identification:
Random Forest Classifier, Support Vector Machine
(SVM), and Convolutional Neural Network (CNN).
Each was trained in two different ways: on 8 single
sensory device data in order to investigate the impact
of differing the location of the sensor on the classifi-
cation performance, and on a fused pairs of devices,
to explore the effect of sensor fusion on person iden-
tification.
The rest of this paper is organized as follows. Sec-
tion 1 is an introduction. We present the related work
in Section 2. Section 3 is a detailed demonstration of
the data collection and cleaning process. In Section 4
we demonstrate our data pre-processing and feature
selection procedures, in Section 5 we present our ex-
periments including our machine learning models and
the metrics used for evaluating them. Then we present
our results in Section 6, and finally Section 7 is our
conclusion.
2 RELATED WORK
(Kwapisz et al., 2010) collected 3-axis accelermoeter
data from different Android smartphones inserted in
the pockets of 36 users while they perform different
activities including walking, then they divide the col-
lected data into 10-second examples, do feature ex-
traction using six basic statistical features on each
axis ending up with 43-D feature vector, and feed this
feature vector to two classifiers: a decision tree and a
neural network. Their work showed that person iden-
tification was possible with accuracy up to 90% on
walking data using neural networks.
(Ngo et al., 2014) presented the largest inertial
sensors gait database for personal authentication. The
authors collected data from 744 subjects with ages
ranging from 2 to 78 years, an almost balanced male-
to-female ratio - using 4 sensors, 3 IMUZ sensors on
the left, right and center of the waist, in addition to a
smartphone on center of the waist. Two 6-D 1-min se-
quences were recorded for each subject during walk-
ing a designed path on his normal speed. The path
1
Dataset and code are available upon request.
has a flat and a slope ground, and one of the two se-
quences was recorded on the slope ground. Then, for
authentication, a template (or gallery) was created for
the owner’s data and to decide if a new sequence of
data (a probe pattern) belonged to the same person, a
distance function was used to calculate the difference
between the gallery and the probe pattern and if the
difference was below a certain threshold, the user was
considered the legitimate one.
(Cola et al., 2016) demonstrated a light-weight
method for gait-based user authentication using data
collected from an accelermoeter wrist sensor. A pro-
file of a user is created on first-time use, then anoma-
lies in acceleration data could detect a stranger us-
ing the device. Evaluated successfully with 15 vol-
unteers with Equal Error Rate (EER) of 2.9%, they
showed that person authentication using wrist-worn
device can achieve high accuracy.
(Mondol et al., 2017) used a wrist-worn ac-
celerometer and gyroscope sensors embedded in a
smartwatch while doing a gesture in the air to authen-
ticate the user of the smartwatch. The purpose of this
work was to provide an alternative method for authen-
ticating the true owner of a smartwatch or a smart-
phone using a unique gesture. Each participant in this
study performed a unique gesture in the air, such as
performing a signature, a number of times to create
a template for his unique gesture. Then, a new user
would try to replicate his signature, and the Dynamic
Time Warping (DTW) was used to measure the devi-
ation between the two data gestures. The signature is
accepted only if the deviation is below a predefined
threshold.
As far as we know, this is the first work done on
gait-based person identification using multiple inertial
sensory devices mounted on different upper and lower
body parts, and the first to study the impact of the lo-
cation and fusion of sensory devices at different loca-
tions on the final identification performance, as well
as the first to provide a dataset collected for multi-
sensory gait-based person identification with suffi-
cient number of samples and subjects - publicly avail-
able for the research community.
3 DATASET CONSTRUCTION
We recorded walking activity data from inertial sen-
sory devices mounted on 8 locations (Figure 1) on 20
subjects, to use these data to identify the person wear-
ing the sensory devices.
All the participants in data collection of EJUST-
GINR-1 dataset are students (undergraduate and post-
graduate) at our university, with ages ranging from
ICINCO 2020 - 17th International Conference on Informatics in Control, Automation and Robotics
622
19 − 26, weights from 56 − 130 kg, heights from
146 − 187 cm, and a 1:1 male-to-female ratio. Table
1 shows an overview of the subjects in our dataset.
Table 1: An overview of the subjects in EJUST-GINR-1.
Features Min Max Mean Stdv
Age 19 26 21.15 2.30
Height (cm) 146 187 169.4 10.15
Weight (kg) 56 130 76.37 16.46
Lap time (min) 4 4.3 4.2 0.025
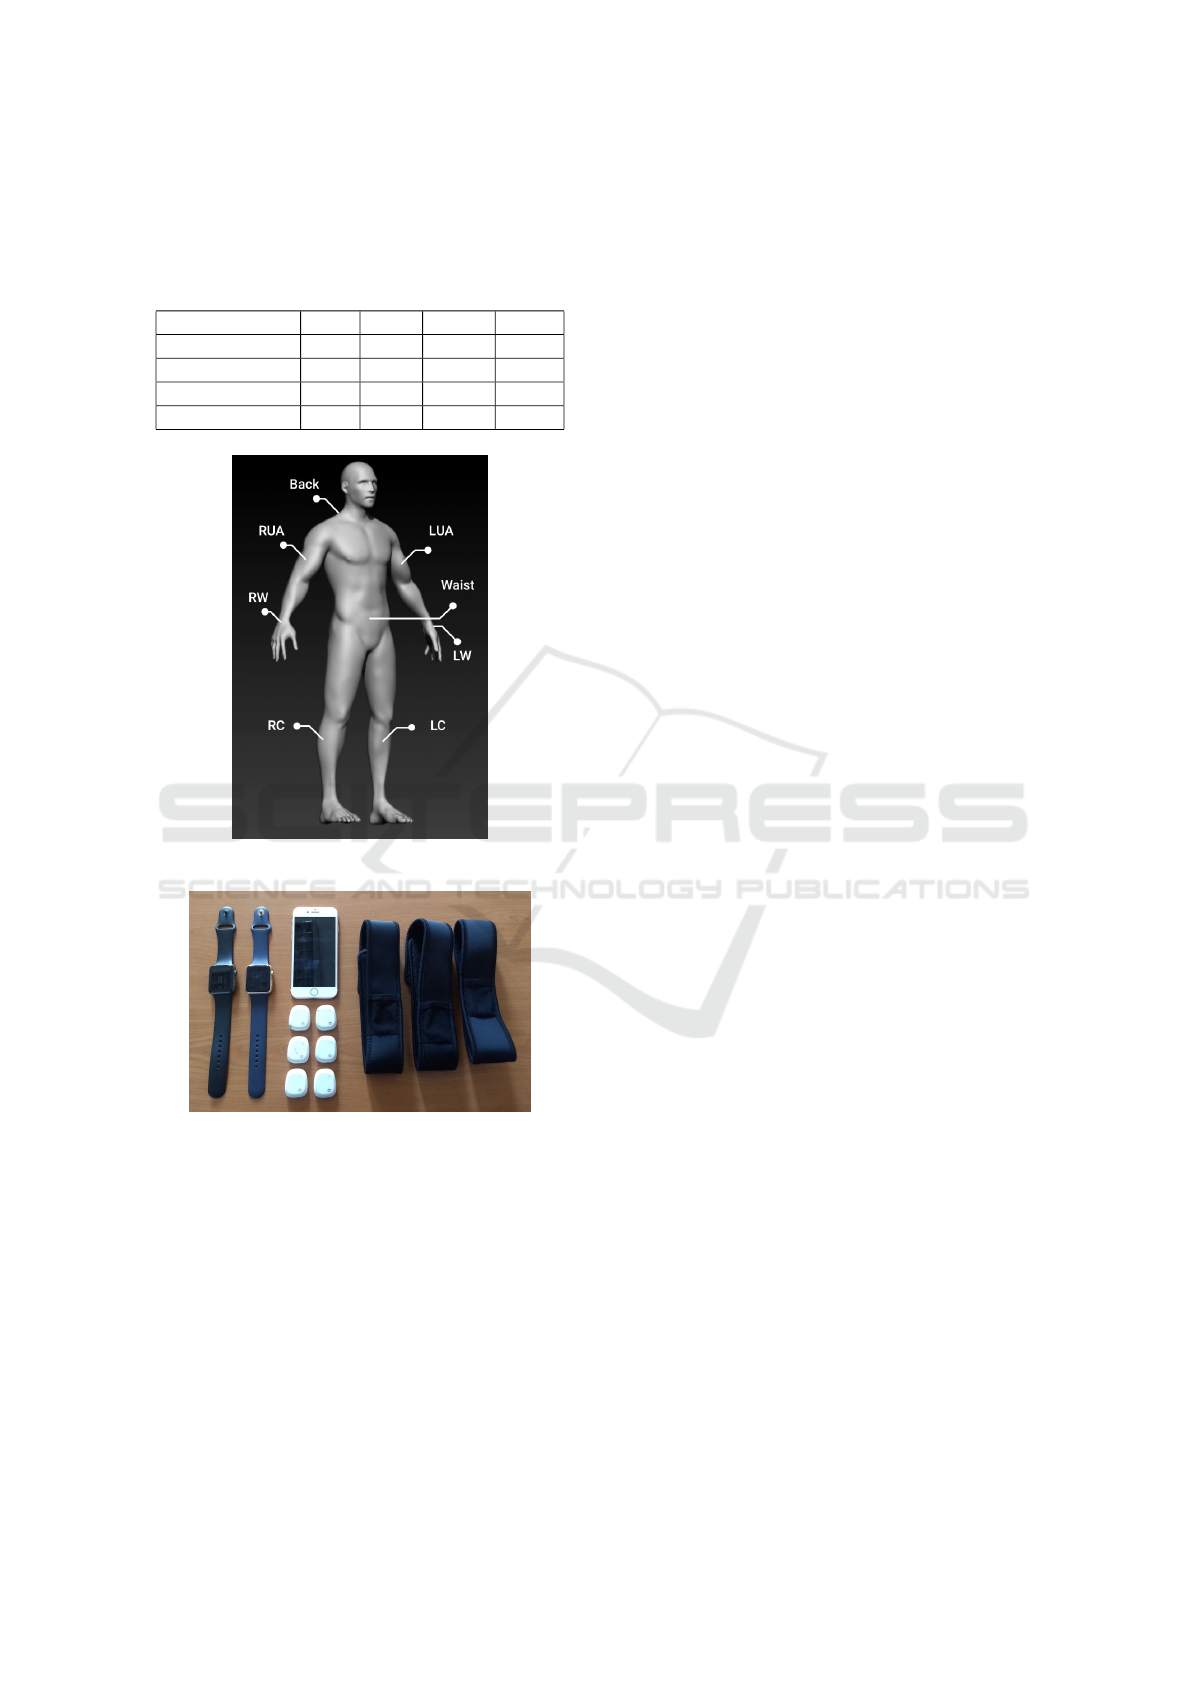
Figure 1: Locations of sensory devices on a subject’s body.
Figure 2: Data capture system. Two Apple watches on the
left, an iPhone 7 and 6 MMR devices in the middle. Three
velcro sleeves on the right.
We used two types of sensory devices in our data
capture system: Apple Watches Series 1 and Mbient-
Lab MetaMotionR (MMR) sensory devices. Two Ap-
ple watches were worn on the right and on the left
wrists (RW and LW) of the subjects, and 6 MMR
sensory devices were mounted on the following 6 lo-
cations on each subject’s body: the right upper arm
(RUA), the left upper arm (LUA), the back, the waist,
the left and right calfs (LC and RC). These locations
are illustrated in Figure 1. Additionally, we have used
an iPhone 7 in the recording activity, as all MMR de-
vices had to be connected to it during the recording
session until the data recorded is transferred, and be-
cause the data collected on the Apple watches had
also to be transferred to the iPhone after the end of
the data recording activity. Figure 2 shows the entire
data capture system described above.
Both Apple watches and MMR devices came
packed with a large number of embedded sensors
such as: 3-axis accelerometer, 3-axis gyroscope, 3-
axis magentometer, pressure sensor, humidity sensor
and others. However, we only considered the record-
ings of the 3-axis accelerometer and 3-axis gyroscope
from both the Apple watch and MMR devices at sam-
pling rate of 50 Hz.
For every recording session, each subject walked
a path (around our university’s HQ building) of about
330 meters long taking about 4 minutes on aver-
age. Each subject recorded 4 sessions with a total
of about 16 minutes of walking activity, and since
we recorded 4 laps for each of the 20 subjects, our
dataset is composed of about 5 hours of walking ac-
tivity data collected from 8 different sensory devices
synchronously.
3.1 Data Cleaning
Figure 3 shows the first 30 seconds of the 3-axis ac-
celerometer’s signals recorded from the sensory de-
vice on the Left Upper Arm (LUA) of two randomly
selected subjects (number 13 and 14). From this fig-
ure, it is obvious that there is a period (about 600 sam-
ples or 12 seconds) in the start of each session where
there is no activity done. This period of non-walking
activity is problematic since it will be fed to our mod-
els as walking activity. Certainly, this will confuse
our models and decrease their performance and con-
sequently, they must be removed. This was done by
manually inspecting the recording session of every
sensory device for every subject then trimming the
parts that showed no-activity or high levels of noise.
The final structure of our dataset is as follows:
each sensory device has a separate folder containing
20 files, each representing the data collected from one
subject and each subject’s file contains all 4 recording
sessions appended to each other. We used the Numpy
framework to store each subject’s data in .npy format,
as Numpy is the most popular Python framework for
multi-dimensional array manipulation. Each .npy file
is a M × 6 matrix, where M represents the number of
entries/samples per subject while 6 corresponds to the
concatenation of 3-axis accelerometer and 3-axis gy-
roscope columns.
Gait-based Person Identification using Multiple Inertial Sensors
623

Figure 3: The first 30 seconds of two sequences of walking activities of two randomly selected subjects recorded from the
Left Upper Arm (LUA) device.
4 METHODOLOGY
4.1 Data Preprocessing
We devised a preprocessing stage composed of 4
steps: data loading and labeling, segmentation, shuf-
fling and one-hot encoding. In the data loading and
labeling step, given a specific sensory device, we load
all the ‘.npy’ files for all subjects in the given device’s
folder, then we concatenate the corresponding labels
to them. Next is the segmentation step, where we di-
vide the loaded data into non-overlapping t-second
segments. Since we use 50 Hz as the sampling rate
across all devices and recording sessions, the total
number of segments M resulting from segmentation
of the data into t-second segments can be calculated
from the following formula:
M =
L
50 ∗t
(1)
where L is the length of samples recorded for all sub-
jects given a single sensory device. Based on the work
in (Murray et al., 1964) the average duration of one
gait cycle for men with ages from 20 to 65 is about
1.03 seconds. Since our subjects are both men and
women, and we use sensors on many different loca-
tions, we decided to set the duration of a single seg-
ment to be 5 seconds (t = 5) to make sure that each
segment contains enough information for sound clas-
sification. Therefore, given that each sensory device
recorded about 868511 samples (for all subjects) on
average, the total number of segments for each device
is M = 868511/(5 ∗ 50) ≈ 3474. After that, we shuf-
fled the data segments randomly because they were
ordered ascendingly according to the labels (from 0
to 19) and randomization would help the models train
better without bias. Furthermore, some classifiers
such as Convolutional Neural Networks require the
labels to be in one-hot encoding format, hence, we
had to convert the labels from a M-D vector to a
M × 20 one-hot encoded matrix, where M is the num-
ber of segments and 20 is the number of classes.
The result of the preprocessing stage is a list X of
M segments (calculated from Equation 1), each seg-
ment is a 250 × 6 matrix, where 250 is the number of
samples per 5-second segment and 6 is the number of
features/columns/axes per segment - in addition to a
M ×20 one-hot encoded labels matrix.
4.2 Feature Extraction (FE)
Given that each segment in list X is 250 × 6 matrix,
the dimension of the input space to our machine learn-
ing models must be in R
1500
which is huge. Moreover,
each segment represents the raw data collected from
the inertial sensors which are not useful on them-
selves. Hence, an additional step to reduce the dimen-
sionality of the input space and to extract meaningful
features is required. In this work, we use the autocor-
relation statistical feature extractor based on the work
done in (Gomaa et al., 2017).
The Auto-Correlation Function (ACF) of a sam-
pled time-series signal x
t
calculates the Pearson cor-
relation between x
t
and a shifted version of itself x
t+h
by a lag h, assuming x
t
is weakly stationary. This
can give us information about the dependency of the
signal to its shifted version (Shumway and Stoffer, ),
which can be particularly useful in periodic activities
such as walking. Therefore, given different input lags,
the Auto-Correlation Function can be calculated for
each lag h using the following formulas:
ICINCO 2020 - 17th International Conference on Informatics in Control, Automation and Robotics
624

ac f
x
(h) =
γ
x
(h)
γ
x
(0)
(2)
γ
x
(h) =
1
T
T −h
∑
t=1
(x
t+h
− ¯x)(x
t
− ¯x) (3)
where ¯x is the sample mean of the signal x and T is
the length of the sampled signal x.
Assuming that our input data sample has K fea-
tures/columns/axes, we can calculate the ACF over
each column in the input segment over a set of dif-
ferent lags. The output will be a scalar for each lag
that summarizes the T entries (where T = 250) along
one column of the input segment. We calculate the
ACF for each one of the K columns for N lags (start-
ing from N = 0), which will result in a K(N + 1)-D
feature vector as follows:
ac f
1
(0)... ac f
K
(0) ac f
1
(1)... ac f
K
(1)... ac f
K
(N)
To calculate the ACF over all M segments in our
input list X for a set of N lags, which would result in
a M × K(N + 1) features matrix, we implemented the
following algorithm (Algorithm 1):
Algorithm 1: Feature Extraction Algorithm.
input : List X, N ∈ R
output:
ˆ
X ∈ R
M×KN
Initialize
ˆ
X with zeros, i ← 0;
foreach s ∈ X do
for h ← 0 to N do
for k ← 0 to K − 1 do
ˆ
X
i,Kh+k
= ac f
k
(h) (From Eq. 2)
end
end
i ← i + 1;
end
5 EXPERIMENTS
We conducted two experiments: the first aims at ex-
ploring the effect of a single location/placement of
an inertial sensory device on the final person identi-
fication performance, whereas the goal of the second
was to investigate how fusing different pairs of iner-
tial sensory devices worn on 8 different locations on
the human body while walking (Figure 1) - affects the
person identification performance.
In both experiments, we started by loading the
data (individual devices in the first experiment, and
pairs of devices in the second), then we pre-processed
the loaded data as discussed in Section 4.1, did fea-
ture extraction as shown in Section 4.2 (choosing the
number of columns K to be 6 in the first experiment,
and to 12 in the second), and the number of lags N
to be 10 based on the work done in (Gomaa et al.,
2017), split the features matrix and the correspond-
ing labels into training and test sets (80 − 20% train-
test split), trained 3 classification models: a Random
Forest (criterion for a split is the gini-index, number
of grown trees = 100, minimum number of samples
to split a node = 2 and using bootstrapping), a Sup-
port Vector Machine (linear kernel, hinge as the loss
function, regularization parameter C = 1, maximum
number of iterations = 1000 and One-Vs-The-Rest as
the multi-class SVM implementation) and a Convo-
lutional Neural Network (as shown in Figure 5) - us-
ing the training set, evaluated the models performance
using two metrics: accuracy and f1-measure - on the
test set and eventually stored the evaluation metrics
results for each model for further analysis.
The up-mentioned pipeline (illustrated in Figure
4) was repeated for every sensory device (in the first
experiment) and each 28 possible pairs of sensors (in
the second experiment) saving the results separately.
Moreover, to ensure that our results are consistent, we
ran the previous steps 15 times, each on a different
and random train-test split (again, 80 −20% train-test
split), then taking the average of the results over the
15 trials.
6 RESULTS AND DISCUSSION
In order to interpret the results obtained in both exper-
iments, a Fusion Matrix has been constructed, where
every entry f
i, j
represents the score achieved by fus-
ing device i with device j while the entries at the di-
agonal where i = j represent the scores of individual
devices i obtained from the first experiment. The Fu-
sion Matrix is a symmetric matrix since the fusion of
device i with device j is the same in reverse. For each
classifier of the 3 we used, two Fusion Matrices have
been constructed, one for the accuracy and another for
the F1-measure.
By examining the diagonal of the 6 Fusion Ma-
trices shown in Figure 6 and 7, it is clear that the
sensory devices mounted on either the left calf (LC)
or right calf (RC) achieved the highest accuracy and
F1-measure. Using CNN, the highest accuracy and
F1-measure were achieved on the LC with 98.6% and
0.99, whereas the accuracy and F1-measure achieved
using CNN on the RC were 97.3% and 0.97, respec-
tively. On the other hand, SVM achieved 96.8% accu-
racy on LC, 96.4% accuracy on RC, 0.97 F1-measure
on LC and 0.96 F1-measure on RC. Our Random For-
est model , despite being simple, achieved 95% ac-
Gait-based Person Identification using Multiple Inertial Sensors
625

Figure 4: Stages of our experiments pipeline.
Figure 5: CNN architecture.
curacy on LC and 95.5% on RC, in addition to 0.95
F1-measure on both LC and RC. Likewise, the device
mounted on the waist was able to score 96.9% accu-
racy and 0.97 F1-measure using CNN. At about 94%
accuracy, SVM was the second best before Random
Forest, which achieved 92.7% accuracy on the same
device.
One the other hand, the sensory devices worn
on both the left wrist (LW) and right wrist (RW)
showed the worst results. Again, CNN performed bet-
ter than SVM and Random Forest, achieving 82.8%
accuracy for the LW and 82.3% for the RW. Simi-
larly, it achieved 0.83 and 0.82 F1-measures on the
LW and RW, respectively. The performance of the
other two models was close, with an edge to SVM at
about 77% and 76.4% accuracy for the LW and RW
whereas Random Forest achieved 75.6% and 74% ac-
curacy, respectively. The F1-measure of both models
achieved similar results.
Surprisingly, the identification accuracy achieved
using the data collected from the sensory device on
the back was about 96.8% with CNN, 94% with SVM
and 93% with Random Forest - despite being the fur-
thest from the lower body sensory devices. The same
goes with F1-measure with 0.97, 0.94 and 0.93, re-
spectively. This is the third best accuracy achieved
over all the devices, which means that the gait pat-
tern was clearly captured by this device, and that this
location is the best in the upper body for person iden-
tification.
The classification accuracy of the fusion of two
sensory devices can be seen in the off-diagonal en-
tries in the 3 Fusion Matrices shown in Figure 6. As
we can see, in all cases the fusion of two sensory de-
vices results in an overall accuracy higher than that of
the single lower-accuracy device. For example, The
Random Forest Classifier accuracy on data collected
from the device on the RW individually is about 74%,
however, when combined with any other device, the
accuracy drastically increases, up to 96% when com-
bined with either the RC or LC. The same is true with
SVM, as the accuracy jumps from 76% for RW up to
98% when combined with LC, which is substantially
higher than the average of their combined accuracy
(86.5%).
On the other side, this means that combining one
of the devices with very high individual accuracy with
another very low individual accuracy can result in a
degradation of the classification power gained from
the high-accuracy device. Specifically, fusing one of
the devices mounted on the lower body with another
device worn on the upper body results, in most cases,
ICINCO 2020 - 17th International Conference on Informatics in Control, Automation and Robotics
626

Figure 6: Accuracy Fusion Matrix for Random Forest, SVM and CNN.
Figure 7: F1-Measure Fusion Matrix for Random Forest, SVM and CNN.
in a lower accuracy than that of the individual lower
body device. For example, the device worn on the LC
achieves 95%, 97% and 99% accuracy with Random
Forest, SVM and CNN, respectively. When combin-
ing this device with RUA or LUA devices, the ac-
curacy drops to 94% with Random Forest Classifier,
96% with SVM and 95% with CNN.
Therefore, the best fusion of devices will be be-
tween two lower-body devices especially, LC and RC,
since they produce up to 97% accuracy even with sim-
ple classifiers such as Random Forest, and up to 98%
accuracy with SVM and CNN. However, fusing the
data from the device on the back with data from ei-
ther RC or LC also results in an accuracy up to 98%
with SVM. Besides, fusing either RC or LC devices
with RW or LW devices appears to achieve higher ac-
curacy than fusing RC or LC with RUA or LUA, up
to 98% (LC + RW under SVM).
From the previous results, it can be deduced that
the devices mounted on the lower part of the body
achieve better classification performance in general
and are more indicative of the person wearing them
while walking - than the devices mounted on the up-
per body parts. This can be attributed to the fact
that people have more freedom to move their hands
and arms while walking in different ways than they
have with their legs and waist while walking, which
may induce noise in the inertial sensors readings from
these locations. Possibly, being able to extract dis-
criminative features from such noisy data might help
increase the accuracy of models trained on such data.
However, recording data from an inertial sensory de-
vice placed on the back (of the neck) achieves second-
best performance after sensory devices placed on the
lower body. One explanation might be that the gait
patterns were transmitted almost intact through the
backbone up to this location.
Generally, SVM achieves better results compared
to CNN in the fusion of pairs of devices. This
may have stemmed from the fact that we merge the
columns in the input data in order to merge two de-
vices. However, the architecture of the CNN was de-
signed to accommodate only 6 columns. This is a
result of using the Global Max Pooling layer which
takes the maximum value out of each feature map and
returns a vector with size equal to the number of fea-
ture maps. Since the architecture of the network is
the same, doing the same convolution operations on
a larger input feature space results in a larger feature
maps at the last layer, and taking the maximum di-
rectly may have resulted in a great loss of information
and as a result, loss in classification power as well. On
the other hand, the SVM we used is with a linear ker-
nel thus, it is a linear classifier, which benefits from
Gait-based Person Identification using Multiple Inertial Sensors
627

the increase in the number of features as it adds more
separability power to it. The F1-measure closely fol-
lows the accuracy in almost all cases. This means that
our models correctly classify each person correctly
without any bias towards a single class/individual.
7 CONCLUSIONS AND FUTURE
WORK
In this work, a novel multi-sensory dataset was pre-
sented with detailed demonstration of all the steps
taken for its construction. Additionally, three differ-
ent machine learning algorithms were used to eval-
uate the new dataset, and to explore the correlation
between the on-body location of sensory device -
with the model accuracy as well as, the effect of fus-
ing pairs of sensory data from different body loca-
tions on the resultant predictive performance. It turns
out that, the sensory devices mounted on the lower
body achieved better performance (up to 99% accu-
racy) than sensors worn on the wrist or on the upper
arm. However, the sensory device mounted on the
back achieved a comparable accuracy despite being
far away from the gait.
It was also shown that fusing sensory data from
two different locations help increasing the classifica-
tion accuracy above the low-accuracy single location,
and increases the accuracy significantly if fused with
a device mounted on one of the three locations in the
lower body (up to 98%).
Finally, the data collected in this work included
only walking activity. However, in the future, we
would like to explore more activities such as: brush-
ing teeth, climbing stairs, jogging, etc., and investi-
gate if they can constitute bio-metric features for dif-
ferent people. We would also like to study the impact
of sensory devices’ location on the identification per-
formance for each activity.
ACKNOWLEDGEMENTS
This work is funded by the Information Technol-
ogy Industry Development Agency (ITIDA), Infor-
mation Technology Academia Collaboration (ITAC)
Program, Egypt – Grant Number (PRP2019.R26.1 - A
Robust Wearable Activity Recognition System based
on IMU Signals).
REFERENCES
Abdu-Aguye, M. G. and Gomaa, W. (2019). Competitive
Feature Extraction for Activity Recognition based on
Wavelet Transforms and Adaptive Pooling. In 2019
International Joint Conference on Neural Networks
(IJCNN), pages 1–8. ISSN: 2161-4393.
Cola, G., Avvenuti, M., Musso, F., and Vecchio, A. (2016).
Gait-based authentication using a wrist-worn device.
In Proceedings of the 13th International Conference
on Mobile and Ubiquitous Systems: Computing, Net-
working and Services, MOBIQUITOUS 2016, page
208–217, New York, NY, USA. Association for Com-
puting Machinery.
Gomaa, W., Elbasiony, R., and Ashry, S. (2017). Adl
classification based on autocorrelation function of
inertial signals. In 2017 16th IEEE International
Conference on Machine Learning and Applications
(ICMLA), pages 833–837.
Kwapisz, J. R., Weiss, G. M., and Moore, S. A. (2010).
Cell phone-based biometric identification. In 2010
Fourth IEEE International Conference on Biometrics:
Theory, Applications and Systems (BTAS), pages 1–7.
ISSN: null.
Lara, O. D. and Labrador, M. A. (2013). A Sur-
vey on Human Activity Recognition using Wearable
Sensors. IEEE Communications Surveys Tutorials,
15(3):1192–1209.
Mondol, M. A. S., Emi, I. A., Preum, S. M., and Stankovic,
J. A. (2017). Poster Abstract: User Authentication
Using Wrist Mounted Inertial Sensors. In 2017 16th
ACM/IEEE International Conference on Information
Processing in Sensor Networks (IPSN), pages 309–
310. ISSN: null.
Murray, M., Drought, A., and Kory, R. (1964). Walking
patterns of normal men. The Journal of bone and joint
surgery. American volume, 46:335—360.
Ngo, T. T., Makihara, Y., Nagahara, H., Mukaigawa, Y.,
and Yagi, Y. (2014). The largest inertial sensor-
based gait database and performance evaluation of
gait-based personal authentication. Pattern Recogni-
tion, 47(1):228–237.
Patel, S., Park, H., Bonato, P., Chan, L., and Rodgers, M.
(2012). A review of wearable sensors and systems
with application in rehabilitation. Journal of Neuro-
Engineering and Rehabilitation, 9(1):21.
Shumway, R. H. and Stoffer, D. S. Time series analysis and
its applications : with R examples. Springer, Cham.
Tao, S., Zhang, X., Cai, H., Lv, Z., Hu, C., and Xie, H.
(2018). Gait based biometric personal authentication
by using MEMS inertial sensors. Journal of Ambient
Intelligence and Humanized Computing, 9(5):1705–
1712.
ICINCO 2020 - 17th International Conference on Informatics in Control, Automation and Robotics
628
