
Plaboratory Asset Localization System through RFID Sensor Using
Kalman Filter Algorithm
Siti Aminah, Gungun Maulana and Mohamad Fahrezi Suyud
a
Department of Manufacturing Automation and Mechatronics, Bandung Manufacturing Polytechnic, Jalan Kanayakan No.
21, Dago, Coblong, Bandung, 40135, Indonesia
Keywords: UHF RFID, RSSI, Kalman Filter.
Abstract: Loss of assets that often occurs in the Manufacturing Automation and Mechatronics Engineering laboratory
environment at the Bandung Manufacturing Polytechnic. Where assets that should exist in certain laboratories
do not exist when learning activities will be carried out. This proposed research aims to create a laboratory
asset tracking system through UHF RFID using the Kalman filter algorithm, track the last location of
laboratory assets that have an RFID tag and have been registered in the system, limit the search area for
laboratory assets that have an RFID tag and have been registered in the system, improve laboratory asset
management system. By utilizing scanning technology using UHF RFID and creating a laboratory asset
tracking application. Where in its application the RSSI value output from unstable RFID will be estimated by
estimating a value based on known data using the Kalman filter calculation method. From the estimation
results, a classification system will be made based on 3 groups of areas that have been determined and the
estimation of the unstable RSSI value has been successfully carried out. The test results in detecting the
detected object area have an error percentage of 13.3%, but from these results there is a drawback where when
there is a transfer of assets during the detection period there will be a delay in adjusting the value to its steady-
state for approximately 25-30 seconds.
1 INTRODUCTION
This often happens in the Manufacturing Automation
and Mechatronics Engineering laboratory
environment at the Bandung Manufacturing
Polytechnic (Nur Rahmawati et al., 2020).Where
there is often loss of assets that should be in certain
laboratories to support the course of learning
activities in accordance with the courses in the
laboratory (Aminah et al., 2020).
The use of Indoor Localization technology where
this technology can determine the position of the
object or person being sought is very useful for many
applications (for example, tracking, monitoring, or
routing) in several industries such as factories, health,
and the construction industry (Fali Oklilas & Rozi,
2016) Where the position of the object can be
estimated using the RSSI (Received Signal Strength
Indication) value using the path loss calculation
algorithm (Firaldi et al., 2017)Detection can be done
by classifying the RSSI (Received Signal Strength
a
https://orcid.org/0000-0003-2400-0390
Indicator) value detected by the reader. RSSI is a
technology used to measure the signal strength
indicator received by a wireless device. However,
direct mapping of distance-based RSSI values has
many limitations, because basically, RSSI is
susceptible to noise, multi-path fading, interference,
etc. which results in large fluctuations in the received
power. (Ma’arif et al., 2020)Then a filter is needed to
minimize the fluctuation of the disturbance. To
overcome the noise problem, the Kalman filter can be
applied to filter the RSSI measurements. The true
RSSI value (without noise) is defined as the
approximate state. (Bulten et al., 2016).
Based on the problems and results of previous
research, in this final project the author will create a
smartphone-based asset position tracking system in
the Laboratory of Manufacturing Automation and
Mechatronics (AE) POLMAN Bandung. This
research uses RFID technology with passive RFID
tags and the focus of the research is to track the
position of the last area of the RFID tag that is read
Aminah, S., Maulana, G. and Suyud, M.
Plaboratory Asset Localization System through RFID Sensor Using Kalman Filter Algorithm.
DOI: 10.5220/0011710800003575
In Proceedings of the 5th International Conference on Applied Science and Technology on Engineering Science (iCAST-ES 2022), pages 31-36
ISBN: 978-989-758-619-4; ISSN: 2975-8246
Copyright © 2023 by SCITEPRESS – Science and Technology Publications, Lda. Under CC license (CC BY-NC-ND 4.0)
31
by the reader and use a cellular-based application
(smartphone). The result of the research that will be
achieved is tracking information on an asset in the AE
department laboratory using RFID technology which
will later be displayed through a mobile application.
From the results to be achieved, it is hoped that in the
future the assets of the AE department of laboratory
can be easily tracked in a lab so that asset
management in the AE department can be carried out
properly.
2 PROBLEM FORMULATION
AND SOLUTION METHODS
The system is made using RFID and utilizes the RSSI
output received by the RFID reader from the RFID
tag. The value fluctuation of RSSI will be stabilized
using Kalman filter algorithm. From the RSSI value,
it will be classified into 3 areas. the prediction results
of the detected asset area will be displayed in the
Android application so that the location of the asset
area can be monitored directly.
In making this system there are aspects that need
to be considered, namely how the RFID sensor can
find out the position of the asset being sought and the
Kalman filter algorithm that stabilizes the RSSI
value, which is then displayed on the UI prediction
results and registered asset information.
The objectives to be achieved in this research are
to create a laboratory asset tracking system through
UHF RFID using the Kalman filter algorithm, limit
the search area for laboratory assets that have RFID
tags, and improve the laboratory asset management
system so that assets can be arranged systematically.
2.1 Figure System Architecture
RFIDTag1
RFIDTag2
RFIDTag3
UHFRFIDReader ESP8266
Router
RealtimeDatabase
Thunkable
Smartphone
Airtable
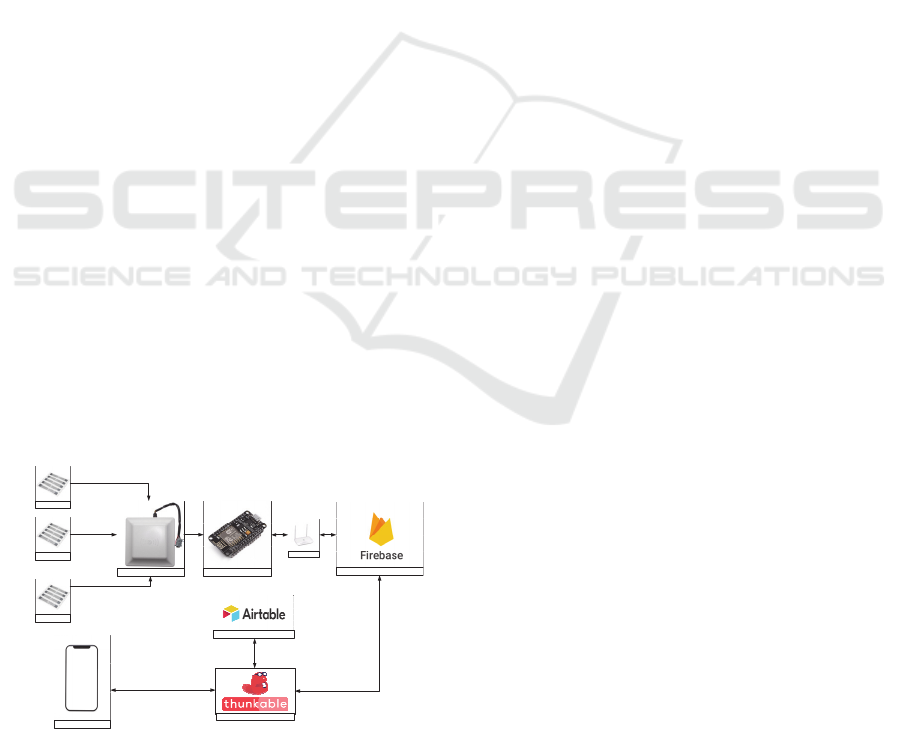
Figure 1: Figure System Architecture (source: private
collection).
The system that will be made uses technology
from RFID which functions as a tool to track the
position of the asset to be tracked. Where in this
system the RFID tag used is a passive RFID tag which
will later be detected by a UHF (Ultra High
Frequency) RFID reader. The output of the RFID is
serial data in hexadecimal format, the received data
contains information about the identity of the RFID
tag and also the RSSI (Received Signal Strength
Indicator) detected by the reader. The data will be
parsed to separate the identity of the RFID tag with
the RSSI value of the RFID tag. The RSSI value of
RFID which is very volatile because of the amount of
noise in the received RSSI value will be filtered using
the Kalman filter algorithm on the microcontroller to
stabilize the RSSI value. After filtering the RSSI
value, the system will then predict the distance
between the RFID tag and the reader and classify the
area where the RFID tag is detected.
After that the data that has been processed will be
sent to the database, the database used is firebase
where the type of database used is a realtime database
so that the operations carried out can take place in real
time. Then from the database it will be sent to the
interface which in this final project uses Thunkable as
the interface of the system which will be displayed on
a cellular application on a smartphone.
The application used is able to register a newly
registered asset by entering some information about
the asset and the existing RFID tag on the asset, the
data entered in this application will be stored in a
spreadsheet database used in this system is airtable.
The general mechanism for this final project can
be described in a flowchart where the detection of
asset positions begins with the detection of RFID tags
in the laboratory which will be detected by an
installed RFID reader. After detection, data parsing is
carried out so that the incoming data via serial is
organized and makes it easier to process the data. If
the detected RFID tag is not registered in the database
and is not entered in the Arduino program, it is
required to register first by filling in whatever
information you want to register on the RFID tag and
parsing on the Arduino according to the registered tag
id. if it is detected then there will be a value in the
form of HEX which contains information on RSSI
data generated from the signal strength detected by
the RFID reader against the RFID tag. Then the
classification of the detected tag area and calculation
of the predicted distance from the detected asset
RFID tag is carried out. After the classification is
done, the results will be displayed in the interface. In
addition, the predicted value of the distance will also
iCAST-ES 2022 - International Conference on Applied Science and Technology on Engineering Science
32

2.2 System Usage Procedure
MULAI
MENDE TEKSITAGRFID
PARSINGDATATAGRFID
KONVERSIRSSITAGRFID
DANPERHITUNGANNILAI
PREDIKSI
EPCTAGRFIDTERDAFTAR?
PARSINGPREDIKSIAREA
TERDETEKSITAGRFID
DANRFIDREADER
SELAMA±20DETIK
PENGOLAHANDATA
JARAKPREDIKSIDAN
AREATERDETEKSIASET
MENGIRIMKANDATAKE
DATABASE
MENAMPILKANDATA
DARIDATABASEKE
INTERFA CE
SELESAI
DAFTARKANTAGRFID
SEBAGAIASETBARUDAN
MELAKUKANPARSING
PADAPROGRAM
ARDUINO
A
A
FILTERISASIOUTPUTRSSI
DARIRFIDREADER
Figure 2: System Flowchart Image. (source: private
collection).
be displayed on the interface. After the area and
distance calculation of the RFID tag asset position are
generated, the microcontroller will update the
database according to the results obtained and the
information will be displayed on the interface.
2.3 System and Software Design
In this detection system, 1 UHF RFID reader of type
HW-VY06K is used and also several objects with
RFID tags attached to implement the search for goods
through RFID. For communication between the
sensor and the microcontroller via RX and TX from
the sensor or microcontroller, serial software is
needed in the communication which will produce
some information about the tag which can be defined
as shown in Figure 3.
Figure 3: Picture of RFID response parameters
(source:(Nur Rahmawati et al., 2020)).
Which requires 2 parameters of the RFID
response for the system here, namely the EPC
parameter as the identity of the detected RFID Tag
and also RSSI as the signal strength value detected by
the RFID Reader. These values will be detected in a
hexadecimal number format which is specifically for
the RSSI value itself, it is necessary to convert the
hexadecimal format into two's complement form
which will show the signal strength in dBm units
received by the reader.
2.3.1 Asset Detection Area Plan Design
The system design is done by creating a detection area
which is divided into 4 detection areas from the RFID
tag where each area has an area of 1 m2, for the reader
position to be placed in a position that is assumed to
be position 0 so that the detection will only have a
position on the positive x axis and y axis. positive.,
for the direction of the reader is positioned to lead ±
45°with a height of 1,5m from the reader to the floor
.
Figure 4: Asset Detection Area Plan Image (source: private
collection).
This area grouping is based on detecting the RSSI
value in each area where the range of values of each
detected RSSI value in the area is used as a value to
classify the position of the detected asset, if the read
RSSI value is in the range of values in that area, then,
the variable of the area will contain the identity of the
area.
Plaboratory Asset Localization System through RFID Sensor Using Kalman Filter Algorithm
33

2.4 Electrical Design
Figure 5: Schematic Circuit Drawing. (source: private
collection).
In Figure 5 there is a schematic wiring diagram of the
system that has been created. Where to communicate
between the RFID sensor and the microcontroller a
MAX232 component is needed as an RS232 to TTL
converter where for the wiring configuration from
RS232 only uses the ports for RX, TX, and ground
from the sensor. The RX and TX of the sensor are
adjusted to the port on the MAX232 and then
forwarded to the sensor via TTL communication
where RX from MAX232 to TX on the
microcontroller while TX from the sensor to the RX
port of the microcontroller
.
2.5 Path Loss
For the calculation of the RSSI to the distance in
meters can be seen in the equation below.
𝑑𝑑
.10
.
( 1 )
d = Distance of RFID Tag to RFID Reader
C = Signal strength at reference distance
RSSI = Signal strength received by Reader
n = Path loss exponent
The path loss coefficient is an important parameter
where this value is different for each environment
according to the conditions in the environment. It can
be seen in the table for the grouping of exponential
values for different types of regions and
environments.
2.6 Kalman filter
Kalman filter is a state estimator that makes estimates
of several unobserved variables based on noise
measurements. (Bulten et al., 2016) Kalman filter
serves to estimate a value based on known data. The
main function of the kalman filter is not to filter or
filter the incoming signal, but to estimate it according
to the given input. The Kalman filter equation
consists of 2 parts, namely the prediction section and
the update section as follows.
Table 1: Table of path loss exponent values for each type of
area (source :(Nur Rahmawati et al., 2020)).
Environment Path Loss Exponent, n
Free space 2
Urban area celullar radio 2.7 to 3.5
Shadowed urban celular
radio
3 to 5
In building line-of-sight 1.6 to 1.8
Obstructed in building 4 to 6
Obstructed in factories 2 to 3
Prediction :
𝑥
|
𝐹
𝑥
|
𝐵
𝑈
( 2 )
𝑃
|
𝐹
𝑃
|
𝐹
𝑄
( 3 )
Update :
𝑥
|
𝑥
|
𝐵
𝑦
𝐻
𝑥
|
( 4 )
𝐾
𝑃
|
𝐻
𝐻
𝑃
|
𝐻
𝑅
( 5 )
𝑃
|
I𝐾
𝐻
𝑃
|
( 6 )
where 𝑥 is the state estimate, F is the transition
matrix, u is the control variable, B is the control
matrix, P is the state variation matrix, Q is the process
variation matrix, y is the measurement variable, H is
the calculation matrix, K is the kalman reinforcement,
R is measurement variation matrix. (Ma’arif et al.,
2019).
2.7 Testing Procedure Design
The software testing that has been made consists of
testing the characteristics of detecting signal strength
by an RFID reader and testing the level of accuracy
in detecting asset areas. In calculating the error
percentage in the system, the Mean Absolute
Percentage Error (MAPE) calculation formula is
used. Where MAPE uses the actual value reference
minus the predicted value of the system and divided
by the actual value of the test. For more details, see
the MAPE formula below.
𝑀𝐴𝑃𝐸
100
𝑛
𝐴𝑡 𝐹𝑡
𝐴𝑡
( 7 )
n : Total data
At : Actual result value
Ft : Test result value
iCAST-ES 2022 - International Conference on Applied Science and Technology on Engineering Science
34
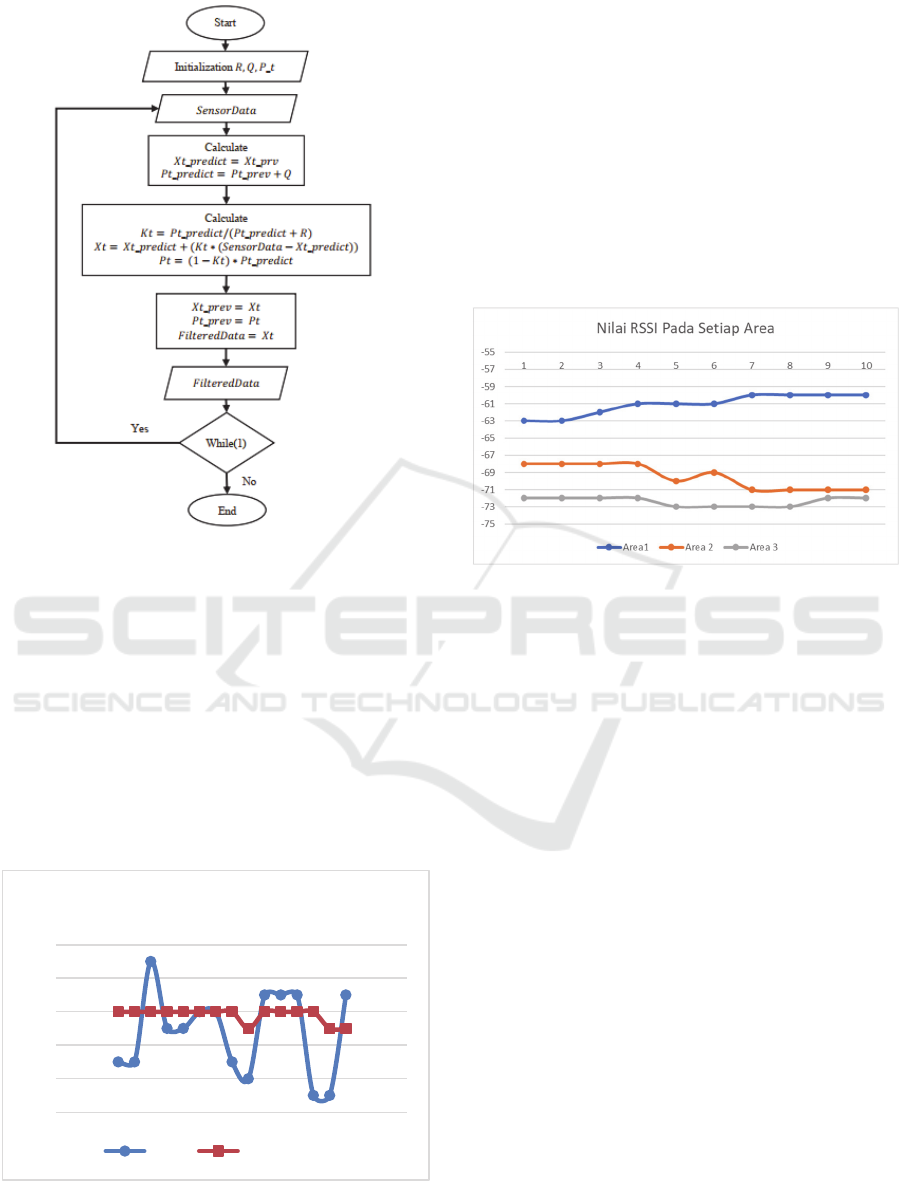
Figure 6 : Picture of the Kalman filter Algorithm Flowchart
(source:(Ma’arif et al., 2019)).
3 RESULTS
3.1 RSSI Testing using Kalman Filter
Testing is done by adding the kalman filter algorithm.
The test is carried out by placing an asset that has an
RFID tag at a distance of 2 meters for the distance
from the RFID tag to the position of the RFID reader.
The following in Figure 7 is the result of testing
the RSSI value against the filtered RSSI value.
Figure 7: Comparison of RSSI Value Against Filtered
RSSI Value. (source: private collection).
The comparison data can be seen in the graph in
Figure 7, which shows the change in the RSSI signal
which has a lot of noise but with the Kalman filter
algorithm it can reduce the noise significantly.
However, the response obtained from changing the
filter will be slow when there is a change in the
position of the asset.3.2 RSSI Value Reading in
Each Detection Area.
In testing the RSSI readings in each asset
detection area, the area has been determined for the
size of each area as in Figure 4, for the results of the
RSSI reading in each detection area can be seen in the
graph in Figure 8 below.
Figure 8: Graph of RSSI value in each detection area.
(source: private collection).
For area 1, it can be seen in table (a) that area 1
has a range of RSSI values ranging from -60 dBm to
-63 dBm so it can be concluded that the range of
values in area 1 is between -60 dBm to -67 dBm. For
area 2, it can be seen in table (b) that area 2 has a
range of RSSI values ranging from -68 dBm to -71
dBm so that the RSSI value range in area 2 can be
defined for a range of values from -68 dBm to -71
dBm. area 3 can be seen in table (c) that area 3 has a
range of RSSI values ranging from -72 to -73 dBm.
3.3 Object Area Detection Test
In this test used 1 object with 3 different areas where
this test is intended to measure the accuracy of the
system that has been made, this test is also carried out
using a reader height of 150 cm from the floor and the
actual position of the object in each area, namely in
area 1 the object distance to the reader is 1 meter,
while for the area the distance from the reader to the
object is 1.9 meters, and the last for area 3 the distance
from the object to the reader is 2.6 meters. The results
can be seen in table 2.
‐76
‐74
‐72
‐70
‐68
‐66
RSSIvsFilteredRSSI
RSSI FilteredRSSI
Plaboratory Asset Localization System through RFID Sensor Using Kalman Filter Algorithm
35
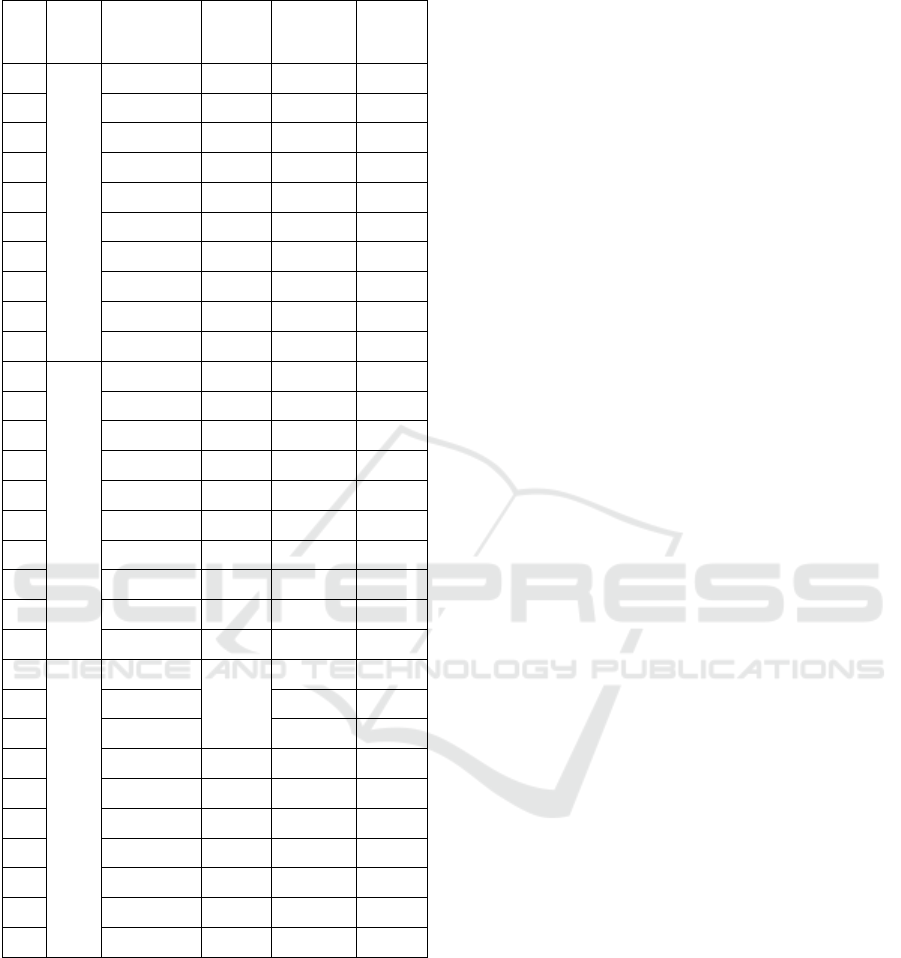
Table 2: Object Area Detection Test Results.
No
Actual
Distan
ce
(
m
)
Actual Area
Predicted
Distance
(
m
)
Predicted
Area
Status
1
1
Area 1 1.18 Area 1 O
K
2 Area 1 1.18 Area 1 O
K
3 Area 1 1.09 Area 1 O
K
4 Area 1 1 Area 1 O
K
5 Area 1 1 Area 1 O
K
6 Area 1 1 Area 1 O
K
7 Area 1 0.92 Area 1 O
K
8 Area 1 1.09 Area 1 O
K
9 Area 1 1.18 Area 1 O
K
10 Area 1 1.18 Area 1 O
K
11
1.9
Area 2 2.1 Area 2 O
K
12 Area 2 1.93 Area 2 O
K
13 Area 2 2.47 Area 3 Not O
K
14 Area 2 2.47 Area 3 Not O
K
15 Area 2 2.28 Area 2 O
K
16 Area 2 1.93 Area 2 O
K
17 Area 2 1.93 Area 2 O
K
18 Area 2 1.93 Area 2 O
K
19 Area 2 2.1 Area 2 O
K
20 Area 2 2.1 Area 2 O
K
21
2.6
Area 3 2.68 Area 3 O
K
22 Area 3 2.68 Area 3 O
K
23 Area 3 2.68 Area 3 O
K
24 Area 3 2.47 Area 3 O
K
25 Area 3 2.47 Area 3 O
K
26 Area 3 2.28 Area 2 Not O
K
27 Area 3 2.28 Area 2 Not O
K
28 Area 3 2.47 Area 3 O
K
29 Area 3 2.47 Area 3 O
K
30 Area 3 2.47 Area 3 O
K
From the results of the object area detection test,
it is found that the system can detect well in area 1,
but in area 2 and area 3 the system still has errors in
detecting object areas. From the test, it was found that
the error in the prediction system for calculating the
distance in area 1 was 8.2%, while in area 2 it was
11.7% and in area 3 was 4.03%, while the error in
detecting the area where objects were detected was
13.3%. This error is caused because the object
detection RSSI value system has errors in several
locations, it is possible that this error is due to the
unstable RSSI value obtained by the reader.
4 CONCLUSION
From the results of testing and analysis that have been
discussed in the previous chapter. It can be concluded
that the object area detection system has been
successfully created and has an error rate of 13.3%,
with the condition of the height of the reader and
objects not changing, as well as detecting objects
against RFID there is no obstacle. The use of
Filtration in this system can help stabilize the RSSI
value so that it does not fluctuate too much when
detecting objects. This can help in classifying the
detected object area. The UI created on this system is
able to compile and display the results of detecting
assets that have been registered.
REFERENCE
Aminah, S., Bhaskoro, S. B., & Sunarya, A. S. (2020).
Penerapan Quick Response Code pada Sistem
Digitalisasi Inventaris Laboratorium Berbasis Android.
JTERA (Jurnal Teknologi Rekayasa), 5(2), 207.
https://doi.org/10.31544/jtera.v5.i2.2020.207-214
Bulten, W., van Rossum, A. C., & Haselager, W. F. G.
(2016). Human SLAM, indoor localisation of devices
and users. Proceedings - 2016 IEEE 1st International
Conference on Internet-of-Things Design and
Implementation, IoTDI 2016, 211–222.
https://doi.org/10.1109/IoTDI.2015.19
Fali Oklilas, A., & Rozi, F. (2016). Pelacakan Posisi Tag
RFID Menggunakan Algoritma Genetika (Vol. 2, Issue
1). http://ars.ilkom.unsri.ac.id
Firaldi, Y., Sallu, S., & Kurniawan, H. (2017). ANALISA
POLA KEHADIRAN MAHASISWA DALAM
PERKULIAHAN DENGAN TEKNOLOGI RFID (Radio
Frequency Identification) STUDI KASUS : JURUSAN
TEKNIK INFORMATIKA UMRAH.
Ma’arif, A., Dwi Puriyanto, R., Fadlur, D., Hasan, T., &
Dahlan, A. (2020). Robot Keseimbangan Dengan
Kendali Proporsional-Integral-Derivatif (PID) dan
Kalman Filter. Journal Research and Development
(ITJRD), 4(2), 117–127.
https://doi.org/10.25299/itjrd.2018.vol4(2).3900
Ma’arif, A., Iswanto, I., Nuryono, A. A., & Alfian, R. I.
(2019). Kalman Filter for Noise Reducer on Sensor
Readings. Signal and Image Processing Letters, 1(2),
11–22. https://doi.org/10.31763/simple.v1i2.2
Nur Rahmawati, A., Bagas Bhaskoro, S., Aminah, S., &
Rekayasa Otomasi -Politeknik Manufaktur Bandung, T.
(2020). Sistem Pelacakan Posisi Aset Laboratorium
melalui Sensor Tanpa Kontak Fisik menggunakan
metode K-Nearest Neighbor. In Jurnal Sistem Cerdas.
iCAST-ES 2022 - International Conference on Applied Science and Technology on Engineering Science
36
