
Forecast Model of Stock Market Trend Based on International
Market and GRU-Attention
Chenyu Sun*
Capital Normal University (Beijing), Beijing, China
Keywords: International Market, GRU, Attention, Seq2Seq, Stock Prediction.
Abstract: Linkage effect of the international market is one of the most common phenomena of the stock market. In
order to better study the stock market prediction, this paper proposes a stock market index prediction model
based on the international major stock markets and GRU-attention. The international market is evaluated
through rolling correlation, and the correlation coefficients are ranked on market data, index data, capital flow
and international indexes to form multi-dimensional features. Using the Seq2Seq framework, the Attention
mechanism is added to the GRU model to prevent the model from ignoring the key feature information of
important time nodes. This article conducts experiments on the Shanghai Stock Exchange Index, and uses six
indicators: Mean Absolute Error (MAE), Root Mean Square Error (RMSE), Coefficient of Determination(R
2
)
Directional Symmetry (DS), Correct Up-trend (CU) and Run-time After evaluation, compared with the model
in this paper, the accuracy of the model in predicting the upward trend is effectively improved, and the
calculation overhead is reduced at the same time.
1 INTRODUCTION
Driven by the wave of the world economy, China's
financial market has ushered in unprecedented
development opportunities, and has gradually
occupied an important position in the international
financial market. With the gradual stabilization of
China’s financial market, in the face of increasingly
complex financial stock data, comparing artificial
intelligence and stock market analysis methods,
because traditional qualitative analysis relies too much
on the ideas and behaviors of investors, it is gradually
unable to Satisfy its needs for obtaining high returns
and avoiding risks. How to predict the future trend of
the stock market, better judge the stock trend, and
reduce investment risks to obtain high returns have
become issues that many researchers pay close
attention to.
The research on the stock market has always been
a key issue in the research of China's financial market.
China's stock market is affected by many factors.
Since the emergence of the stock market, relevant
scholars at home and abroad have conducted a lot of
research on the stock market forecast. From an
economic perspective, researchers mainly conduct
research on the stock market through fundamentals
and technology. However, because traditional
measurement models are becoming more and more
difficult to carry out a reasonable description, and
cannot effectively reflect the correlation between the
various dimensions of the stock market, this puts
forward higher requirements for the researchers of the
stock market. With the gradual development of
artificial intelligence technology, traditional financial
analysis methods such as MACD (Kang, 2021),
candlestick chart (Siriporn, 2019) have gradually been
replaced by neural networks (Alfonso, 2020) and deep
learning (M. Nabipour, 2020). Predicting the future
trend of the stock market through the stock market and
historical data associated with the stock market is the
main research direction of the stock market in the
computer field. Karolyi and Stulz (Karolyi, 1996) and
Forbes and Rigobon (Fortes, 2002) studied the stock
market volatility responses of major East Asian
countries under the background of the financial crisis.
Studies have shown that during the financial crisis,
countries closely related to capital and trade have a
certain degree of contagion in the financial market. In
other words, when a financial crisis occurs, the
macroeconomic environment of the risk-receiving
country is Stable, there is no attack by speculative
capital, a sharp decline in one market will also affect
the sharp decline in another market. Ajab (Ajab, 2019)
72
Sun, C.
Forecast Model of Stock Market Trend Based on International Market and GRU-Attention.
DOI: 10.5220/0011730500003607
In Proceedings of the 1st International Conference on Public Management, Digital Economy and Internet Technology (ICPDI 2022), pages 72-79
ISBN: 978-989-758-620-0
Copyright
c
2023 by SCITEPRESS – Science and Technology Publications, Lda. Under CC license (CC BY-NC-ND 4.0)

used a multivariate GARCH model to conduct a
linkage study on the stock markets of the United
States, China, the United Kingdom and other countries
and the Gulf Cooperation Council countries. The
study found that the internal stock markets of the Gulf
Cooperation Council countries have significant
positive correlations and are affected by Sino-US
stock markets. The spillover effect of volatility in
other countries is obvious.
For the translation alignment problem, Liang et al.
(Liang, 2020) proposed an attention mechanism based
on the seq2seq model, which independently calculates
the attention score between the encoding state and the
decoding state, and can obtain the one-to-one
relationship between the encoding state and the
decoding state. relationship. The experimental results
show that the attention distribution of this model is
wider than other models, and it can cover more
original information. Shen et al. (Shen, 2018) used the
gate-controlled recurrent unit (GRU) neural network
model to predict stock indexes such as Hang Seng.
The experimental results show that compared with the
traditional neural network model and support vector
machine method, the prediction accuracy of the GRU
model is higher.
2 THEORIES AND MODELS
2.1 Rolling Correlation Coefficient
The rolling correlation coefficient can evaluate the
correlation between time series features of different
dimensions, thereby reflecting the degree of linear
correlation between different time series. The
calculation formula is as follows:
[
]
()
cov , [ ]
()
var( [ ] var( ( )
tk
ty kx y
x
ty kx y
δ
+
=
⋅+
(1)
Among them, t represents the reference variable, y
represents the time, and x is the number of advance
and lag periods of k. A positive value of x indicates
that k is advanced, and a negative value of x indicates
k lag. The value of x can be judged and selected
according to the maximum value of the correlation
coefficient.
2.2 Gated Recurrent Unit Model
The Gated Recurrent Unit (GRU) model consists of
two gates, the update gate (z
t
) and the reset gate (r
t
).
The model can capture the long-term association
relationship in the time series, and can effectively
address the problem of gradient disappearance. Its
input is determined by the output of the hidden layer
at the previous moment and the current input, and the
output information is the hidden layer at the next
moment. information. The reset gate can be used to
calculate the output of candidate hidden layers. Its
purpose is to control how many hidden layers from the
previous moment are retained by the model. Updates
can be used to control the output information of how
many candidate hidden layers are added to obtain the
output of the current hidden layer. The update gate can
be considered as a combination of input gate and
forget gate in LSTM neural network. The calculation
formula is as follows:
()
1txzthztz
zWxWhb
α
−
=++
(2)
Among them, ht-1 represents the state information
at the previous moment, and the calculated value of z
t
will be between zero and one. When the value of z
t
approaches 0, it means that the current state is relative
to the previous one. The less information retained at a
moment, the more it approaches one.
The function of the reset gate r
t
is to determine how
much output information from the previous moment
needs to be retained, and the calculated value is
between zero and one. After that, tanh will generate an
alternate state, as shown below:
()
1txrthrtr
rWxWhb
α
−
=++
(3)
()
~
1
tanh ( * )
t
tttr
hWxUrhb
−
=+ +
(4)
Therefore, the hidden state h
t
at time t can be
expressed.
ℎ
=
1 −𝑧
*ℎ
+ 𝑧
*ℎ
~
(5)
2.3 Seq2Seq-Attention Model
The main application problem of the Seq2Seq model
is the study from sequence to sequence. It first
appeared in the field of machine translation and has
achieved great results in this field. This model belongs
to an Encoder–Decoder network structure, in which
the role of the Encoder framework is to convert a
variable-length sequence into a fixed-length vector for
expression, and the function of the Decoder is to
convert this fixed-length sequence The vector is
converted into a variable-length target sequence.
The Seq2Seq model is mainly built based on a
cyclic neural network, which is composed of Encoder,
Decoder and semantic vector C, where the output of
Decoder can be expressed as formula (6) and formula
(7).
11
(,,)
ttt
s
fy s C
−−
=
(6)
1
(,,)
ttt
y
gy sC
−
=
(7)
Forecast Model of Stock Market Trend Based on International Market and GRU-Attention
73

Attention
Input
Output
GRU GRU GRU GRU
GRU GRU GRU GRU
Encoder Decoder
Figure 1: Seq2Seq-Attention Structure chart.
Start
Get stock market and stock market related data
Market data Index data
International
index
Money
flows
Rolling average
international index
Rolling average
of money flows
Rolling correlation Rolling correlation
Ranking of correlation
coefficients
Encoder
GRU
Attention
layer
Stock market
forecast results
End
Decoder
GRU
Figure 2: Combine the international market and GRU-Attention flow chart.
However, it can be seen from the above two
formulas that Seq2Seq still has problems when the
input sequence is too long, and the weight of effective
information will be reduced in this calculation.
Therefore, it is necessary to introduce the Attention
mechanism to solve this problem. The Seq2Seq
framework structure diagram combined with the
Attention mechanism is shown in Figure 1.
Which is an expression of attention mechanism.
1
x
T
qqpq
q
cah
=
=
(8)
The above formula is a weighted average of the
hidden state of the Encoder layer.
A score is calculated by adding the hidden state of
the Decoder and the hidden state of the Encoder. The
score is mainly used to calculate the weight of the
hidden state of the Encoder.
1
*tanh( * * )
ij t t
eV WhUs b
−
=++
(9)
At the same time, the weight corresponding to each
Encoder's hidden state is calculated.
1
exp( )
exp( )
x
qp
qp
T
ql
l
e
a
e
=
=
(10)
Calculated by the above formula, the GRU-
Attention model can predict the future by inputting
time series. Due to the correlation between the
Chinese stock market and the international market, a
stock market trend prediction model combining the
international market and GRU-Attention is proposed
to predict the future of the stock market. Trend
forecasts.
3 MODEL BUILDING COMBINED
WITH THE INTERNATIONAL
MARKET AND GRU-Attention
3.1 Combine the International Market
and GRU-Attention Model
Framework
The flow chart of the model combining the
international market and GRU-Attention proposed in
this paper is shown in Figure 2. The specific
construction process of the model is as follows:
(1) Data acquisition: Obtain data related to the
Shanghai Stock Exchange Index in the financial
market and international stock market data through the
Tushare financial data platform. Due to the imbalance
of holidays in the international stock market, there
may be problems with certain national data during
some holidays, so it is necessary Fill in the missing
values. Since each country index should maintain the
data value of the previous trading day during the
market break, it is necessary to fill in the missing
values downward.
(2) Data selection: Carry out rolling correlation
analysis on the processed data, obtain the rolling
correlation between the index closing price and return
ICPDI 2022 - International Conference on Public Management, Digital Economy and Internet Technology
74

rate of the international stock market relative to the
Shanghai stock index, and sort the market data,
indicator data, and rolling by the correlation
coefficient. The average international index and the
rolling average capital flow are evaluated.
(3) Data prediction: Sort the index data by
correlation coefficients, obtain the dimensional
features with a higher degree of correlation, and put
the multi-dimensional features into the GRU-
Attention model to predict the future stock market
trend, and through many experiments Compare the
real value with the predicted value to adjust the model
parameters to reduce the prediction error.
3.2 Evaluation Index
In order to combine the international market and the
training model in the GRU-Attention model to
evaluate the fit and analyze the degree of error. The
model data is evaluated through MAE, RMSE, and R
side. The calculation formulas for MAE, RMSE and
R
2
are as follows:
(1) MAE represents the average value of absolute
error, which can reflect the error between the predicted
value and the true value.
,,
1
1
n
pre i true i
i
MAE x x
n
=
=
|
−
|
(11)
(2) The deviation between the observed value and
the true value measured by RMSE.
2
,,
1
1
()
n
pre i true i
i
RMSE x x
n
=
=−
(12)
(3) R
2
is a reaction model of the goodness of fit,
fitting effect as the representative value closer to 1
more excellent.
2
,,
2
1
2
,,
1
()
1
()
n
pre i true i
i
n
mean i true i
i
xx
R
xx
=
=
−
=−
−
(13)
In order to better evaluate the future forecast data,
the real value and predicted value are analyzed
through MAE, RMSE, DS and DU. The larger the
value of DS and CU, the closer the stock market trend
predicted by the model is to the real stock market
trend.
(1) DS represents the probability that the predicted
future stock market trend will be the same as the actual
trend.
()
()
,,1,,1
1
1 0
100
,
0 Other
N
pre i pre i true i true i
kk
i
xx xx
DS
n
−−
=
−−≥
=∂∂
(14)
(2) CU represents the probability of the correct
upward forecast trend in the predicted future stock
market trend.
()
()
()
,,1, ,1 ,,1
1
1
1 0 0
100
,
0 ther
N
prei prei truei truei prei prei
kk
i
xx xx xx
CU
n
−− −
=
−−≥−>
=∂∂
且
O
(15)
4 THE EXAMPLE ANALYSIS
4.1 Data Acquisition
In this paper, the Shanghai Composite Index is
selected as the reference object of the prediction
model. By calling the Tushare big data platform, the
market data, index data, international index data and
capital flow in the Shanghai Composite Index from
January 5, 2015 to 2020-12-31, a total of 37
dimensional data features, including 1464 pieces of
data. As part of the data may be empty when
calculating rolling correlation and return rate, we
choose 2016-1-4 as the starting point. The data from
2016-1-4 to 2020-6-30 was used as the training set to
train the model, and the data from 2020-6-30 to 2020-
12-31 was used as the test set to test the prediction
effect.
4.2 Data Selection
The rate of return data of the above international
Table 1: Rolling correlation feature.
Index Day Index Day
North bound 6 HIS 72
HIS_yield 20 Nikkei 225 120
Nikkei 225_yield 61 S&P 500 94
SH-HK Stock Connect 6 FCHI 120
KOSPI_yield 67 IXIC 91
Euro stoxx 50 120 DJIA 68
GSPTSE, FTSE 100 62 KOSPI 120
Xetra DAX 120
Forecast Model of Stock Market Trend Based on International Market and GRU-Attention
75
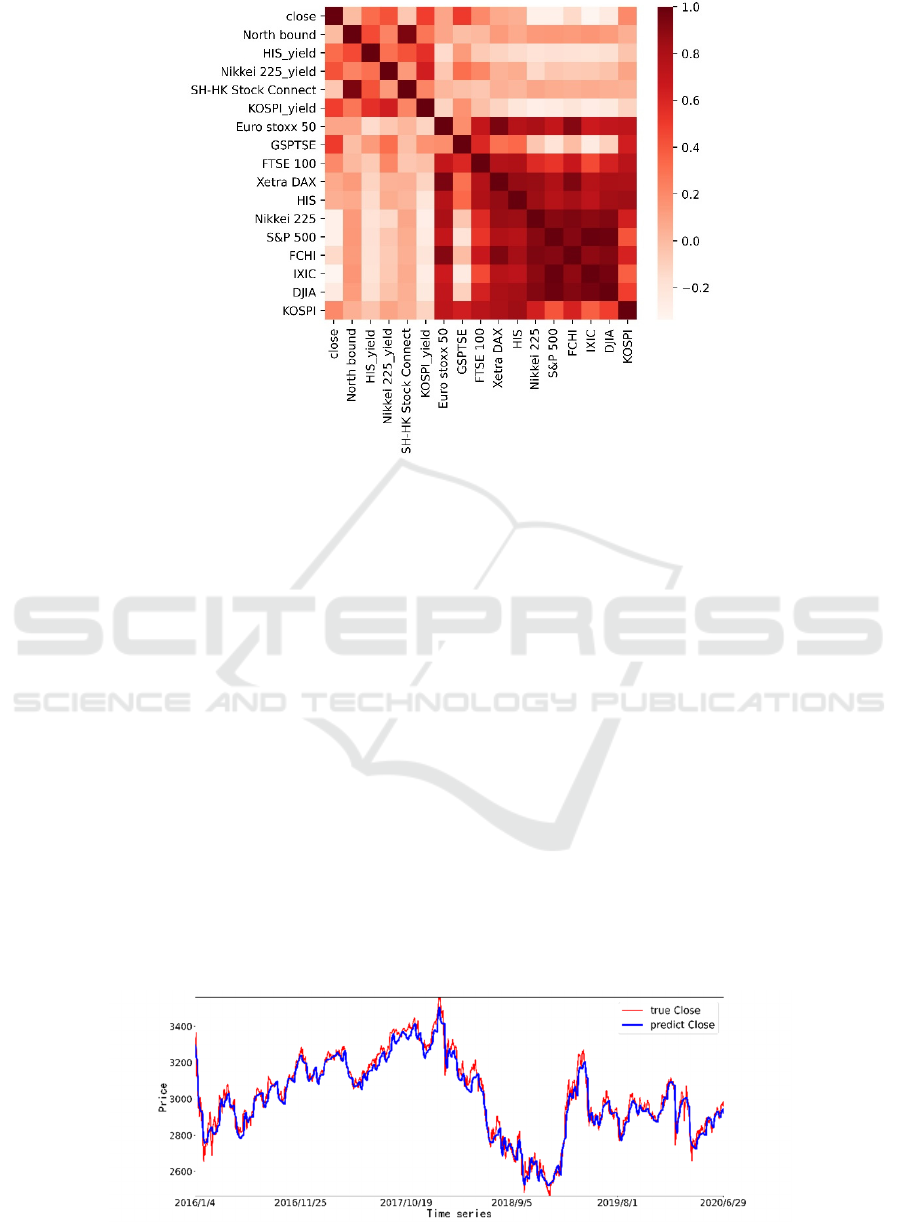
Figure 3: International index heat map.
indexes are calculated, and the rolling correlation
analysis of the international indexes, the rate of return
of the international indexes and the capital flow data
is carried out for 2-120 days. The weak correlation
features are excluded, and the characteristics in the
following table are selected and the average value of
the multi-day data is taken.
Heat maps are drawn for the above features
through correlation sorting, as shown in Fig. 3.
According to the heat map, it can be seen that only
GSPTSE, Kospi_yield and Nikkei 225_yield have a
high correlation with the Shanghai Composite Index.
Therefore, these three characteristics are selected as
the input characteristics of the international index.
4.3
Prediction of Data
Dimensional features with high correlation were
obtained through the selection of the above indicators,
and the multi-dimensional features were put into the
GRU-Attention prediction model. In order to ensure
the operation effect of the model, model parameters
need to be adjusted and grouping experiments are
conducted on the model.
Experiment 1: First, the number of stacked layers
of the model was set as 1 layer, the number of
iterations was set as 300, and the learning rate was set
as 0.0001. Because neurons will be lost randomly in
the process of training the model, however, this
operation will cause instability of the predicted results,
so the dropout layer is added to optimize the neural
network, and the dropout_rate is set as 0.3.
After the above parameters are determined, the
corresponding model is established to achieve relative
stability after 300 iterations. The prediction model is
generated to forecast the training data and test data
respectively. The experimental results of the training
data are shown in Fig. 4 and the experimental results
of the test data are shown in Fig. 5.
Figure 4: Prediction results of training data in Experiment 1.
ICPDI 2022 - International Conference on Public Management, Digital Economy and Internet Technology
76
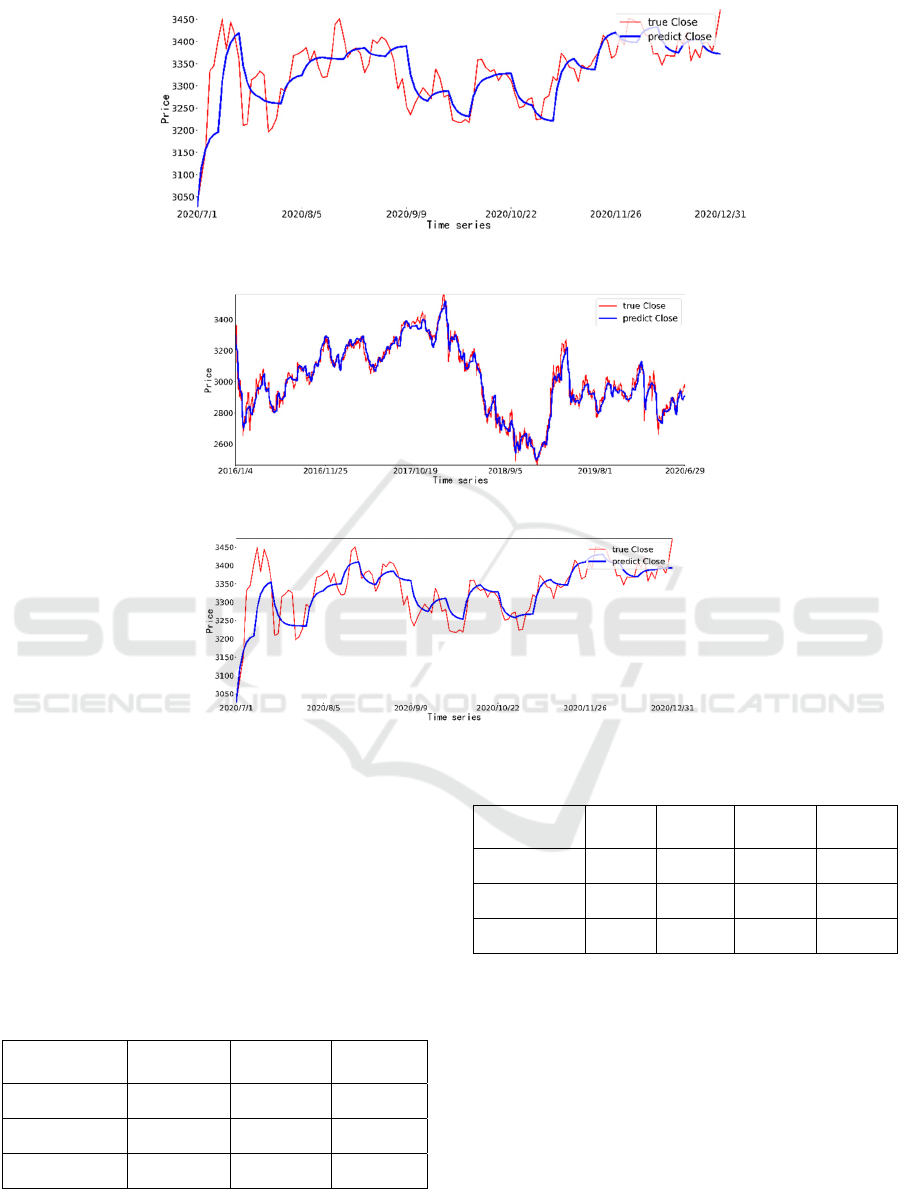
Figure 5 Prediction results of test data in Experiment 1.
Figure 6: Prediction results of training data in Experiment 2.
Figure 7: Prediction results of test data in Experiment 2.
Experiment 2: Change the number of stacked
layers of the model to 2, change the learning rate to
0.0005, and set the dropout_rate of the dropout layer
to 0.4. The experimental results of the training data are
shown in Fig. 6, and the experimental results of the
test data are shown in Fig. 7.
The comparative evaluation indexes of
Experiment 1 and Experiment 2 are shown in the
following table.
Table 2: Evaluation of experimental training data.
Evaluation
index
MAE RMSE R
2
1 34.14 45.03 0.96
2 30.64 40.98 0.97
Lift ratio 10.25% 8.99% 0.01%
Table 3: Evaluation of experimental test data.
Evaluation
index
MAE RMSE DS CU
1 35.70 50.73 43.65% 47.69%
2 32.26 46.21 55.56% 58.57%
Lift ratio 9.63% 8.91% 27.29% 22.81%
Can be seen from table 2 and table 3, results, the
contrast experiment on the indicators are improved,
especially on the test data of the DS and CU index,
27.29% and 22.81% respectively of ascension, it is
very important for the prediction problem of the stock
market is concerned, the most important thing for
investors is timing of buy and sell stocks, In
Experiment 2, the correct rate of trend prediction can
reach more than 50%. For investors, they can choose
a good time to make an effective judgment on the
stock market and thus avoid risks.
.
Forecast Model of Stock Market Trend Based on International Market and GRU-Attention
77
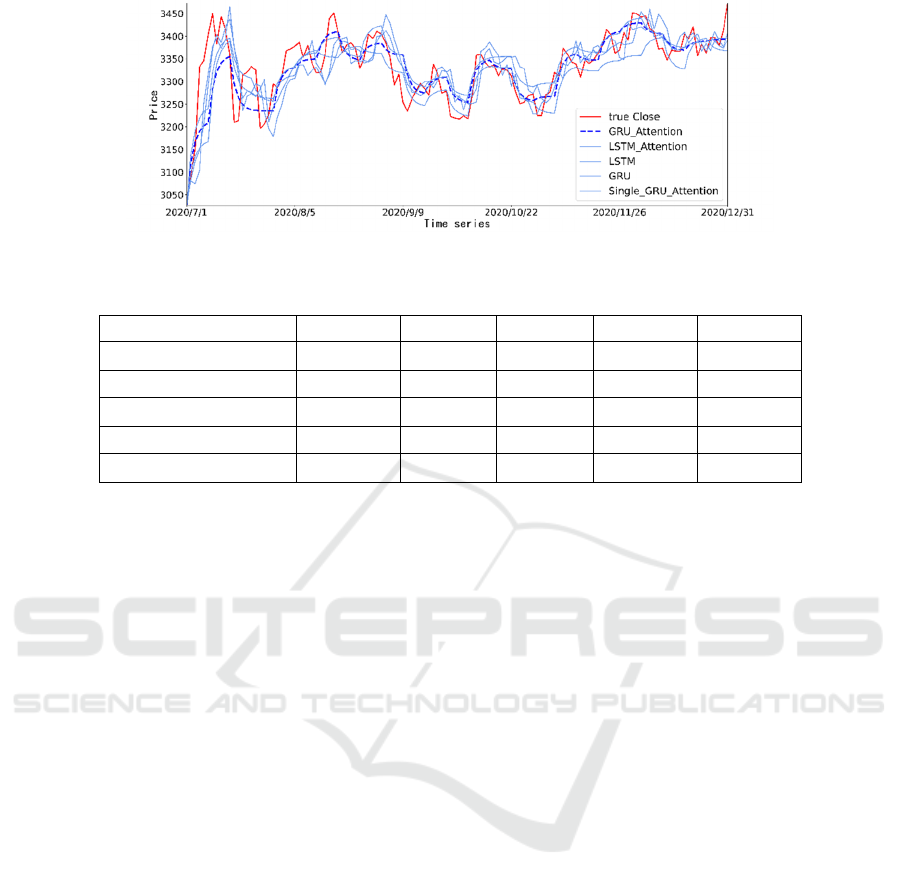
Figure 8: Comparison of model prediction results.
Table 4: Comparative analysis of model prediction results.
Evaluation index MAE RMSE DS CU Run-time
GRU-Attention 32.26 46.21 55.56% 58.56% 418.09
LSTM-Attention 33.77 44.74 54.76% 57.33% 476.68
LSTM 39.56 52.84 42.06% 46.48% 245.42
GRU 39.15 52.25 47.62% 51.39% 238.18
Single-GRU-Attention 39.00 54.48 46.03% 50.00% 410.97
4.4 Comparison of Model Prediction
Results
In order to verify the rationality of the prediction of
GRU-Attention model combined with international
market proposed in this paper, this paper selects four
other models for comparison. The selection of the
model is mainly based on the following three aspects:
1) Select a single LSTM and GRU neural network, and
use the learning ability of its own algorithm to predict
the data. 2) The LSTM-Attention model was selected
to compare the training time and error effect of the
model between LSTM and GRU neural network. 3)
The GRU-Attention model with a single feature was
selected to analyze the advantages of multi-
dimensional features Through the comparison of the
above models, the prediction trend of each prediction
model can be clearly seen from Fig. 8 and Table 5. By
comparing the performance of each model, it can be
seen that compared with the single LSTM and GRU
model, the prediction model with the Attention
mechanism has a significant increase in running time,
but the prediction error rate is significantly smaller
than that of the single model. Especially for DS and
Cu indexes, the model with Attention mechanism was
more accurate in predicting trends. Similarly,
compared with the single-dimensional GRU-
Attention model, although GRU-Attention model has
no advantage in running time, it is better than the
single-dimensional model in predicting error rate and
accuracy of trend. Compared with the LSTM-
Attention model, there was no significant difference in
the prediction effect, but in terms of running time, the
GRU-Attention model was significantly more
efficient.
5 CONCLUSION
This paper proposes a stock market trend prediction
model based on the international market and GRU-
Attention. The above index data are used as
experimental samples, and MAE, RMSE, and R
2
are
used as evaluation indicators for training data, and
MAE, RMSE, DS, and CU are used as evaluation
indicators for test data. Through GRU-Attention to
predict the relevant data of the international market
and the Shanghai Stock Exchange, it is verified that
this model has a lower error rate and a higher
operating efficiency than other forecasting models.
There is still room for improvement in its overall
forecasting ability. Later, it will consider introducing
public opinion data and domestic and foreign news as
input data, increasing its input dimension, and
considering adding a two-way neural network to a data
set with richer text information to reduce errors.
Improve the accuracy of trend forecasting.
REFERENCES
Alfonso G, Ramirez D R. Neural Networks in Narrow
Stock Markets[J]. Symmetry, 2020, 12(8):1272.
ICPDI 2022 - International Conference on Public Management, Digital Economy and Internet Technology
78

Ajab A. Alfreedi. Shocks and Volatility Spillover Between
Stock Markets of Developed Countries and GCC Stock
Markets [J]. Journal of Taibah University for Science,
2019, 13(1): 1-9.
Fortes K, Rigobon R. No Contagion, Only
Interdependence: Measuring Stock Market
Comovements [J]. The Journal of Finance, 2002, 57(5):
2223-2261.
Karolyi A, Stulz M.Why do markets move together? An
investigation of US-Japan stock return co-movements
[J]. Journal of Finance, 1996, 51(3): 951-986.
Kang ByungKook. Improving MACD Technical Analysis
by Optimizing Parameters and Modifying Trading
Rules: Evidence from the Japanese Nikkei 225 Futures
Market [J]. Journal of Risk and Financial Management,
2021, 14(1).
Liang Z, Du J, Li C. Abstractive social media text
summarization using selective reinforced Seq2Seq
attention model[J]. Neurocomputing, 2020, 410:432-
440.
M. Nabipour, P. Nayyeri, H. Jabani, et al. Deep Learning
for Stock Market Prediction [J]. Entropy, 2020, 22(8).
Siriporn Thammakesorn, Ohm Sornil. Generating Trading
Strategies Based on Candlestick Chart Pattern
Characteristics[J]. Journal of Physics: Conference
Series, 2019, 1195(1).
Shen G, Tan Q, Zhang H, et al. Deep Learning with Gated
Recurrent Unit Networks for Financial Sequence
Predictions [J]. Procedia Computer Science, 2018,
131:895-903.
Forecast Model of Stock Market Trend Based on International Market and GRU-Attention
79
