
Analysis of the Relationship Between Service Quality and Customer
Satisfaction in the Stevedoring Process at Hatta Makassar (TPM) and
Bitung (TPB) Container Terminal
Syanne Pangemanan
1
, Sumarni H. Aly
1
and Muralia Hustim
2
1
Doctoral Program Student, Department of Civil Engineering, Hasanuddin University, Indonesia
2
Department of Civil/Environmental Engineering, Hasanuddin University, Indonesia
Keywords: Stevedoring, Container Terminal, Customer Satisfaction, Service Quality.
Abstract: This research is based on the phenomenon of several indicator of service quality and level of customer
satisfaction in the stevedoring process at the Hatta Makassar (TPM) and Bitung (TPB) Container Terminal
which is still below the standard of port operational service performance. This research aims to determine (1)
the level of customer satisfaction with service quality in the stevedoring process at the Hatta Makassar (TPM)
and Bitung (TPB) Container Terminal, and (2) service quality indicators that are a priority to be improved in
the stevedoring process at the Hatta Makassar (TPM) and Bitung (TPB) Container Terminal. The research
was carried out at the Hatta Makassar Container Terminal and Bitung Container Terminal. The methodology
used in this research was descriptive research methods. The results showed (1) customer satisfaction in the
stevedirng process at the Hatta Makassar (TPM) and Bitung (TPB) Container Terminal as a whole has been
fulfilled with the quality of this service with a percentage of customer satisfaction level of 73.74%, and (2)
Service indicators which according to service users are a priority for Hatta Makassar (TPM) and Bitung (TPB)
Container Terminal to be improved, namely: container loading and unloading operator services, availability
of loading and unloading facilities, dwelling time, transparent and compliant service fees, certainty of service
hours, and illegal levies.
1 INTRODUCTION
Sea transportation is the backbone of world trade and
encourages globalization, in line with the rapid
development of the world economy which has
brought the use of containers. The port is a node in
the transportation network, as a gateway for
economic activity, a place for transportation mode
switching activities, supporting industrial trading
activities, and a place for distribution, production and
consolidation of cargo or goods. To serve various
types of ships and all activities related to shipping and
receiving goods through containers, a container
terminal is needed. Construction and development of
container terminals in the context of container
services is a necessity and a demand for various ports
in the world (Simbolon and Achmadi, 2012).
PT. Pelabuhan Indonesia IV is a State-Owned
Enterprise engaged in port services that provides port
facilities and infrastructure in order to support the
smooth flow of ships, passenger transportation,
delivery of goods, and become one of the port centers
in Eastern Indonesia which oversees several port
branches and based in Makassar. Mission of PT.
Pelabuhan Indonesia IV is to implement government
program policies in the field of economy and
development through port services, as well as to gain
profits for companies by conducting port service
businesses and other businesses that support the
quality of port services, for example docks and other
facilities for mooring, loading and unloading of
goods, passenger
transportation, loading and
unloading equipment, as well as other services related
to ship piloting and ship delaying. Hatta
Makassar
Container Terminal and Bitung Container
Terminal
are services in the port sector under PT. Indonesian
Port IV, which functions to serve container loading
and unloading activities, container stacking,
container receiving or delivery, and other supporting
activities.
Hatta Makassar Container Terminal and Bitung
Container Terminal are one of the business segments
of PT. Pelabuhan Indonesia IV (Persero) which is
Pangemanan, S., Aly, S. and Hustim, M.
Analysis of the Relationship Between Service Quality and Customer Satisfaction in the Stevedoring Process at Hatta Makassar (TPM) and Bitung (TPB) Container Terminal.
DOI: 10.5220/0011904600003575
In Proceedings of the 5th International Conference on Applied Science and Technology on Engineering Science (iCAST-ES 2022), pages 863-869
ISBN: 978-989-758-619-4; ISSN: 2975-8246
Copyright © 2023 by SCITEPRESS – Science and Technology Publications, Lda. Under CC license (CC BY-NC-ND 4.0)
863

engaged in loading and unloading containers from
and to ships. The services provided are oriented to
cost efficiency and time effectiveness as well as
customer satisfaction, the improvement efforts are
supported by the availability of modern facilities and
equipment as well as implementing an international
standard service system (ISO 9002: 1994 Certificate).
In this research what is meant by stevedoring is an
activity to unload goods from the ship to the dock, or
vice versa loading from the dock to the ship. Freight
port and the factors that influence the level of
satisfaction of the freight port service, including
waiting time and loading and unloading costs.
Satisfaction targeted in this study relates to
satisfaction with the service of imports and exports of
goods. This research purpose is to analyze the
relationship between service quality and the level of
customer satisfaction in the stevedoring process at the
container terminal, namely when unloading goods
from ship to dock, and loading goods from dock to
ship.
2 LITERATURE REVIEW
2.1 Container Terminal
According to Government Regulation No. 69 Tahun
2001 Pasal 1 ayat 1, concerning Ports, a port is a place
consisting of land and surrounding waters with
certain boundaries as a place for government
activities and economic activities that are used as a
place for ships to dock, dock, up and down.
passengers and/or loading and unloading of goods
equipped with shipping safety facilities and port
support activities as well as a place for intra and
intermodal transportation. According to Triatmodjo
(1996), ports can be divided into several aspects of
review, namely in terms of their operation, in terms
of their operation, functions in national and
international trade, in terms of their use and
geographical location. Where the port of goods must
have a dock equipped with facilities for loading and
unloading of goods.
The container terminal is a port supporting facility
that is engaged in loading and unloading of goods.
Transport using containers allows goods to be
combined into one in a container so that loading and
unloading activities can be mechanized. This can
increase the amount of cargo that can be handled so
that loading and unloading times are faster. The
container terminal is one of the transportation
infrastructure that serves the loading and unloading of
goods using ship transportation. Inside the container
terminal is supported by several facilities that are
prepared to serve its customers. The components
which are also the facilities of a container terminal in
supporting the smooth handling of containers
including loading and unloading in a container
terminal are facilities and infrastructure. The facilities
consist of the Port Pier, Container Stacking Field,
Container Freight Service (CFS), Maintenance and
Repair Shop, Control Tower, Ship Planning Center,
and Weighting Bridge. Infrastructure consists of
Gantry Crane, Sraddle Carrier, Forklift, Sidelift, Roll
Trailer, and Head Truck or Chassis.
2.2 Loading and Unloading Containers
According to the Decree of the Minister of
Transportation of the Republic of Indonesia No. 33 of
2001 concerning the Organization and Operation of
Sea Transportation, loading and unloading activities
are activities of moving goods from sea transportation
to land transportation modes and vice versa, which
includes the following activities: (1) Stevedoring,
which is an activity of moving goods from the ship's
hold until the goods are released from the ship. slings
on the pier or vice versa, and (2) Receiving and
delivery; receiving is the activity of receiving goods
from service users to the temporary storage area
(CY), and delivery is the activity of withdrawing
goods or sending goods from the temporary storage
area (CY) to the service user's warehouse.
Meanwhile, the activities of unloading and loading
goods that do not go through the stacking place
(warehouse or stacking yard) are: Truck Losing and
Kade Losing.
2.3 The Concept of Customer
Satisfaction on Service Quality
Creating customer satisfaction can bring a number of
benefits, including seamless business-to-customer
relationships, creating a sound basis for repeat
purchases and customer loyalty, and forming word of
mouth recommendations that benefit the company's
business. Basically, the concept of customer
satisfaction includes the difference between
expectations and perceived performance or results.
2.4 Loading and Unloading Containers
Based on the Decree of the Minister of
Administrative Reform No. KEP/25/M.PAN/2/2004
concerning General Guidelines for Compiling the
Community Satisfaction Index, the service principle
is developed into 14 (fourteen) relevant, valid, and
iCAST-ES 2022 - International Conference on Applied Science and Technology on Engineering Science
864

reliable dimensions, as the basic elements that must
be fulfilled in measuring the satisfaction index are:
1. Service procedures, especially the ease of
service steps, provide convenience and clarity of
service flow to container port service users.
2. Service requirements, namely in particular the
technical and administrative requirements
needed to obtain container terminal services.
3. Clarity of Service Officers, namely the
existence and certainty of service providers.
4. Discipline of Service Officers, namely the
seriousness of officers when providing services,
especially to the consistency of working time.
5. Responsibilities of Service Officers, namely
clarity of authority and responsibility of officers
in managing service performance.
6. Ability of Service Officers, namely the
qualifications and skills of agents to provide or
complete services to container port service
users.
7. Speed of Service, namely the target service time
can be completed within the time specified by
the container terminal.
8. Fairness in Service Reception, namely the
implementation of services without
distinguishing the class or status of service users
served at the container terminal.
9. Politeness and Friendliness of Officers, in
particular the attitudes and behavior of officers
in providing services to users in a polite and
friendly manner as well as mutual respect and
appreciation.
10. Fairness of Service Charges, in particular the
accessibility of service users to the rates
determined by the container terminal.
11. Cost Certainty, which has determined the
adequacy between the fees paid by the service
user and the fees charged.
12. Service Guarantee, especially the
implementation of service time, in accordance
with the requirements set by the container
terminal.
13. Environmental Comfort, namely the condition
of clean, orderly and orderly service facilities
and infrastructure so as to provide a sense of
comfort to service recipients.
14. Service Security, namely ensuring the level of
environmental security of the facilities used, so
that service users feel comfortable in receiving
services against the risks posed by service
performance.
3 RESEARCH METHODS
3.1 Research Methods
This research is a quantitative and qualitative type
with surveys and direct field observations because it
has the final result, namely knowing how big the level
of customer satisfaction is with service performance.
The survey was carried out using a questionnaire as
the data collection instrument. The aim is to obtain
information about a number of respondents who are
considered representative of a particular population.
While the observation is that the researcher goes
directly to the field to record systematically, and can
control its reliability (reliability) and validity
(validity), with the support of secondary data. The
data is then analyzed to get a conclusion.
3.2 Location and Time Research
The research location which is the object of research
is the Port of Indonesia (PT. Pelindo) Region IV,
namely at the Hatta-Makassar Container Terminal in
South Sulawesi, and the Bitung Container Terminal
in North Sulawesi. The time of the study was carried
out for 4 months. Implementation of a preliminary
survey through interviews and observations. The
reason for choosing the location of Hatta Makassar
Container Terminal and Bitung Container Terminal is
because the two Container Terminals are the largest
in PT. Pelindo IV. Another reason is that the number
of service users and the flow of goods at the two
container terminals continues to increase.
3.3 Data Collection Techniques
Each paper must have an abstract. The abstract should
appear justified, with a linespace exactly of 11-point,
a hanging indent of 2-centimeters, spacing before of
12-point and after of 30-point, and font size of 9-
point. The sentence must end with a period.
3.4 Data Collection Techniques
The population in this study were all customers of the
Hatta Makassar Container Terminal and the active
Bitung Container Terminal, which totaled 54
companies/person. The sample is part of the number
and characteristics possessed by the population. The
sample which is part of the population in this study
from the results of calculations using the slovin
formula amounted to 35 used as respondents. The
sampling method used in this study is non-probability
sampling using accidental sampling technique. The
Analysis of the Relationship Between Service Quality and Customer Satisfaction in the Stevedoring Process at Hatta Makassar (TPM) and
Bitung (TPB) Container Terminal
865

reason researchers use this method is because it is
faster and because of the limited time of the study.
The research population that is being targeted in this
research is the users and management of the container
terminal authority.
3.5 Data Collection Stages
The data collection method used in this research is the
survey method. The survey method used is Interview,
Questionnaire and Literature Study. To collect
research data, a research instrument is used in the
form of a questionnaire consisting of questions about
service quality, customer satisfaction and the
correlation between service quality and customer
satisfaction which is composed of 14 dimensions and
36 indicators. Data was obtained by distributing
questionnaires to customers who use the services of
the Hatta Makassar Container Terminal and Bitung
Container Terminal.
3.6 Data Collection Stages
The initial research conducted was by literature study.
The method in this research is planned to use
qualitative and quantitative methods at the research
site. Qualitative methods are data that only classify,
for example the classification of container port
service levels based on service quality and customer
satisfaction, namely physical appearance - tangible,
reliability, responsiveness, assurance, and empathy.
So that the output can be presented in the form of a
percentage of each element. Quantitative method is
an objective description based on research results or
data in the form of numbers. In this case, the
importance of service and the quality of service
performance is ranked using 5 (five) points, namely:
Table 1: Rating and performance service quality.
No. Answer Weight
1 Very Important 5
2 Important 4
3 Quite Important 3
4 Less Important 2
5 Not Important 1
Meanwhile, the level of performance/customer
satisfaction aspect of container terminals is ranked
using a 5 (five) point scale, namely:
Table 2: Rating aspects of performance/customer
satisfaction.
No. Answer Weight
1Ver
y
Good / Ver
y
Satisfie
d
5
2 Good / Satisfie
d
4
3Fairl
y
Good / Fairl
y
Satisfie
d
3
4 Less Good / Less Satisfie
d
2
5 Not Good / Not Satisfie
d
1
In this research there are 2 (two) variables
represented by the letters X and Y, where X is the
level of performance of the container terminal
(quality of service) that provides customer
satisfaction and Y is the level of customer interest
(customer satisfaction).
3.7 Data Analysis Technique
3.7.1 Validity Test
Validity test is a test step that is carried out on the
contents of an instrument (questionnaire) to measure
the accuracy of the instrument used in research. So
that, the validity of an instrument is related to the
level of accuracy of the measuring instrument in
research. To find the value of validity, that is by
correlating the score of the instrument items with the
Pearson Product Moment formula as follows:
Figure 1: Formula to find the value of validity.
Where,
rxy = Correlation Coefficient / rcount
∑x = Total score of each item
∑y = Total score (all items)
N = Number of Respondents
In this research, the instrument validity was
calculated using Microsoft Excel with a significance
level of 0.05 (Pearson Product Moment Correlation).
The criteria for testing the validity of this research are
as follows:
1. If r
count
≥ r
table
, then the instrument or item in the
question has a significant correlation with the total
score, meaning that the question is declared valid.
2. If r
count
≤ r
table
, then the instrument or item in the
question is not significantly correlated with the
total score, meaning that the question is declared
invalid.
iCAST-ES 2022 - International Conference on Applied Science and Technology on Engineering Science
866

3.7.2 Importance Performance Analysis
(IPA)
The analysis carried out is the level of suitability of
importance and performance, different tests and
priority mapping is carried out with IPA. The data
that has been obtained from the questionnaire is
analyzed with Importance Performance Analysis
(IPA) to obtain the level of conformity between the
performance of container services and respondents'
expectations of container services. Provided that the
service satisfaction of Makassar and Bitung
Container Terminals was the level of compatibility
between the performance of the Hatta Makassar
Container Terminal and Bitung Container Terminal
on the level of interest/expectations of service users
or consumers. To get the level of conformity use the
following formula:
Figure 2: Formula to get the level of conformity.
Where:
Tki = Respondent Suitability Level
Xi = Performance Assessment Score
Yi = Interest rating score
After getting the level of conformity, then
calculate the average of all variables of importance
and performance which are the limits in the Cartesian
diagram. Where the elaboration of each variable is
carried out using the following formula:
Figure 3: Formula for elaboration of each variable.
Where,
𝑋
= Average score of performance level
𝑌
= Average score of importance level
N = Number of respondents
K = Number of variables that can affect service
user satisfaction
3.7.3 Customer Satisfaction Index (CSI)
Analysis
In the analysis of the Customer Satisfaction Index, the
average score for the level of performance and the
average score for the level of importance was used to
determine the level of overall service user satisfaction
with the services of Makassar Container Terminal and
Bitung Container Terminal. In this analysis, the
average score of the level of performance and
importance is multiplied to get the product value, then
all the products of the average score of the level of
performance and level of importance are added up
and then divided by the total score of the average level
of importance and yields the percentage level of
satisfaction overall for Makassar Container Terminal
and Bitung Container Terminal services.
4 RESULTS AND DISCUSSION
4.1 Validity Test
After getting the rcount value, then comparing the
rcount obtained with the rtable with a significance
level of 5%. If rcount > rtable it means valid,
otherwise if rcount < rtable it means invalid. Where
the rtable used in this study for 35 respondents is
0,404. In processing this validity data, using the
validity test calculation formula, namely:
𝑟
=
∑(∑)(∑)
∑
(∑)
∑
(∑)
(1)
X = Score obtained by the subject of all items
Y = Total score obtained from all items
N = 35
∑𝑋 = Total item score
∑𝑌 = Total score of items
Then the validity test for all questions based on the
results of the validity test above with all the
statements in the research questionnaire declared
valid.
4.2 Performance Level and Interest
Level Analysis
Based on the data obtained from the results of a
survey of 35 respondents using Makassar Container
Terminal and Bitung Container Terminal, it is
possible to analyze the Level of Conformity between
Performance Levels and Interest Levels for each
service dimension at Makassar Container Terminal
and Bitung Container Terminal. Based on the survey
results, from the overall service indicators, an average
level of conformity was obtained with a percentage of
82.3% from 36 service indicators at Makassar
Container Terminal and Bitung Container Terminal.
Where the level of conformity obtained is still in very
good criteria.
Analysis of the Relationship Between Service Quality and Customer Satisfaction in the Stevedoring Process at Hatta Makassar (TPM) and
Bitung (TPB) Container Terminal
867
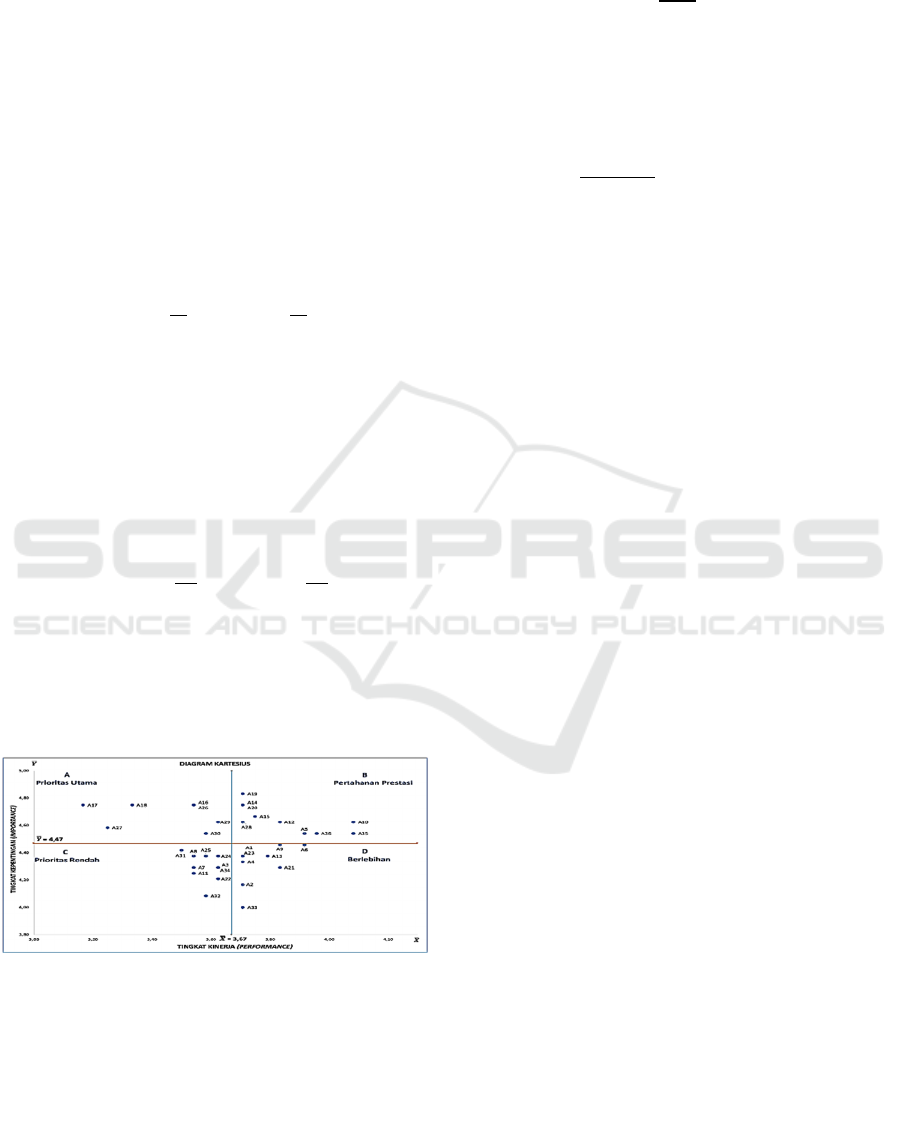
4.3 Performance Level and Interest
Level Analysis
In the Cartesian diagram, the average Performance
Level 𝑋
becomes the ordinate in the Cartesian
diagram and the average Importance Level 𝑌
becomes the ordinate in the Cartesian diagram. And
the total average of all attributes for each
Performance Level 𝑋
and Importance Level 𝑌
will be
the limit that describes the quadrant position in the
Cartesian diagram.
The performance level score and the importance
level score of each indicator as well as the average
value of each indicator can be calculated by the
formula below, to get the 𝑋
and 𝑌
values, namely:
𝑋
=
𝑑𝑎𝑛 𝑌
=
(2)
Where,
𝑋
= Average Performance Level Score
𝑌
= Average Interest Level Score
Xi = Performance Level Score
Yi = Importance Score
N = Number of Respondents = 35 Respondents
The following is the calculation of the values of 𝑋
and 𝑌
:
𝑋
=
∑
𝑎𝑛𝑑 𝑌
=
∑
(3)
Where,
∑𝑋
= 131,08 (Total sum of 𝑋
)
∑𝑌
= 159,91 (Total sum of 𝑌
)
K = 36 (Number of Service Indicators)
So the value of 𝑋
= 3,63 and 𝑌
= 4,42.
Figure 4: Cartesian diagram of Makassar and Bitung
container terminal services.
4.4 Service User Satisfaction Level
To determine the overall level of satisfaction at
Makassar Container Terminal and Bitung Container
Terminal, the Customer Satisfaction Index (CSI)
method was used. The calculation of the Customer
Satisfaction Index uses the formula:
𝐶𝑆𝐼 =
𝑥 100% (4)
Where,
T = Total Score from Multiplication of Interest
Level Score x Performance Level = 589,62
Y = Total Interest Level Score = 159,91
CSI = Percentage of Satisfaction Level
𝐶𝑆𝐼 =
,
,
𝑥 100% = 73,74% (5)
From the results of the above calculations, it is
known that the results of the calculation of the level
of customer satisfaction obtained from all service
indicators at the Makassar and Bitung Container
Terminals are 73.74%. These results are included in
the satisfied CSI criteria.
5 CONCLUSIONS
1. Makassar Container Terminal service users as a
whole are satisfied with the current service
performance at Makassar and Bitung Container
Terminals with a satisfaction level of 73.74%.
2. Service indicators that according to service users
are a priority for Makassar and Bitung Container
Terminals to be improved are: container loading
and unloading operator services, availability of
loading and unloading facilities, dwelling time,
transparent and compliant service fees, certainty
of service hours, and extortion.
ACKNOWLEDGEMENTS
In this study, the authors would like to express their
deepest gratitude to the Directorate General of Higher
Education, Research and Technology at The Ministry
of Education, Culture, Research and Technology.
REFERENCES
Adisasmita, R 2010, Dasar-dasar Ekonomi Transportasi,
Edisi Pertama, Graha Ilmu, Yogyakarta.
Due Nha Le, Hong Thi Nguyen, Phuc Hoang Truang, 2019.
Port Logistics Service Quality and Custumer
Satisfaction Empirical Evidence from Vietnam, The
Asian Jouernal of shipping and logistics, Volume 36,
Issue 2, June 2020, 89-103.
iCAST-ES 2022 - International Conference on Applied Science and Technology on Engineering Science
868

Dafazal Saffan, Bambang Syairudin, Fuad Achmadi, 2018.
Analisis Kepuasan Pelayanan Dan Loyalitas
Pelanggan Dengan Menggunakan Metode Servqual,
IPA, dan QFD, Business and Finance Journal, Volume
3, No. 1, March 2018.
Engel, J.F., et al. 1990. “Consumer Behaviour”, 6th ed,
Chicago, The Dryden Press.
Kotler, Philip. 2000. Marketing Management, Prentice Hall
Inc.
Munawar Ahmad, 2005. Dasar-dasar Teknik Transportasi,
Yogyakarta.
Padang Farid. 2018. “Model Angkutan Peti kemas Hub Dan
Feeder Port Dalam Menunjang Implementasi Tol Laut
Di Indonesia Timur”, Disertasi, Universitas
Hasanuddin Makassar.
Salim, A. A. 1994. Manajemen Pelabuhan. Jakarta: Raja
Grafindo Perkasa.
Tamin, Ofyar Z. 2008. Perencanaan, Pemodelan, dan
Rekayasa Transportasi: Teori, Contoh Soal, dan
Aplikasi, Bandung: Penerbit ITB.
Tjiptono, 1996, Manajemen Jasa, Penerbit Andi,
Yogyakarta.
Triatmodjo, 1996, Pelabuhan, Beta Offset, Yogyakarta.
Tse, D.K. and P. C. Wilton. 1998. Model of Customer
Satisfaction Formation: An Extention, Journal
Marketing Research.
Analysis of the Relationship Between Service Quality and Customer Satisfaction in the Stevedoring Process at Hatta Makassar (TPM) and
Bitung (TPB) Container Terminal
869
