
Energy Optimization of the Post-Harvest Area of Roses in Quiroga,
Ecuador – A Comparative Analysis
Joffre Espin-Castro
1a
, Saravana Prakash Thirumuruganandham
1,* b
, Hugo Yánez-Rueda
2c
,
Erika Chuncha-Ashqui
3d
, Doris Clavon-Taipe
3e
, Bryan Conrado-Mestanza
3f
,
Byron Abril-Flores
4g
and Muthukrishnavellaisamy Kumarasamy
5h
1
Centro de Investigación de Ciencias Humanas y de la Educación (CICHE), Universidad Indoamérica,
Ambato, PC180103, Ecuador
2
Facultad de Jurisprudencia Ciencias Políticas , Universidad Indoamérica, Ambato PC180103, Ecuador
3
Facultad de Ingeniería en Sistemas, Electrónica e Industrial, Universidad Técnica de Ambato,
Av. Chasquis and Rio Payamino, Ecuador
4
Soluciones Industriales B&L, Ambato, Ecuador
5
Civil Engineering Programme, School of Engineering, University of KwaZulu-Natal, Durban, South Africa
Keywords: Flexsim, Roses, Floriculture, Distribution, Timing, Bunches, Energy, Optimization, Simulation and
Modelling.
Abstract: This research document seeks to simulate the post-harvest area of roses in a floricultural company in order to
analyse improvement parameters. The study starts with the bibliographic and documentary methodology, as
well as experimentation. Time - movement study and the path diagram are used to build the simulation model
using FlexSim software and establish the probability distributions resembling a real process. Through the
analysis of the process, it was found that theoretically the Company produces 546 bunches of 20 roses per
week based on the bottleneck restriction. When it is compared with the simulation, there is an error of 0.08%,
resulting on an exact similarity to the real conditions. The simulation work concludes that by identifying the
bottleneck restriction respect to the pre-assortment and packaging process, which, although it has two stations,
it is the main limiting factor. Therefore, experimentation is developed to exploit the bottleneck, verifying that
with 3 stations the production is stabilized and a 4.39% increase in capacity respect to 546 units capacity
production. On the other hand, there will also be a 0.90% increase in bunches weekly.
1 INTRODUCTION
Rose production in the Netherlands has ecological
consequences and not negative social impacts unlike
in Ecuador. One of the culprits is the high energy
consumption of greenhouses (Franze & Ciroth,
2011). Another negative impact on flower production
are the different volcanoes. For example, the
a
https://orcid.org/0000-0001-5988-8233
b
https://orcid.org/0000-0003-4210-1363
c
https://orcid.org/0000-0003-1721-7524
d
https://orcid.org/0000-0002-5403-5378
e
https://orcid.org/0000-0002-8795-6915
f
https://orcid.org/0000-0001-5060-8063
g
https://orcid.org/0000-0001-8130-5815
h
https://orcid.org/0000-0003-1612-190X
*
Corresponding author
Cayambe volcano represents a potential threat to
populations that base their economy on floriculture
(Quinaluisa Morán, y otros, 2021). Ecuadorian
flowers have increased their participation in the world
market and exports, but in a slow way that places it
between the optimum and lost opportunities (Camino,
Andrade Diaz, & Pesantez Villacis, 2016). In
addition, the stems can be used as biosorbents (Said,
138
Espin-Castro, J., Thirumuruganandham, S., YÃ ˛anez-Rueda, H., Chuncha-Ashqui, E., Clavon-Taipe, D., Conrado-Mestanza, B., Abril-Flores, B. and Kumarasamy, M.
Energy Optimization of the Post-Harvest Area of Roses in Quiroga, Ecuador: A Comparative Analysis.
DOI: 10.5220/0011907200003612
In Proceedings of the 3rd International Symposium on Automation, Information and Computing (ISAIC 2022), pages 138-149
ISBN: 978-989-758-622-4; ISSN: 2975-9463
Copyright
c
2023 by SCITEPRESS – Science and Technology Publications, Lda. Under CC license (CC BY-NC-ND 4.0)

Tekasakul, & Phoungthong, 2019). Flower
production in certain parts of the country has weak
levels of organization and social capital. However,
over time the business model with the exemplary
dynamics of the world market will consolidate
(Martinez, 2013). The flower industry, in addition to
being a generator of employment and an indicator of
potential activities in the region, has an impact on the
environment (Simanjuntak, Soesilo, & Herdiansyah,
2020). The provinces that produce flowers in Ecuador
are Pichincha with 66%, Cotopaxi 15%, Azuay 6%,
Imbabura 5%, Guayas, 4% and another 8% (Pavón,
Andrade, Bernard, & Contreras, 2019). It is worth
noting that recently published data show that the
Netherlands is the largest flower producer in the
world, accounting for 49% of total world exports.
Ecuador is the third largest exporter with a 10% share,
while Colombia is the second largest player in this
market with a 16% share of global exports (Morán
Poveda, 2021), (Morocho-Aguirre, Cisneros-Aliaga,
& Soto-Gonzalez, 2021). These 3 players account for
75% of global flower exports. The data also confirm
that, according to the SAIKU system of SRI, 422
companies dedicated to the cultivation of flowers
throughout Ecuador have registered reported values
based on their economic activity in 2019. Tungurahua
accounts for 6.2% of the 422 companies located in
Ambato, Cevallos, Pelileo and Píllaro. Pichincha is
the province with the highest concentration of
companies, followed by Carchi, Cotopaxi, Imbabura,
Tungurahua and others (Sánchez, Vayas, Mayorga, &
Freire, 2020). A study on the participation and
competitiveness of flowers in Ecuador, based on
commercial development in the period 2010-2016,
especially indicators such as the comparative
advantage index, relative trade balance and import
intensity index, confirms that Ecuador is the most
competitive country in flower exports (Garcia &
Romero, 2020). Looking at the data of the
Association of Producers and Exporters of Ecuador
for the months of January-March 2019 - 2020, the
difference in foreign exchange sales and receipts is
remarkably large, mainly for two reasons:
1. the oversupply in the market as a result of an early
and abundant harvest 2. the emergence of the
coronavirus COVID - 19, which has triggered a
pandemic.
At the top of the list of those affected is the
floriculture sector, which is certainly the most
affected. The price per flower variety and the total
volume have decreased extremely. The figures are
currently unquantified, but are said to be approaching
an average of $1.5 million (Morocho-Aguirre,
Cisneros-Aliaga, & Soto-Gonzalez, 2021). In a global
context, we note that the Brazilian Institute of
Floriculture, in a brief report published as recently as
March 28, 2020, stated that sectors such as
floriculture are already feeling the effects of the
decline in sales two weeks after the introduction of
Covid-19 in Brazil. In an effort to revive growth, a
crisis committee was established in Brazil to relax
regulations for the floriculture sector, which suffered
at the beginning of the crisis (Beckmann-Cavalcante,
2020). There are already signs of recovery, with
adjustments for the use of technology and e-
commerce of flowers in direct connection with the
end consumer (Okumura, 2020). However, in
addition, various other strategies have been adopted
to prevent an even more drastic decline in the sector,
such as campaigns, revelations, and movements
through social networks (Rosa, 2020). As reported by
Reis et al (Reis, Reis, & Nascimento, 2020), in the
face of the crisis in the sector, organizations from
different sectors, both public and private, have tried
to inform the public, growers and technicians about
the situation of floriculture. Several live streams were
organized in which interviews were given about
floriculture, from production to marketing. These
movements were important to emphasize resilience,
that is, to adapt to change and make the wheel turn
again. Similarly, Taiwan's floriculture industry has
taken several measures to support its sector with
marketing campaigns focusing on 4 important
aspects: The government buying flowers to decorate
public spaces to encourage citizens to use more
flowers, such as an outdoor flower carpet show or
flower arrangements in train stations. 1. developing
new distribution channels closer to consumers' daily
lives, including flower stalls in supermarkets and
retailers to attract consumers. 2. promoting new ideas
for the use of flowers, such as the use of flower gift
boxes in temples. 3. developing consumers' habit of
buying flowers regularly. Taiwan's Council of
Agriculture (COA) has also proposed various rescue
and revitalization measures and advocates expanding
the world market in the hope of turning the crisis into
an opportunity to minimize the impact of COVID -19
on agricultural exports (Nieuwsbericht, 2020).
Addressing these challenges and combating
pandemics will require a joint effort between
governments, investors, and innovative agricultural
technologies. Agriculture 4.0 will no longer depend
on distributing water, fertilizer, and pesticides evenly
across entire fields. If production management and
produce trading can be augmented by low-cost, labor-
saving machinery, ancillary equipment, and sensor
components, along with the adoption of advanced
technologies such as ICT, IoT, Big Data, and
Energy Optimization of the Post-Harvest Area of Roses in Quiroga, Ecuador: A Comparative Analysis
139

blockchain, the goals of reducing agricultural stress
and labor demand, providing farmers with a more
efficient agricultural management model, and
mitigating the impact of the COVID -19 pandemic
could be achieved (Gunal, 2019).
At a worldwide level, organizations take into account
in a key way the continuous improvement systems
that focus on waste reduction as mentioned in the
Lean Manufacturing methodology, in which to
establish major changes to the company is too costly,
therefore different world-class organizations have
established the use of manufacturing simulators to
verify changes without costs and validate the
improvements proposed (Socconini, 2015),
(Bribiescas Silva & García Uribe, 2011).
The simulation of production processes is the
approach most used to design and analyse
manufacturing systems and is linked to the production
control system (Gunal, 2019), in which it allows the
reduction of costs due to leisure time and increase the
performance of its stations of work achieving a
balanced production that adjusts to the demand, in
addition to verifying significant growth in the market
(Aldás Salazar & Amán Morales, 2017), (Sánchez,
Ceballos, & Sánchez, 2014). Through simulation,
data on the operation of the production process are
collected, which makes it possible to estimate its
performance measures (Garcia & Romero, 2020).
This activity makes it possible to draw conclusions
about the behaviour of a system, studying the
behaviour of a model, whose cause and effect
relationships are the same (or similar) to those of the
original system (López, González, & Alcaraz, 2019).
Designing manufacturing systems that are tailored to
both production and market requirements is
becoming increasingly challenging due to variability
in demand (Luscinski & Ivanov, 2020), (Slack, 2005).
Another advantage of carrying out a simulation of the
processes is that it is possible to opt for models in
which the regulation options of the industrial sectors
that seek a transformation towards the eco-industry
are analysed while balancing the environmental and
economic effects; promoting further preferential
development of the ecology (Yu & Dong, 2019). For
this reason, simulation is an important tool that allows
solving problems that occur in industries (Bolaños-
Plata, 2014).
One of the simulation software that has been most in
demand among companies is FlexSim, which was
developed more than 20 years ago, so it has been
constantly improving with its interface and elements
that allow to achieve a real adequacy of the process,
since it has tools such as Experfit that allows the
creation of adjusted probability distributions based on
processing time, It is worth mentioning that large
companies such as Ford and even NASA use the
software to reduce costs due to bad decisions and
inefficient projects. Therefore, this software
contributes to the generation of almost real models-
of the industry with emphasis on the study of waiting
line systems, inventory models, investment models,
cash flows, logistics, and quality, among others
(Choque, y otros, 2013), (Castellanos, 2016), (Bruno,
2021).
Interest on improve productivity of manufacturing
companies has been growing in Latin America,
especially due to the rapidity of process and
machinery innovation, in addition to the growth of the
sector in general, which in turn generates greater
competition. Faced with this search to increase
productivity and eliminate waste, in many cases one
of the various tools that the Lean Manufacturing
methodology is used, either to reduce downtime,
machine maintenance, and quick tool changes,
improve quality (Turin, 2021), (Inkábova,
Andrejovská, & Glova, 2021). The performance of
the agricultural sector is linked to the tax system,
affecting profitability (Ramírez, 2021).
In addition, it allows to implement a quality
management system that leads organizations to
achieve excellence, superior performance that allows
differentiation and be increasingly competitive,
anticipating and achieving stakeholder satisfaction
(Ramírez, 2021). The goal is to keep productivity and
efficiency levels as high as possible, through careful
control and dosing of the other variables that can be
measured during an industrial optimization process
(Chen, Feng, Yang, Zhang, & Wei, 2021).
In Ecuador, the use of this system is not common,
therefore, it has been necessary to turn around the
traditional way of operating companies and optimize
production processes, in addition, eliminate the waste
that is generated in it, using Lean Manufacturing
Tools (HME), which considers the concepts of
activities that add value (AAV) and activities that do
not add (ANV), and other aspects within the process
(Curillo, Saraguro, Lorente, Ortega, & Machado,
2018), (Coronel, 2019).
The Company that have years in the export market is
reflected in problems with high costs of labor and
materials, so it is necessary to improve conditions
without reducing capacity and increase profits, but
verifying the performance of the areas and the
bottleneck or restriction of the system, so that through
simulation it is possible to achieve improvements of
great utility and ensure the sustainable exercise of its
operations (Hidalgo, 2019). One of the main markets
is the North American market, which has doubled its
ISAIC 2022 - International Symposium on Automation, Information and Computing
140

imports of Ecuadorian flowers in the last 20 years
(Loyola, Dole, & Dunning, 2019). The development
of products tailored to individual customer
requirements is essential if the company wants to
compete effectively in the domestic and global
market (Zywicki & Rewers, 2020). Due to the
location of the Company, it is possible to choose to
implement the concept of ecological industry, which
contributes to sustainable development (Liu & Ling,
2020).
The aim of this paper is to present the simulation 3D
model based on time and movements study exploding
the bottleneck to increase the production capacity
doing and experimentation with pre-assortment and
packing stations. We show the process map of the
company, flow diagram of the process, build 2D and
3D layout of the company, the bottleneck to exploit,
distribution of input data to do the simulation,
simulation of each process of the company, results of
operator utilization, the units on work in process,
water consumption on the simulation, experiment by
increasing the stations to destroy the bottleneck.
The rest of this paper is organized as follows: Section
II mentions the materials and methods used; Section
III presents the results and discussion, while Section
IV contains the conclusions.
2 MATERIALS AND METHODS
First, AutoCAD 2019 is a commercial software
application that based on computer aided design
(CAD) and drafting. This program is used to create
layouts in two or three dimensions (2D, 3D). Also,
AutoCad has many tools for different applications.
Second, Microsoft Excel is a commercial software
used to organize numbers and data with functions and
formulas. Excel can create graphs based on data
organized from different cells. Next, Minitab 18
software is a program for Higher Education and
Industry. Minitab supports on statistics analysis,
graphics capacity, quality evaluation and experiment
designer. Finally, FlexSim 2019 Software is a
commercial program to do 3D simulation, modeling
and analysis. This software help to understand
systems and take best decisions. Also, FlexSim allow
to experiment with the model based on data. FlexSim
has contributed with world-class applications in
healthcare issues, logistics systems such as container
operations in ports, simulations distributed in various
teams within a manufacturing company, in mining, in
aerospace centers and has even been adapted to the
industry service (hotels, hospitals, supermarkets, or
many other industries) to simulate the administration
and operation of human resources. FlexSim is a key
tool to improve results by giving correct answers to
the problems raised (Simón-Marmolejo, Santana-
Robles, Granillo-Macías, & Piedra-Mayorga, 2013).
FlexSim software allows to create accurately models
and understand basic system problems without
complicated programming. It because FlexSim offers
a simple way to develop the simulation model. Some
reasons why FlexSim is a good alternative as a
simulation tool are:
• Pre-built section allows to tackle much more
complex situations without having to write software
code.
• The software is object-oriented which
supports greater visualization of the production flow.
• The entire project is developed in a three-
dimensional environment (3D), in addition to
allowing the import of countless objects from
different design packages, including AutoCAD,
ProE, Solid Works, Catia, 3D Studio, AC3D, Rivit,
Google Sketch-Up and more.
• Not only discrete systems can be simulated,
fluid simulation or continuous-discrete combined
models are also supported.
• The generation of different scenarios and
different conditions are easy to program.
• Probability distributions can be represented
with great precision instead of average values to
accurately represent reality.
Floricultural companies in Ecuador are affected by
the absence of improvement studies to the restrictions
of their processes and optimize production capacity to
meet the demand in the domestic or international
market causing high costs of labor and materials. It is
necessary to improve the conditions without reducing
capacity and increase profits, but verifying the
performance of the areas and the bottleneck or
restriction of the system. Applying the documentary
bibliographic research, we seek to investigate the
historical background and characterization of the
company, establishing a field research which will
allow to extract data and direct information from the
company, through the collection with the use of
techniques such as time collection cards. In the same
way, applying the descriptive and experimental
research, the analysis and description of the data
obtained from the simulation by means of the tools is
Flexim software. In addition, allow to simulate
processes in real time without affecting the existing
production process is performed. The study is focused
on the operational process. The manufacturing
simulation is used in the organization’s rose post-
harvest area. First, there is the process of Admission
or reception of roses. Secondly, Immersion
Energy Optimization of the Post-Harvest Area of Roses in Quiroga, Ecuador: A Comparative Analysis
141
corresponds to submerging the roses in tanks with
different chemicals to eliminate bacteria. On this step
for future research, simulate a water distribution
piping system to evaluate alternatives strategies for
improving water quality could be possible because
Flexsim allow it too (Susanto, Amrina, Purwanto,
Pruto, & Yochu, 2020). Thirdly, the reception takes
place in a cold room to preserve the shape of the roses.
Followed by the flower web output to process where
all the elements are registered by computer. Then the
classification of roses and elimination of waste
manually. Then the Bunches in which a sheet, leagues
and codes are placed. Next is the web flower
fingering where you check the number of roses. This
is followed by the stem cutting. Subsequently, the
encapuche helps to protect the roses. Later, hydration
is performed to preserve the condition of the roses.
Then, the pre-assortment where the roses are
classified according to the orders, followed by bunch
packing and the wrap. Before finishing, the roses are
subjected to low temperatures in forced cold. Finally,
the dispatch of roses to the consumer and export of
the different types of roses that arrive based on
customer demand and orders.
3 RESULTS AND DISCUSSION
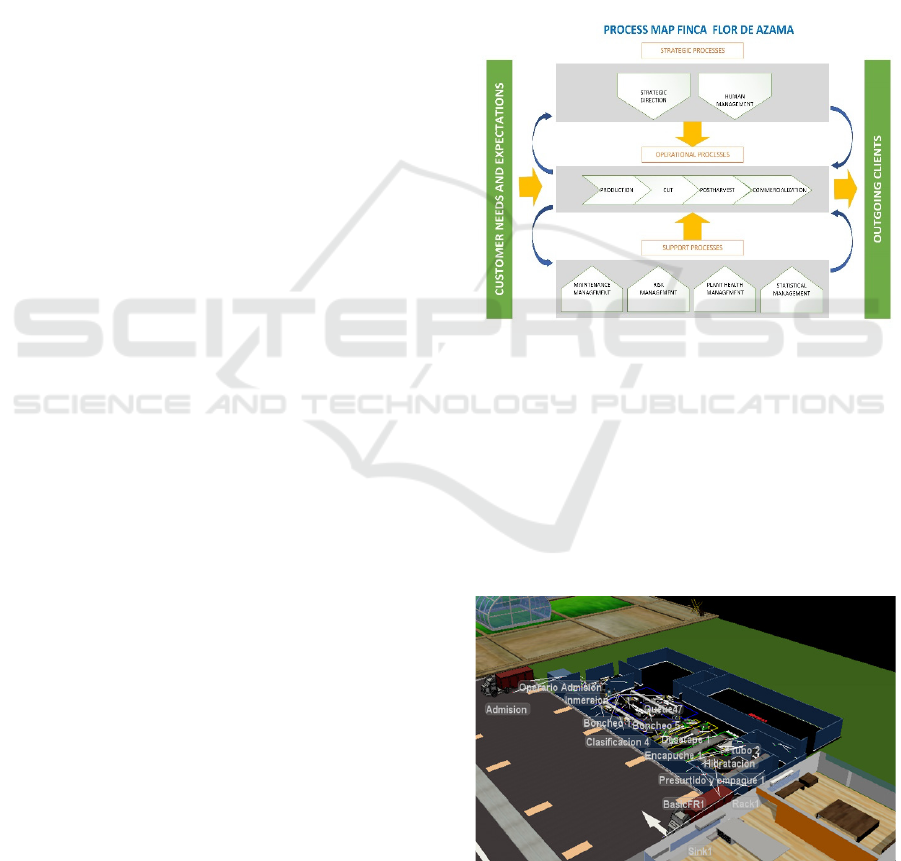
Fig.1 shows the process map according to
management system. The process map is a tool that
allows to represent the relevant processes to satisfy
the customer and achieve the company’s objectives
(Salvador-Hernández, Llanes-Font, & Velázquez-
Zaldívar, 2019). This method contains the strategic
processes that provide guidelines to the other
processes. Strategic processes support decision
making, while operational processes are those that
have a direct impact on customers, creating value for
them. Finally, the support processes support the
operational processes, providing the means or
resources for the latter to be carried out (García-
Dunna, García-Reyes, & Cárdenas-Barrón, 2013).
The study is focused on the operational process. The
manufacturing simulation is used in the
organization’s rose post-harvest area. First, there is
the process of Admission or reception of roses.
Secondly, Immersion corresponds to submerging the
roses in tanks with different chemicals to eliminate
bacteria. Thirdly, the reception takes place in a cold
room to preserve the shape of the roses. Followed by
the flower web output to process where all the
elements are registered by computer. Then the
classification of roses and elimination of waste
manually. Then the Bunches in which a sheet, leagues
and codes are placed. Next is the web flower
fingering where you check the number of roses. This
is followed by the stem cutting. Subsequently, the
encapuche helps to protect the roses. Later, hydration
is performed to preserve the condition of the roses.
Then, the pre-assortment where the roses are
classified according to the orders. Followed by
bunches packing. Followed by the wrap by bunches.
Before finishing, the roses are subjected to low
temperatures in forced cold. Finally, the dispatch of
roses to the consumer and export of the different types
of roses that arrive based on customer demand and
orders.
Figure 1: Process Map of the Company.
With the purpose of developing the simulation of the
process, the routing diagram is based on the processes
described above, mentioned on methods. For the
development of a real representation of the
organization, we used the layout of the routing
diagram with the measurements elaborated in
AutoCAD software. Layout and 3D objects were
added to FlexSim software presented (Fig 2).
Figure 2: 3D Structure of the Company.
ISAIC 2022 - International Symposium on Automation, Information and Computing
142

Figure 3: Average time and standard time for a 20 rose
bonche.
Fig.3. Once the times and movements for a package
of 20 roses are obtained, they are evaluated by
process and it is determined that the packaging
process is the one that presents the longest times with
an average of 442.81 seconds. In addition, its standard
time is 491.52 seconds.
Figure 4: Post-harvest process bottleneck.
Fig.4 represents the bottleneck analysis and it shows
that the restriction of the entire area is the Pre-
assortment and Packaging process with an hourly
capacity of 13.66 bunches. Considering that the
simulation is developed for a period of one week, the
following calculation is performed to determine the
number of bunches at the end of the week, the
following calculation is applied:
Therefore, we have a theoretical weekly value of 546
bonuses per week established by the system
restriction, which is the base value to check with the
current simulation model.
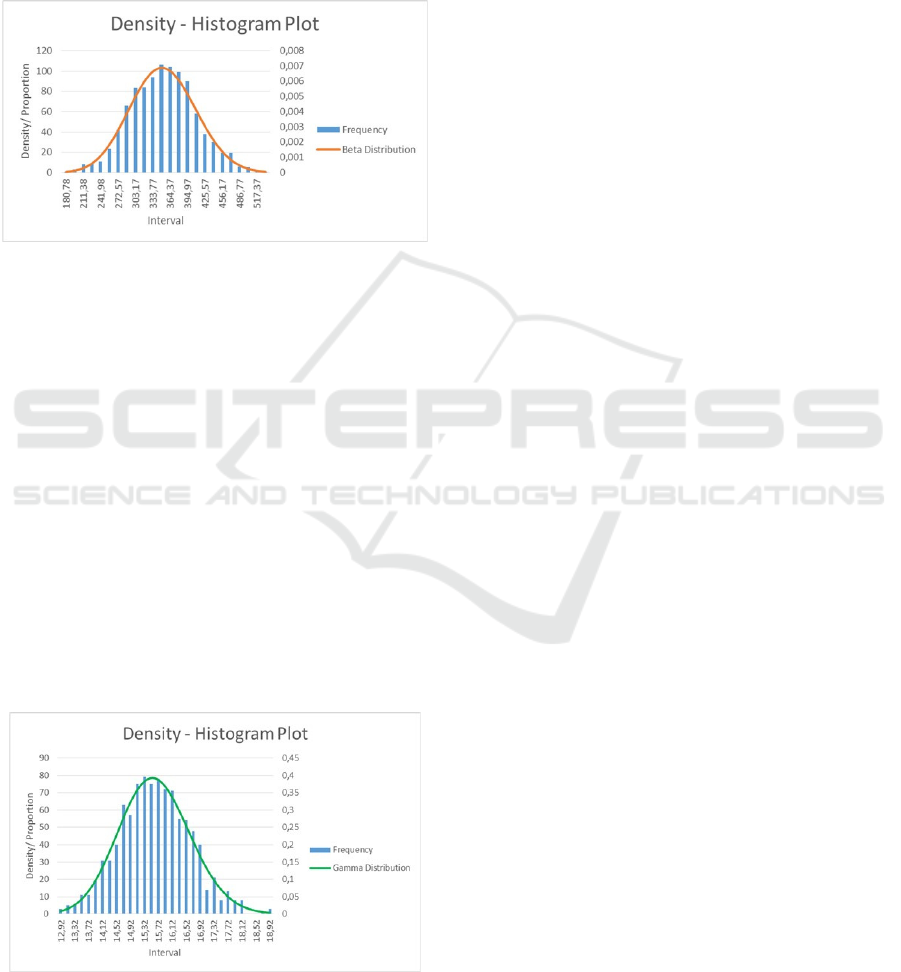
Fig.5 shows the Beta and Erlang probability
distributions as a function of time. It is used for the
entry arrival or admission of roses. The Erlang
probability distribution is a continuous random
variable. This probability is represented by an
equation known as probability density function to
know the cumulative function of the random variable.
This distribution is 87.93% coupled, because there is
the possibility of having infinite inter-arrival times of
roses, which are situations far from reality
(Hermenegildo, 2010). However, the Beta probability
distribution is more closely fitted to the data. When
comparing the frequency histogram and Beta
distribution with the values simulated in FlexSim, we
have an “Error” in the model mean with respect to the
sample mean 6.9160e-4 which is 0.00%.
Corroborating that the Beta probability distribution
fits 100%.
Figure 5: Creation of probability distributions and
probability plots.
Figure 6: Inbound Arrival Distribution
Fig.6 shows the Beta probability distribution which
best matches the random variables generated, having
a discrete model. This model analyzes the sampling
of the number of bunches that arrive from the harvest
area in the period of one week, allowing to simulate
this variable (Simón-Marmolejo, Santana-Robles,
Granillo-Macías, & Piedra-Mayorga, 2013). In
addition, the frequency histogram of the admission
arrival is presented with the distribution adjustment,
where the frequency histogram of the simulated
Energy Optimization of the Post-Harvest Area of Roses in Quiroga, Ecuador: A Comparative Analysis
143
values is compared and it is observed that the
frequencies do not differ significantly (Salvador-
Hernández, Llanes-Font, & Velázquez-Zaldívar,
2019). To corroborate the distribution, the Anderson-
Darling test is carried out, confirming the correct
operation of the simulation in Flexsim (Simón-
Marmolejo, Santana-Robles, Granillo-Macías, &
Piedra-Mayorga, 2013).
Figure 7: Sorting process distribution (Beta).
Fig.7 presents a beta distribution which adjusts to the
data of the random variable of the classification
process, this figure coincides with Fig 5., when
comparing the frequency histogram of the arrivals to
the classification process with the adjustment from
the distribution and the frequency histogram of the
simulated values, it can be seen that the frequencies
do not differ significantly (Salvador-Hernández,
Llanes-Font, & Velázquez-Zaldívar, 2019). This
distribution is used to model the behaviour of the
random variable with a finite lower and upper bound
(García-Dunna, García-Reyes, & Cárdenas-Barrón,
2013); which was determined using the Anderson
Darling test to corroborate that the random variables
come from the beta probability distribution (Simón-
Marmolejo, Santana-Robles, Granillo-Macías, &
Piedra-Mayorga, 2013).
Figure 8: Sorting process distribution (Gamma).
Fig.8 shows a Gamma distribution fitted to the data
of the random variable of the hydration process. This
distribution represents the problems of waiting times
in the shipment of bunches from hydration (González,
Galvis, & Hurtado, 2014). In this model the bundles
are processed in series without waiting in a process
with a common processing rate, for this reason the
Gamma distribution fits in the best way (Altiok &
Melamed, 2007). The software run to represent a
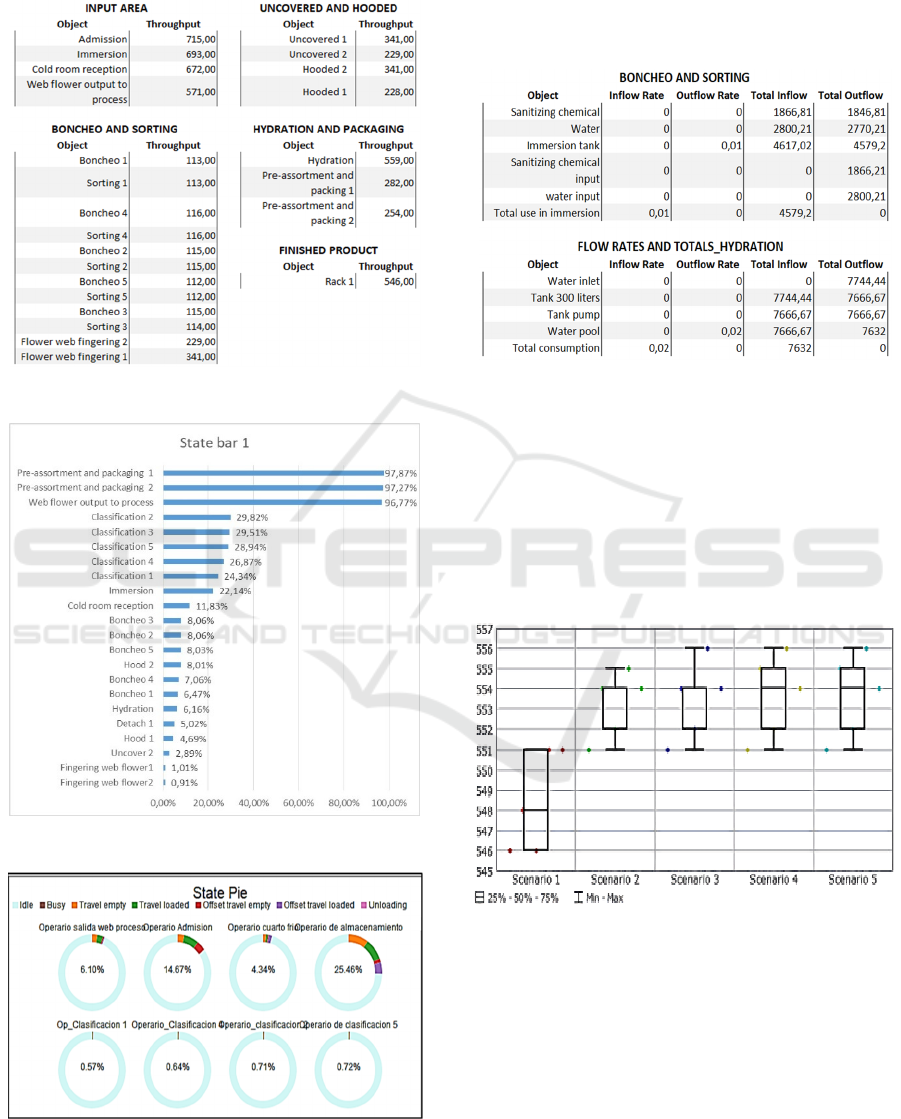
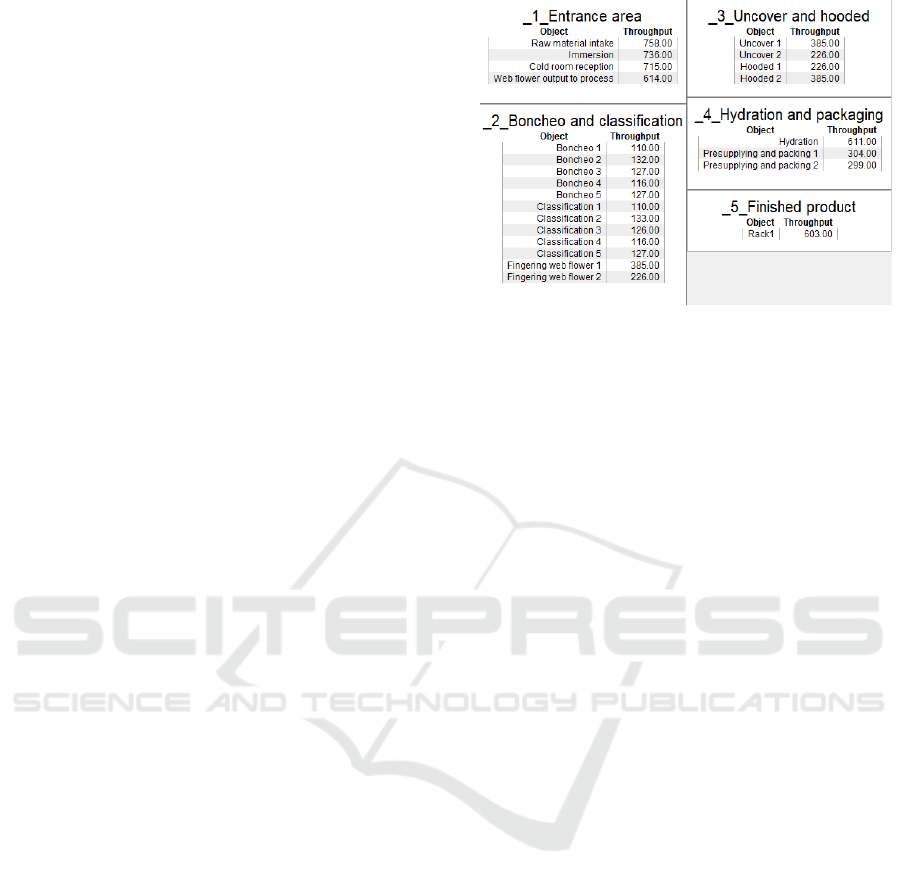
week with 8 hours and 5 days (144000 seconds). As
shown in Fig 9, The Admission goes with a total of
715 units but only 571 units are sent to the process
from the web flower output . It means that 144 units
were remaining in the process on the input area. The
distribution to the classification process is sent in a
balanced way of 20% (5 classification stations are
100%). The outputs of the bands in the web typing
processes have a total of 570 rose bonches, so when
it are sending to the encapsulation process only 569
units arrive. Only 1 bonche is left in process. Then, it
goes to the pre-sorting and packaging process which
it has two workstations. Finally, in a week 546
bonches are produced. Therefore, a comparison is
made with the theoretical balance and it is verified
that there are 546.47 bonches per week, so it is
similar, although it is worth mentioning that due to
the distributions that are handled, the amount
produced will always vary, so it is estimated to have
an error of 0.08%, resulting in a simulation similar to
the real conditions limited by the restriction of the
system. From Fig 10, The results obtained regarding
the state that prevails within the processes, indicating
that bottlenecks are the ones that are most loaded with
work, as it is determined that the pre-assortment 1 and
2; They are the ones that dominate in 97.87% of
processing, followed by the web exit to the process
with 96.77%, so in this way it is attributed and
verified that it is necessary to act on the bottleneck
and improve it.
We note that, Fig.11 the operator who develops more
activity is the storage operator with 25.46%, followed
by the classification operator 2. Since the processes
are distributed more for the areas where the
percentage of distribution is higher, so that operators
tend to move more in transport, in this way it can be
greatly improved by reducing stations for the demand
that is needed. The values of the queues reach more
than 150 and are increasing because the capacity of
the restriction process limits. It continues to
accumulate throughout the week. Also, it denotes
peaks due to the schedules of the logistics of the
production shipment. So, when it is compared with
the Little’s Law, it is verified that for each cycle 3.41
bonches are left in the process, which is consistent
ISAIC 2022 - International Symposium on Automation, Information and Computing
144
with the total number of bonches in process during
the week.
Figure 9: Throughput of the process.
Figure 10: Process status results.
Figure 11: Operator utilization
Therefore, it is possible to consider parameters that
can reduce the work in processes and have more
finished product. Experimentation is carried out to
vary how the production process would work with
more stations.
Figure 12: Water Consumption.
Fig.12 shows that the water consumption of the
immersion process is 4579.20 liters per week, which
in comparison with the reality of 4600 liters has an
error of 0.45%. The hydration process is also
analyzed with 7632 liters in relation to the normal
consumption of 7700 liters, showing an error of
0.89%. Both cases shows a similarity to the real
conditions of the process.
Figure 13: Capacity per week.
Improvement scenarios
Simulation in FlexSim allows the development of
flexible scenarios that are easy to modify, which is
why in this case the following scenarios are
established to verify the improvement that can be
executed in the real process, in which there are:
• Explode the bottleneck with 3 pre-fill and pack
stations.
Energy Optimization of the Post-Harvest Area of Roses in Quiroga, Ecuador: A Comparative Analysis
145
• Level the process with exploitation of the
second bottleneck in the web flower output process to
the process with 2 stations in conjunction with
scenario 1.
• Establish an additional half shift of 4 hours of
work on Saturdays from 8:00 am to 12:00 pm.
Improvement scenario 1
Using experimenter tool, variants are executed with
respect to the bottleneck, in which the capacity is
exploited to verify said operation. To note that, from
Fig 13, the results of experimentation that means with
3 pre-supply and packing stations a maximum of 570
bunches per week can be reached, after that it
stabilizes. It is the maximum that the bottleneck can
be exploited. With 3 stations a capacity increase in
4.39% (100(570-546)/546) and it is achieved respect
to Cp. Increase more than 3 stations will have the
same result, a maximum of 570 units. Process
simulation models are very effective tools to identify
process bottlenecks and to improve process
parameters (Straka, Tausov, Rosov, Cehlar, &
Kacmary, 2020).
Improvement scenario 2
It is additionally used to place 3 pre-supply and
packing stations, the placement of a second web
flower outlet station to the process. Also, run the
model for one week working, denotes an increase in
capacity of 823 bunches per week, by placing 3
stations in the first bottleneck in the pre-supply and
packaging process, and additionally 2 stations in the
web flower output to the process., for which an
improvement of 277 weekly bunches is obtained,
which represents an increase of 50.73%, although it
should be noted that it would lead to high costs, which
must be linked to the demand factor of the
organization to choose with the decision to place
additional jobs globally.
Improvement scenario 3
From the current situation, the modification of the
work schedule is made by adding a 4-hour shift from
8:00 a.m. at 12:00 p.m., in which it allows to verify
the increase in capacity by extending the working
day, for which the modification is used through the
FlexSim. In addition, it allows the management of
employees’ working time in a designated area or
activity (Borkowski, Czajka, Pluta, & Suder-Debska,
2016).
Figure 14: Results of improvement scenario 3.
Through Fig. 14, a weekly production of 603
bunches, so that with respect to the initial conditions
there is an increase in capacity of 57 bunches,
indicating an increase of 10.44% which is a positive
value for the organization without considering high
costs by incorporating 2 workstations, in addition to
adapting to current demand.
4 CONCLUSION
The floricultural Company has 14 processes for the
post-harvest area of roses, in which the study of times
and movements was developed, resulting in a
production capacity of 546 bonches of 20 roses for
one week, established by the production limit in the
process of pre-assortment and packaging. Through
the analysis of queues with Little’s Law it was
determined that in the process there are 3.41 bonches
avarage for each cycle of the process, meaning that
the queue is minimum before the bottleneck. By
developing the simulation model through the use of
the structure of the organization both 2D and 3D, a
representation similar to the real part was achieved,
also through the use of the experfit tool, the time
distributions were determined for each process within
the floriculture, schedules, failures, use of interfaces
and fluids with Floworks library creating a process
similar to the real one. Running the simulation
production and bottleneck analysis data were
reflected, showing a production of 546 finished
bunches. Comparing to the theoretical part, there is an
error of 0.08%, defining a great accuracy process. It
was determined through experimentation that the pre-
supply and packaging process that defines the
production can improve its capacity up to 570
bunches per week stabilizing the line with 3 stations.
Comparing with the real situation of 546 units, there
ISAIC 2022 - International Symposium on Automation, Information and Computing
146

is an improvement of 4.39% on the capacity. The
consumption of water in immersion is 4579.20 liters
and in hydration is 7632 which are similar to the real
conditions of the process with errors less than 1%.
ACKNOWLEDGEMENTS
Financial support from the seed grant “Computational
modeling of biomaterials and applications to
bioengineering and classical and quantum machine
learning for predicting social engineering (2022–
2026, code: INV-0012-042)”, Universidad
Indoamérica, Ecuador, awarded to S.P.T.
CONFLICT OF INTEREST
The authors declare no conflict of interest.
REFERENCES
Aldás Salazar, D., & Amán Morales, R. (2017, June).
Estrategia de manufactura para el control de la
producción en el área de lavado y teñido de la Fábrica
Ram Jeans. Retrieved from
https://repositorio.uta.edu.ec/handle/123456789/25706
Altiok, T., & Melamed, B. (2007, June). Simulation
Modeling and Analysis with ARENA. Retrieved from
https://www.elsevier.com/books/simulation-modeling-
and-analysis-with-arena/altiok/978-0-12-370523-5
Beckmann-Cavalcante, M. (2020). Floriculture and Covid-
19. Ornamental Horticulture, 6-7.
Bolaños-Plata, O. (2014). Importancia de la simulación en
la mejora de procesos. Retrieved from
www.ptolomeo.unam.mx:
http://www.ptolomeo.unam.mx:8080/xmlui/bitstream/
handle/132.248.52.100/5884/tesis.pdf?sequence=1
Borkowski, B., Czajka, I., Pluta, M., & Suder-Debska, K.
(2016). The Conceptual Design Dynamic Acoustic
Maps to Assess Noise Exposure. Polish Journal of
Environmental Studies, 1415.
Bribiescas Silva, F., & García Uribe, E. (2011).
Optimizacion de la productividad en la industria de
plasticos en CD. Juarez. Revista Internacional
Administraci{on Finanzas (RIAF), 101.
Bruno, N. (2021, April 07). Marco teórico para diagnóstico
y propuesta de mejora en la línea de producción de
postes y vigas en una empresa metalmecánica
empleando herramientas de Lean Manufacturing.
Retrieved from
https://tesis.pucp.edu.pe/repositorio/handle/20.500.124
04/18759
Camino, S., Andrade Diaz, V., & Pesantez Villacis, D.
(2016). Posicionamiento y eficiencia del banano, cacao
y flores del Ecuador en el mercado mundial /
Positioning and efficiency of bananas, cocoa and
flowers in the global market. Ciencia UNEMI, 48-53.
Castellanos, I. (2016). Sistema de fabricación de zapatos en
cuero, con simulación r. Retrieved from
https://prezi.com/wj4q6vemz-on/sistema-de-
fabricacion-de-jeans-con-simulacion-r
Chen, L., Feng, Q., Yang, W., Zhang, F., & Wei, H. (2021).
Photocatalytic Process Optimization by Numerical
Simulation Based on the Removal Efficiency of
Carbamazepine under Different Operating Conditions.
Polish Journal of Environmental Studies, 2013-2025.
Choque, A., Colca, G., Lozano, J., Manrique, F., Merma,
S., & Pinto, S. (2013). Modelo de Simulación Aplicado
para Optimizar El Proceso Productivo de La Línea de
Calzado Vans en La Empresa ANDALOZ S.A.C.
Retrieved from
https://es.scribd.com/document/288699783/Modelo-
de-simulacion-aplicado-para-optimizar-el-proceso-
productivo-de-la-linea-de-lavado-y-tinturado-de-jeans-
en-la-empresa-ANDALOZ-S-A-C
Coronel, J. (2019, September 25). Optimización de
reducción del desperdicio de acero en la fabricación
estructuras metálicas utilizando las 5S del Lean
Manufacturing para llevar a cabo el TPM. Retrieved
from
https://repositorio.upn.edu.pe/handle/11537/22235
Curillo, E., Saraguro, R., Lorente, L., Ortega, E., &
Machado, C. (2018). Aplicación de Herramientas de
Manufactura Esbelta en la Empresa Textil Anitex,
Atuntaqui, Ecuador. Retrieved from
https://www.eumed.net/rev/oel/2018/03/herramientas-
empresa-anitex.html
Franze, J., & Ciroth, A. (2011). A comparison of cut roses
from Ecuador and the Netherlands.
International
Journal of Life Cycle Assessment, 366-379.
Garcia, J., & Romero, J. (2020). Design of a simulation
model, using a software of discretional events, in a
production line of industrial knitting.
RevistaInternacional de Investigación e Innovación
Tecnológica.
García-Dunna, E., García-Reyes, H., & Cárdenas-Barrón,
L. (2013). Simulación y análisis de sistemas con
ProModel 2da edición. Retrieved from
https://cffgblog.files.wordpress.com/2017/03/libro-
simulacic3b3n-y-anc3a1lisis-de-sistemas-2da-
edicic3b3n.pdf
González, C., Galvis, S., & Hurtado, T. (2014). La
distribución Beta Generalizada como un modelo de
sobrevivencia para analizar la evasión universitaria.
Estudios Pedagógicos, 133.
Gunal, M. (2019). Simulation and the Fourth Industrial
Revolution. Simulation for Industry 4.0, 1-17.
Hermenegildo, M. (2010). Variables Aleatorias En La
Gestión Empresarial. Simulación Gestión en el Tercer
Milenio, 79.
Hidalgo, S. (2019, December 17). Optimización del
rendimiento de la mano de obra del área de
postcosecha rosas de la empresa florícola flor de
azama, mediante el estudio de métodos y tiempos.
Energy Optimization of the Post-Harvest Area of Roses in Quiroga, Ecuador: A Comparative Analysis
147

Retrieved from
http://repositorio.utn.edu.ec/handle/123456789/9620?l
ocale=en
Inkábova, M., Andrejovská, A., & Glova, J. (2021). The
Impact of Environmental Taxes on Agriculture – the
Case of Slovakia. Polish Journal of Environmental
Studies, 3085-3097.
Izquierdo García, D., Mosquera Torres, M., Roble
Quiñones, G., & Rosales Cortez, F. (2018).
Competitividad en las exportaciones floricolas del
Ecuador. Revista Ciencia Digital, 315-327.
Liu, H., & Ling, D. (2020). Value chain reconstruction and
sustainable development of green manufacturing
industry. Sustainable Computing-Informatics Systems,
18.
López, A., González, A., & Alcaraz, S. (2019). Simulation-
based optimization for the production of axes in
assembly lines of a manufacturing company.
Ingeniería, Investigación y Tecnología, 1-9.
Loyola, C., Dole, J., & Dunning, R. (2019). South and
Central America Cut Flower Production and
Postharvest Survey. Hort Technology, 898.
Luscinski, S., & Ivanov, V. (2020). A Simulation Study of
Industry 4.0 Factories Based on the Ontology on
Flexibility with Using FlexSim Software. Management
and Production Engineering Review , 74-83.
Martinez, L. (2013). Flores, trabajo y territorio: el caso
Cotopaxi. Revista de Desarrollo Económico
Territorial, 75-100.
Morán Poveda, L. (2021). Sector florícola ecuatoriano y
afectación en mercado internacional a causa del
covid19: Ecuadorian flower sector and impact on the
international market due to covid19. South Florida
Journal of Development, 4609-4621.
Morocho-Aguirre, N., Cisneros-Aliaga, M., & Soto-
Gonzalez, C. (2021). EL COVID 19 y su impacto
financiero en el sector florícola ecuatoriano. Análisis
comparativo. Digital Publisher CEIT, 146-157.
Nieuwsbericht. (2020, August 20).
https://www.agroberichtenbuitenland.nl. Retrieved
from https://www.agroberichtenbuitenland.nl:
https://www.agroberichtenbuitenland.nl/actueel/nieuw
s/2020/08/20/impact-of-covid-19-on-the-taiwanese-
floriculture-industry
Okumura, R. (2020, October 26). www.venturus.org.br.
Retrieved from www.venturus.org.br:
https://www.venturus.org.br/en/the-technological-
impacts-of-the-pandemic-on-agribusiness/
Pavón, F., Andrade, S., Bernard, B., & Contreras, D.
(2019). Impacto socioeconómico por lahares y caída de
ceniza ante la erupción del volcán Cayambe en la
actividad florícola en Cayambe y Pedro Moncayo.
Revista Cartográfica, 123.
Quinaluisa Morán, C., Villamar Torres, R., Díaz Ocampo,
E., Moncayo Carreño, O., López Bosques, J., &
Jazeyeri, S. (2021). State of the Art of Floriculture in
Ecuador: Historical and Current Economic Context,
Genetic Improvement and Carbon Footprint. Nexo
Agropecuario, 111.
Ramírez, D. (2021, may 12). Herramientas y técnicas de
mejora de la calidad en la industria de alimentos
latinoamericana y su aporte a la competitividad
organizacional. Retrieved from
https://repository.uamerica.edu.co/handle/20.500.1183
9/8507
Reis, S., Reis, M., & Nascimento, A. (2020). Pandemic,
social isolation and the importance of people-plant
interaction. Ornamental Horticulture, 399-412.
Rosa, A. (2020, March 28). www.ibraflor.com.br.
Retrieved from www.ibraflor.com.br:
https://www.ibraflor.com.br/post/ibraflor-
prev%C3%AA-fal%C3%AAncia-de-66-dos-
produtores-de-flores-e-de-plantas-ornamentais
Said, A., Tekasakul, S., & Phoungthong, K. (2019).
Investigation of Hydrochar Derived from Male Oil
Palm Flower: Characteristics and Application for Dye
Removal. Polish Journal of Environmental Studies,
807-815.
Salvador-Hernández, Y., Llanes-Font, M., & Velázquez-
Zaldívar, R. (2019). Gestión por procesos en la
participación ciudadana. Aplicación en el territorio
Holguinero. Ingeniería Industrial, 59.
Sánchez, A. M., Vayas, T., Mayorga, F., & Freire, C.
(2020). https://blogs.cedia.org.ec. Retrieved from
https://blogs.cedia.org.ec/:
https://blogs.cedia.org.ec/obest/wp-
content/uploads/sites/7/2020/06/Diagn%C3%B3stico-
sector-flor%C3%ADcola-Ecuador.pdf
Sánchez, P., Ceballos, F., & Sánchez, G. (2014). Analisis
del proceso productivo de una empresa de
confecciones: modelación y simulación. Ciencia e
Ingeniería Neogranadina, 137-150.
Simanjuntak, L., Soesilo, T., & Herdiansyah, H. (2020).
Analysis of Near Infra Red (NIR) Impact as the Control
Process of a Palm Oil Mill and Refinery Plant for
Environmental Sustainability. Polish Journal of
Environmental Studies, 3013-3021.
Simón-Marmolejo, I., Santana-Robles, F., Granillo-Macías,
R., & Piedra-Mayorga, V. (2013). La simulación con
FlexSim, una fuente alternativa para la toma de
decisiones en las operaciones de un sistema híbrido.
Científica, 39-49.
Slack, N. (2005). The flexibility of manufacturing systems.
International Journal of Operations & Production
Management, 1190-1200.
Socconini, L. (2015). Certificacion Lean Six Sigma Green
Belt - Para La Excelencia En Los Negocios 2a Edicion.
ALFAOMEGA.
Straka, M., Tausov, A., Rosov, A., Cehlar, M., & Kacmary,
P. (2020). Big Data Analytics of a Waste Recycling
Simulation Logistics System. Polish Journal of
Environmental Studies, 2355.
Susanto, A., Amrina, U., Purwanto, P., Pruto, E., & Yochu,
W. (2020). Analysis of Free Residual Chlorine in
Drinking Water Distribution Systems in Ore Processing
Industry. Polish Journal of Environmental Studies,
4321.
Turin, D. (2021, February 17). Análisis de la
implementación del pensamiento lean en empresas
ISAIC 2022 - International Symposium on Automation, Information and Computing
148

latinoamericanas y diferencias entre Lean Service y
Lean Manufacturing. Retrieved from
https://tesis.pucp.edu.pe/repositorio/handle/20.500.124
04/18257
Yu, H., & Dong, S. (2019). A System Dynamics Approach
to Eco-Industry System Effects and Trends. Polish
Journal of Environmental Studies, 1469-1482.
Zywicki, K., & Rewers, P. (2020). A simulation-based
approach to study the influence of different production
flows on manufacturing of customized products.
Advances in Production Engineering & Management,
467.
Energy Optimization of the Post-Harvest Area of Roses in Quiroga, Ecuador: A Comparative Analysis
149
