
Line Structured Light Measurement System, Method and
Experiments for Rail Profile
Qingli Luo
*
, Shubin Zhang and Zhiyuan Chen
State Key Laboratory of Precision Measuring Technology and Instruments, Tianjin
University, No. 92, Weijin Road, Nankai District, Tianjin 300072, China
Keywords: Line Structured Light, Profile Measurement, Light Plane Calibration, Center Line Extraction.
Abstract: More than 40,000 kilometers of high-speed railway has been built in China, and it is the longest all over the
world. The wear of railway rails would affect the safety of train operation. The traditional manual contact
measurement methods had the disadvantages of low measurement efficiency and the surface of the
measured object was easy to wear. Then, it was of great significance to develop high-precision, non-contact
rail profile measurement methods. This paper designed and implemented a method for rail profile
measurement with line-structured light. A structured light plane parallel to the cross-section of the rail was
emitted by a line laser. The image data were collected by an industrial camera, and then the actual rail
profile was extracted through the center line extraction algorithm and coordinate transformation. The
method has been tested on 60kg rail profile measurement and the profile measurement experiment results
proved it has higher precision and faster speed, compared with results from the Coordinate Measuring
Machine (CMM).
1 INTRODUCTION
In recent years, high-speed railways construction in
China has developed rapidly and the total operating
mileage has exceeded 40,000 kilometers. The high-
speed railway network spans north-south and east-
west, connecting different cities closely. It greatly
meets the travel needs of people and promotes
economic development of passing regions and plays
an increasingly important role in social development
(Ye, 2018). As an important part of the railway
system, rail is in direct contact with the train. Severe
wear, corrosion, fracture, peeling and other defects
will lead to serious safety accidents. Therefore,
regular inspection of rails is required. Since the rail
profile directly reflects the degree of rail defects and
represents the contact condition between wheel and
rail, it is necessary to measure the profile of the rail
section precisely, and then the data can provide a
scientific reference for rail maintenance (Wang et
al., 2018).
The traditional rail profile measurement
technology mainly depends on measurement tools
including mechanical rail wear rulers for contact
measurement (Zhang, 2019). Contact measurement
requires the participation of inspection personnel,
with the disadvantages of a low degree of
automation, low testing efficiency, and poor real-
time performance, and then it cannot meet the
requirements of high-speed railway development
(Zhou et al., 2020). Moreover, the contact
measurement requires contact with the rail surface,
and it will wear instruments, affect the measurement
accuracy and damage the surface of the rail (Wu et
al., 2020).
By contrast, in the iterative updating process of
the computer and electronic technology, the non-
contact measurement methods depending on optical
means have attracted more attention. They are
categorized into passive and active ways according
to imaging illumination modes. Passive
measurement builds a human-like binocular vision
system and it extracts distance information from two
different visual directions of a 2D image (Jiang et
al., 2020; Xu et al., 2019; Wang et al., 2019). The
disadvantages are heavy computing burden, low
precision, and slow calculation, and it is highly
dependent on the texture characteristics of the
measured objects. The active measurement relies on
structured light technology. Structured light is
categorized into three types based on the beam
emitted by the laser: point, line, and plane (Zhang,
162
Luo, Q., Zhang, S. and Chen, Z.
Line Structured Light Measurement System, Method and Experiments for Rail Profile.
DOI: 10.5220/0011916900003612
In Proceedings of the 3rd International Symposium on Automation, Information and Computing (ISAIC 2022), pages 162-168
ISBN: 978-989-758-622-4; ISSN: 2975-9463
Copyright
c
2023 by SCITEPRESS – Science and Technology Publications, Lda. Under CC license (CC BY-NC-ND 4.0)

2018). The device of point structured light is simple.
However, the shortcomings are cumbersome and
time-consuming and not suitable for large-sized
objects (Cui, 2018). The surface structured light
increases the measurement range and processing
efficiency. And the disadvantages are increasing of
calibration complexity and data processing.
Moreover, since the measurement results are easily
affected by the other light sources and the reflection
performance of the object surface, it has higher
requirements for the measurement environment
conditions (Landmann et al., 2018). Compared with
the above two types of structured lights, line
structured light only uses the emitted light plane to
intersect the contour of the object for measurement.
The advantages are simple structure, fast image
processing speed, and little influence due to
environmental conditions, and it has good stability
in industrial applications (Lian et al., 2019). For
example, it is applied to measure the contour of the
disc cam (Hu, 2020) and to the detection system
(Ren, 2021).
This paper designed a monocular line structured
light rail profile measurement method with the
advantages of non-contact, high precision, and high
speed. The method first used a line laser to emit a
structured light plane parallel to the cross-section of
the rail, then collected image data through an
industrial camera, and finally obtained the actual rail
profile through a center line extraction algorithm and
coordinate transformation model. The method has
the characteristics of simple equipment and quick
processing.
2 METHODOLOGY
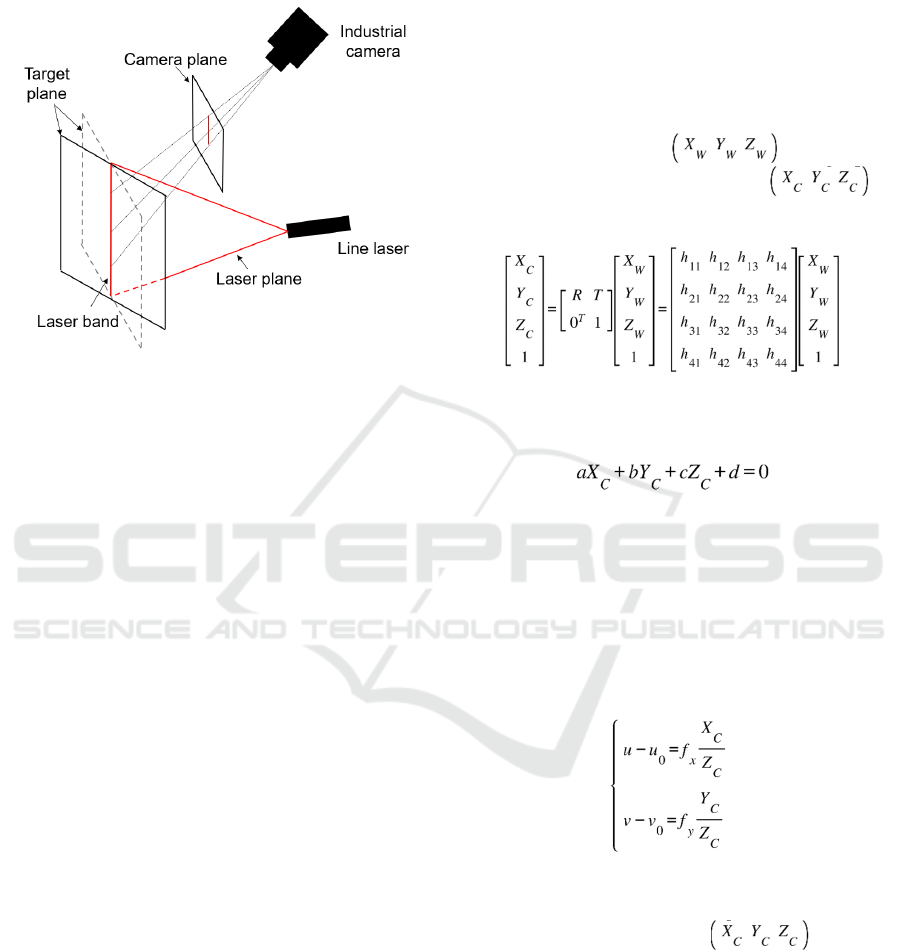
In this paper, the monocular line structured light is
exploited to realize rail profile measurement. The
measurement system schematic diagram is shown in
figure 1. The main equipment includes an industrial
Figure 1: The schematic diagram of the measurement
system for the rail profile.
camera, a line laser, and a computer. The line laser
emits a structured light plane parallel to the cross-
section of the rail. It forms a structured light band
and then the rail profile information is captured on
the rail surface. The industrial camera and structured
light plane form a certain angle to capture the light
band image and then the image is transmitted to a
computer. The laser center line of the rail profile
image is processed by the corresponding algorithm
and the 2D image coordinates are transformed into
actual physical coordinates with the camera
calibration transformation model. The measurement
profile is finally obtained.
Figure 2 presents the flowchart of the
measurement system for rail profile and it consists
of four parts: calibration of camera parameters,
extraction of profile center line, calibration of light
plane parameters, and coordinate transformation.
The camera calibration is to obtain the mapping
relationship of the image coordinate, camera
coordinate, and world coordinate. The extraction of
the profile center line mainly realizes rail profile
extraction from the image. The calibration of the
light plane is applied to obtain coefficients of the
structured light plane and then applied for
subsequent restoration of the rail profile. The
coordinate transformation finishes transforming the
2D profile image into the actual measured profile of
the rail.
Figure 2: The flowchart of the measurement system.
2.1 Calibration of Camera Parameters
The camera parameters should be calibrated before
imaging. In our experiments, a 2D plane calibration
plate is applied to the camera calibration. The reason
is that a 2D target can provide more reliable
manufacturing accuracy and is easy to use,
compared with a 3D target.
The world coordinate of the point is represented
as , and the pixel coordinate is
Line Structured Light Measurement System, Method and Experiments for Rail Profile
163

represented as . is the scale factor. H is the
camera's external parameter matrix and the internal
parameters under different spatial poses are
represented by matrix M. The camera calibration
transformation model is established as equation (1).
(1)
The parameters to be calibrated are listed in
Table 1. The horizontal and vertical scale factors of
the image are represented by and , the
coordinates of the main point of the image are
represented by and , and is the tilt factor. The
distortion parameters of the lens are represented by
vector K, and the radial and tangential distortion
coefficients are represented by and . The
rotation and translation matrix from camera
coordinates to world coordinates are represented by
R and T, which form the camera external parameter
matrix H.
Table 1: The calibration parameters of the camera.
Parameters
Expression
Perspective
transformation
matrix
Len distortion
p
arameter matrix
Rotation matrix
Translation vector
2.2 Extraction of Profile Center Line
An ideal structured light image consists of a constant
background and a uniform target light band. To
calculate the center points of the light band, it is
necessary to separate the background from the target
light band. However, the unavoidable existence of
noise in actual collected images comes from the
external environment and inside of the laser.
Complex object surface conditions and other factors
will bring difficulties to the extraction of the light
band, so some actions need to be taken to reduce
these bad effects. In this paper, the collected image
is pretreated by background processing, Gaussian
filtering, and grayscale segmentation. Then the
center point is extracted from the target light band
by the Steger algorithm. Finally, the image
coordinates are restored to real profile coordinates
through the line structured light measurement model.
In the step of background processing, two images
of the calibration plate are captured when the line
laser is working or non-working. These two images
are subtracted and then a structured light image with
a completely black background is calculated.
After background processing, Gaussian filtering
is applied. Gaussian kernel function takes the
weighted average results of the gray value of all
pixels in the neighborhood to be the gray value of
the central pixel. Different weights are set to pixels
at different positions and a higher weight is set when
the position is closer to the central pixel. Then, it has
the advantage that the gray distribution characteristic
of the image can be preserved as completely as
possible when reducing noise.
Following that, grayscale segmentation is
applied. The filtered image can be divided into the
light band and background based on the grayscale
feature. Assuming that the grayscale of any pixel of
the target image is , we set a threshold G, and
the pixels whose grayscale value is greater than G
belong to the foreground, otherwise, these pixels
belong to the background.
Then, the Steger algorithm is performed to obtain
the center line. It performs Taylor polynomial
expansion on the gray distribution of the light band
in the normal direction of each pixel and takes the
extreme point that satisfies both the polynomial and
second derivative of the gray level as the center
point of the light band. Compared with other center
extraction algorithms, the Steger algorithm has the
advantages of better processing accuracy and
robustness, and it fully considers the direction of the
light band.
According to Steger’s conclusion, of the
Gaussian kernel function should satisfy equation (2).
(2)
where w is half of the width of the light band and the
scale of the Gaussian kernel function is .
ISAIC 2022 - International Symposium on Automation, Information and Computing
164
2.3 Calibration of Light Plane
Parameters
Figure 3. The model of laser plane calibration.
A 2D plane target is adopted in the calibration of the
light plane. First, take all points on the light band as
a set of calibration points. Second, by freely moving
the plane target within the measurement range of the
laser, the image coordinates of multiple sets of non-
collinear calibration points are obtained. Then
convert them into a camera coordinate system
according to the relationship between the target
plane and the image plane. Finally, the parameters of
the light plane are obtained by least squares fitting.
We use a 2D calibration plate. During the calibration
process, the calibration plate does not need to keep
parallel movement and can freely change position
and posture within the camera view, reducing the
difficulty of operation. There is no need to extract
calibration points. We convert all coordinates on the
light band to a world coordinate system, which
increases the number of calibration points, thereby
reducing the error of results.
The specific calibration process is as follows.
(1) The target position is adjusted to locate in the
center of the camera view and it is intersected with
the structured light plane.
(2) The laser switch is turned on and then the line
structured light is emitted to the 2D target. The
image is collected. Then the laser switch is turned
off without changing the position of the target.
Another image is collected.
(3) The position of the target is adjusted and the
above steps are repeated to obtain multiple sets of
target images and corresponding images with a
structured light band.
(4) After completing the above acquisition
process, the rotation and translation matrices are
calculated by using the perspective transformation
matrix M and the model in Section 2.1.
(5) The sub-pixel center points of laser bands of
targets with different poses are obtained through
image processing algorithms.
(6) Substitute the pixel coordinates of each
center point into equation (1) in Section 2.1 to
calculate its coordinates in target plane
world coordinates. The coordinates are
calculated by equation (3).
(3)
Finally, the light plane is fitted by the least
square method.
(4)
2.4 Coordinate Transformation
Coordinate transformation transforms the two-
dimensional pixel coordinates of the center points in
Section 2.2 into 3D coordinates of the actual rail
profile. It rotates the structured light plane to be
parallel to the coordinate plane, and the actual
profile curve is calculated.
(5)
Firstly, the two-dimensional pixel coordinates of
the rail profile are taken into equation (5) and three-
dimensional coordinates of the
measurement profile can be obtained with equation
(4) in Section 2.3.
Then, the camera coordinates are taken into
equation (8) to rotate around the x and y axes and
the rotation angle is determined by equations (6) and
(7).
Line Structured Light Measurement System, Method and Experiments for Rail Profile
165

(6)
(7)
(8)
After coordinate transformation, the structured
light plane is rotated to be parallel to the XOY plane
and the actual rail profile coordinates
are extracted.
3 EXPERIMENTS AND RESULTS
The BFS-U3-13Y3M black and white area array
industrial camera and the Tamron M112FM25 low-
distortion industrial lens were used in the
experiments. A high-precision checkerboard
calibration board with 12x9 corner points was
selected and the cell size was 15x15mm. The
calibration toolbox Camera Calibrator was applied
to the industrial camera calibration in our
experiment.
Figure 4. Line structured light measurement system.
The calibration results of the camera are shown
in Table 2.
Table 2: The results of camera parameters calibration.
Parameters Value
Internal
parameters
Distortion
p
arameters
Figure 5(a) presents the line structured light
profile image of the 60Kg rail collected in a
laboratory environment and Figure 5(b) illustrated
the results after center line extraction. Figure 6
provides the visualization results of the center points
of the light band in the light plane transformed from
local world coordinate systems. The light plane is
fitted by the least square method and the values of
the parameters are shown in Table 3.
(a) Profile measurement of 60Kg rail.
(b) Center line of 60Kg rail.
Figure 5: Images of rail profile.
ISAIC 2022 - International Symposium on Automation, Information and Computing
166
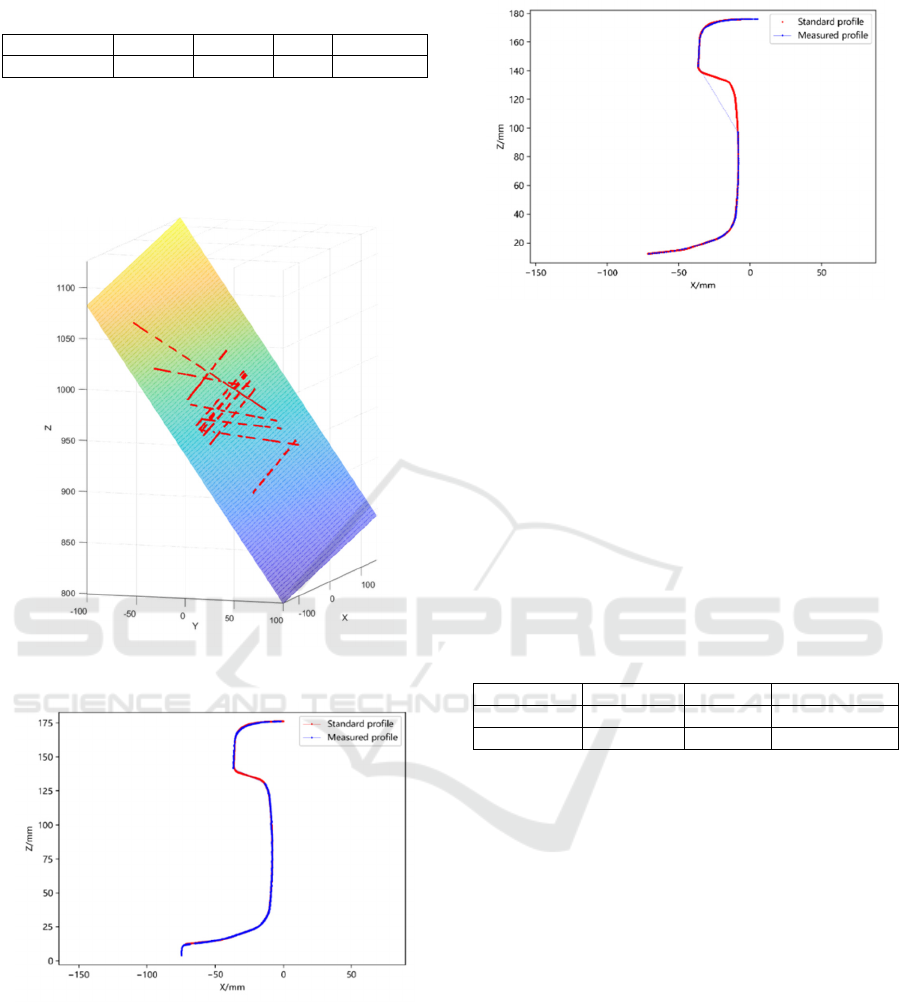
Table 3: The fitting results of line structure light plane.
Parameters
a b c d
Value
0.1458 -1.4166 -1 962.7770
Figure 7(a) and (b) present the rail profile
results between the standard and our measured
profiles, and the results between the standard and
CMM measured profile, respectively.
Figure 6: Line structure light plane.
(a) The rail profile measured between the standard and our
measured profile.
(b)The rail profile measured between standard and
CMM measured profile.
Figure 7: The results of measurement.
To quantitatively evaluate the experimental
results, three different distance algorithms, including
Hausdorff Distance (HD), Frechet Distance (FD)
(Alt, 2009; Xie et al., 2017), and Dynamic Time
Warping Distance (DTWD) (Keogh et al., 2005)
were applied to calculate the fitting degree of rail
profile. As shown in Table 4, the results of these
distance algorithms proved that our system has
higher accuracy compared with CMM.
Table 4: The fit degree of the rail profile (Lower is better
for all distance algorithms).
Name FD HD DTWD
CMM 22.71 2.15 0.43
Ou
r
8.79 0.65 0.38
Our measurement method is composed of several
different techniques and which are photography,
optics, and image processing. The factors affecting
measurement error come mainly from two aspects:
hardware system and software algorithm.
The error in the hardware system comes from the
camera and laser. The camera is used for image
acquisition. Higher camera resolution results in less
distortion, better performance, higher quality
images, and more accurate measurement. The laser
is used to emit a line laser. The thinner and straighter
the laser is, the better quality of extracted center line
will be.
The error in the software algorithm comes from
calibration and image processing. The extraction
accuracy of calibration points has a great influence
on the final results. In our method, all points of the
light band are used to fit to reduce the error.
Moreover, the extraction accuracy of center points is
greatly affected by external noise, the performance
of the processing algorithm, and the state of the rail
Line Structured Light Measurement System, Method and Experiments for Rail Profile
167

surface. The background processing algorithm
applied in this paper can reduce the errors during
processing.
4 CONCLUSION
This paper designed and implemented a method for
measuring the profile of rail with a monocular line
structured light system. We applied it to measure the
60kg rail profile and compared the results with that
from the CMM. The experiment proved that our
measurement results are as good as the CMM and
our method has higher measurement efficiency
compared with the point-by-point contact
measurement of CMM. The experiments were
completed in a static environment in the laboratory,
and further research should focus on profile
measurement under outdoor dynamic conditions.
ACKNOWLEDGMENTS
We would like to thank the support from Dr. Peng
Wang and Dr. Ji Deng for building the system and
data calibration. This research was supported by
National Engineering Laboratory for Digital
Construction and Evaluation Technology of Urban
Rail Transit (grant No. 2021ZH04).
REFERENCES
Ye, H. (2018). Research on key technologies of automatic
3D measurement of high speed railway hub based on
line laser scanning. Master’s thesis, HUST.
Wang, H., Li, Y., Ma, Z., Zeng, J., Jin, T., and Liu, H.
(2018). Distortion rectifying for dynamically
measuring rail profile based on self-calibration of
multiline structured light. In IEEE Transactions on
Instrumentation and Measurement, pages 678-689.
IEEE.
Zhang, Z. (2019). Research on the rail wear measurement
system based on machine vision. Master’s thesis,
BJTU.
Zhou, Z., Yang, H., and Liu, J. (2020). Research on the
three-dimensional detection system of the rail full
profile. In Journal of Physics: Conference Series,
1633(1): 012002.
Wu, F., Dou, H., Wu, Y., Li, Z., and Yang, X. (2020).
Method for detecting sharp rail contour based on
machine vision. In Optical Technique, 46(04): 453-
460.
Jiang, Y., Wang, Z., Han, J., Jin, Y., and Li, B. (2020).
Regional fuzzy binocular stereo matching algorithm
based on global correlation coding for 3D
measurement of rail surface. In Optik, 207: 164488.
Xu, G., Chen, J., Li, X., and Su, J. (2019). Profile
measurement adopting binocular active vision with
normalization object of vector orthogonality. In
Scientific Reports, 9(1): 1-13.
Wang, P., Li, W., Li, B., and Li, B. (2019). Structured-
light binocular vision system for dynamic
measurement of rail wear. In 2019 IEEE 2nd
International Conference on Electronics Technology
(ICET), pages 547-551. IEEE.
Zhang, S. (2018). High-speed 3D shape measurement with
structured light methods: A review. In Optics and
Lasers in Engineering, 106: 119-131.
Cui, H., Hu, Q., and Mao, Q. (2018). Real-time geometric
parameter measurement of high-speed railway
fastener based on point cloud from structured light
sensors. In Sensors, 18(11): 3675.
Landmann, M., Heist, S., Brahm, A., Schindwolf, S.,
Kühmstedt, P., and Notni, G. (2018). 3D shape
measurement by thermal fringe projection:
optimization of infrared (IR) projection parameters. In
Dimensional Optical Metrology and Inspection for
Practical Applications VII, 10667: 9-18.
Lian, F., Tan, Q., and Liu, S. (2019). Block thickness
measurement of using the structured light Vision. In
International Journal of Pattern Recognition and
Artificial Intelligence, 33(01): 1955001.
Hu, Z. (2020). Research on vision measurement
technology of disc cam based on line structure light.
Master’s thesis, JLU.
Ren, J. (2021). Based on line structured light of
pantograph slide abrasion detection system research.
Master’s thesis, NYCU.
Alt, H. (2009). The computational geometry of comparing
shapes. In Efficient Algorithms. pages 235-248.
Xie, D., Li, F., and Phillips, J, M. (2017). Distributed
trajectory similarity search. In Proceedings of the
VLDB Endowment, 10(11): 1478-1489.
Keogh, E., Ratanamahatana, C, A. (2005). Exact indexing
of dynamic time warping. Knowledge and information
systems, 7(3): 358-386.
ISAIC 2022 - International Symposium on Automation, Information and Computing
168
