
Prediction of Daily Electricity Use in Residential High-Rise Buildings
Using Artificial Neural Networks
Ahmad Rofii and Hanif Ibrahim
Universitas 17 Agustus 1945 Jakarta, Indonesia
Keywords: JST, Backpropagation Method, MATLAB, MSE, MAPE.
Abstract: The high demand for electrical energy from consumers requires producers to provide a reliable but economic
supply of electrical energy. Therefore, strategies and methods are needed to match the power generation and
demand. This can be achieved by planning a good and proper operation. One of the important steps in planning
the operation of the electric power system is predicting the need for electrical loads. One method of predicting
electrical loads is to use ANN (Artificial Neural Networks). ANN is an information processing system with
characteristics similar to biological neural networks. This method uses ANN with a backpropagation
algorithm, and the prediction results are obtained by adding electrical load data (KW) for the selected similar
days. ANN processing using MATLAB software. The artificial neural network architecture uses 15 input
layers, 15 output layers, and ten hidden layers, and the activation function used is logsig and purelin. Logsig
for hidden layers and purelin for output layers. The results of the electrical load prediction using an artificial
neural network with the backpropagation method, the Mean Square Error (MSE) value of network training is
0.1, and the MAPE value of data testing is 6.5%. The results of the prediction of electricity use in high-rise
residential buildings in February 2023 are predicted.
1 INTRODUCTION
One of the types of energy that propagates through
the cable network. electricity, has played an essential
role in the progress of human civilization in various
fields. The use of electricity will be affected by
increased human activities. Electricity providers must
provide enough electricity to meet high consumer
demand. Second type will cause obesity and lack of
physical activity. The electricity sector is considered
to be a field that requires long-term forecasts so that
the power plant infrastructure is ready to be supplied
with electricity. However, long predictions are
difficult to achieve. Timeframes and financing factors
are often the obstacles faced. Therefore, to anticipate
the events mentioned above, it is necessary to make
projections to estimate how much electrical energy
will be consumed.
Artificial intelligence software is now being
developed due to computational advances to create
alternative techniques for long-term electrical energy
forecasting. In addition to being easier to use,
computational innovations result in more accurate
findings. Experts are working to develop an artificial
intelligence system that can estimate future electrical
energy needs.
Artificial neural networks are one the most
effective intelligent systems in making predictions.
Artificial neural networks are used to predict the use
of electricity that will be used in buildings. in this
way we can predict the use of electricity in a building
2 LITERATURE REVIEW
Research conducted by Fathur Rohman et al. (2021)
with the title "Electrical Load Prediction Using
Artificial Neural Network Method Backpropagation".
This study used the method of predicting electrical
loads using JST (Artificial Neural Network)
Backpropagation. The study
has indicated electrical loads using artificial neural
networks backpropagation method of the largest
MAPE (Mean Absolute Percentage Error) value
obtained with a value of 4.32 %. And the smallest
MAPE value is obtained with a value of 2.71 %.
(Rohman, 2022).
Research conducted by Yuan Octavia et al. (2018)
with the title "Study of electrical load forecasting
Rofii, A. and Ibrahim, H.
Prediction of Daily Electricity Use in Residential High-Rise Buildings Using Artificial Neural Networks.
DOI: 10.5220/0011980100003582
In Proceedings of the 3rd International Seminar and Call for Paper (ISCP) UTA â
˘
A
´
Z45 Jakarta (ISCP UTA’45 Jakarta 2022), pages 293-299
ISBN: 978-989-758-654-5; ISSN: 2828-853X
Copyright
c
2023 by SCITEPRESS – Science and Technology Publications, Lda. Under CC license (CC BY-NC-ND 4.0)
293

using artificial neural network method."In a case
study of the distribution of electrical energy in the
Mojokerto Region, this study using the Artificial
Neural Network (JST) approach with the use of
backpropagation algorithms to predict long-term
electricity needs. In this study, there were eight
variables used, with variables bound is the amount of
electricity consumption. The free variable is the sum
of population, GRDP, number of household sector
customers, number of sector customers, industry,
number of business sector customers, number of
social sector customers, number of business sector
customers, and distribution losses. According to this
analysis, the electrical load of The Mojokerto region
is predicted to grow by 22.641 percent between 2018
and 2030, an average of 1.728% per annum. (Yuan et
al., 2018).
Research conducted by Diah Setyowati and Said
Sunardiyo (2020) under the title "Forecast of
Electrical Energy Needs with Artificial Neural
Networks (Artificial Neural Network)
Backpropagation Method 2020-2025". With using the
Artificial Neural Network Backpropagation
technique using MATLAB software, this research
predicts the electrical energy needs of PT PLN 7
(Persero) UP3 Semarang in 2020–2025. The study
resulted in a growth annual of a total percent (GOT%)
of 2.7% and the average percentage of errors absolute
(MAPE) of 0.4%. (Setyowati & Sunardiyo, 2020).
2.1 Theoretical Basis
2.1.1 Predictions
Forecasting is the practice of predicting events or
items in the future (Jay, 2009). Three prediction
categories depending on the time frame that can be
made: short-term, medium-term, and long-term
(Aryan Hamidie, 2009). Hourly, daily, and three-
month periods are included in the short-term
forecasts. Predictions for the medium term or medium
period often range from three months to two years.
Long-term predictions are generally for two-year
planning or more (Sugiarto & Harijono, 2000). To
foresee events that are not desirable and get ready to
take the necessary actions and predictions required
(Arifah et al., n.d.). Although it is difficult to foresee
the future, Forecasts can be used as a guide to reduce
errors. Achievement of long-term goals in the
installation of production control systems
(production) and allocation of power lines require
accurate projections, in particular for energy
producers.
2.1.2 Electrical Energy
Energy from natural resources is converted into
electrical power by generating electricity. According
to the resources used, Power plants are classified as
PLTU, PLTA, PLTN, PLTS, and others. Generators
in power plants convert mechanical energy into
electricity using the concept of conductors and
electric fields. The energy produced will be stored in
accumulators or energy storage devices.
Transmission lines will channel the electrical energy
that has been kept to the customer. Based on the
voltage value, shape, the type of conductor used, line
arrangement, and circuit array, transmission and
distribution lines Classified. However, the alternating
current voltage transmission line of the 3-phase and
1-phase is usually used to distribute electricity from
power plants. However, some transmission lines also
use direct current voltage.
2.1.3 Electric System Power
Electrical power components, such as electric power
production, transmission systems, and distribution
systems, form the electric power system. Third, these
components comprise most of the power grid that
transports electricity from the production station to
the load station. Transmission lines connect
production stations to distribution systems and,
through interconnections, to other power systems. All
individual loads are connected to the transmission
line through a distribution system at substations that
handle voltage conversion and switching operations.
Figure 2.1 below shows the power system circuit
electricity (Eirene & Sau, 2019).
The electrical installation system in high-rise
buildings is divided into utility lines, lighting lighting,
air conditioning channels and stop contact channels.
How to find out the use of electrical power in each
room of the building is to place a measuring
instrument on the main panel as well as in every room
that is considered a tenant or occupant. To identify the
use of electrical power in each room, a set of
measuring instruments is installed starting from
measuring power, current, voltage, and cos phi.
Recording is carried out in accordance with
operational standards determined by the building
management. the relationship between current,
voltage, power based on the following formula
sebagai berikut
P=√3 V_p I_p cos∅
Where Vp is the phase voltage, Ip is the phase
current and cos∅ is the power factor.
In the electrical system of residential buildings,
the parameters measured are single-phase parameters,
so to determine and predict the use of electrical power
ISCP UTA’45 Jakarta 2022 - International Seminar and Call for Paper Universitas 17 Agustus 1945 Jakarta
294
in residential buildings, it is necessary to carry out the
results of phase measurements into 3 phase
calculations.
2.1.4 Artificial Neural Network
The functioning system of neural networks can be
compared with the human brain. Many neurons are
found in the neural network, which is connected. The
information obtained through the outgoing
connection will be altered by these neurons and sent
to different contacts. Report (called input). It will
have a certain arrival weight when it is delivered to
neurons. By summing all the weight values in this
input, a particular propagation function will process
them. What will then compare the results with a
specific threshold value using the activation function
of each neuron? The neuron is not triggered if the
input drops below the threshold value, but if it is, it is
involved and transmits the output to all neurons
connected to it with its output weight (Kusumadewi,
2004)
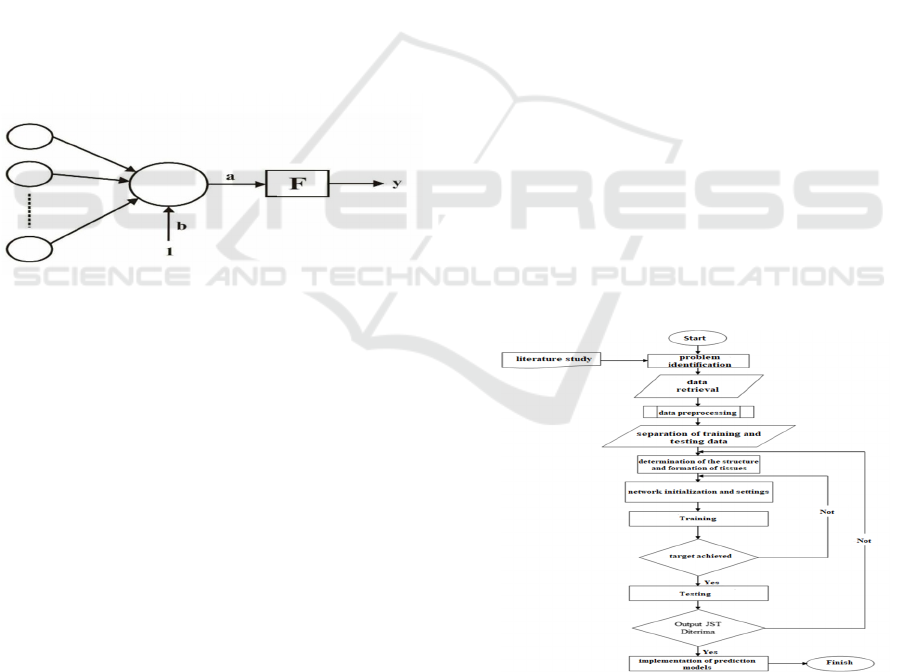
Figure 1: Activation Function on Simple Neural Networks
In the figure, a neuron will process N inputs (x
1
,
x2, ..., x
N
) which each have weights w
1
, w
2
, ..., wN,
and bias weight b, with the formula :
𝑎
∑
𝑥
𝑤
Then the activation function F will activate into
the output of the network y.
2.1.5 Backpropagation Algorithm
According to (Kusumadewi, 2004), Perceptrons with
multiple layers often use backpropagation-guided
learning techniques to modify the weights that
connect neurons in the hidden layer. The
backpropagation method adjusts the backward weight
value by using the error output. What must complete
the forward propagation stage first to get this error.
Neurons are triggered using the differential activation
function as propagation progress.
2.1.6 Backpropagation Architecture
Artificial neural network-based backpropagation or
propagation feedback consists of many units in one or
more hidden layers. The artificial neural network base
in the feedback propagation architecture drawing
contains n inputs (plus bias), hidden layers with p
units (plus bias), and m output units (Prasetyo &
Sahala, 2014).
3 RESEARCH METHODOLOGY
The research methods used in the preparation of this
final project report are:
a. Literature studies examine the necessary
theories from handbooks that support and
relate to the themes taken to be used as
theoretical foundations.
b. Discussion, namely conducting a question and
answer with supervisors and technology in the
field and friends (University of August 17,
1945 Jakarta).
c. Observation Method, plunge directly into the
field to study the selected object.
d. Perform calculations and analyzes.
3.1 Flowchart Research
This project research method explains the estimated
consumption of electrical energy. The preparation of
this final project can be seen in the flowchart.
Figure 2: Research Flowchart
X
2
W
N
∑
Prediction of Daily Electricity Use in Residential High-Rise Buildings Using Artificial Neural Networks
295
4 RESULTS AND DISCUSSION
What can analyze the estimated electrical energy
consumption for the next month based on connected
power (VA) and the amount of energy (kW). What
will discuss this regarding the results of estimating
electrical energy consumption using the artificial
neural network method of backpropagation.
If any, should be placed before the references
section without numbering.
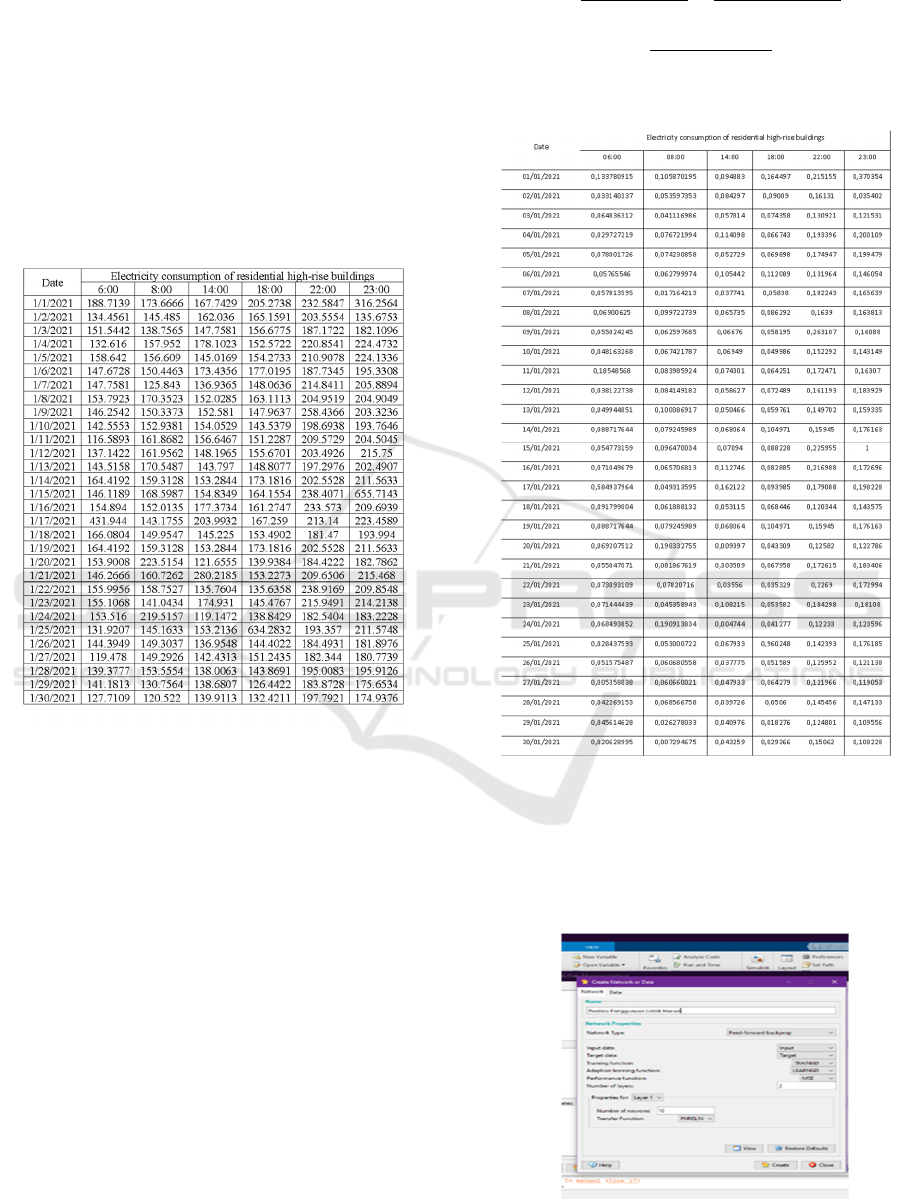
Table 1: Three-phase data
The neural network training process for artificial
backpropagation requires several parameters,
including the number of hidden layers, epoch, error
goals, and learning rate. Parameter changes made
during training are the number of hidden layers 10,
starting from the number of epochs 4000, 6000, and
8000, the number of learning rates starting from
0.001, 0.01,0.1, and for error goals 0.001. This is done
to obtain good training results. The training data used
for the training are connected power data (VA) and
amount of energy (kW) from January 1, 2021 to
January 30, 2021 and training target data, namely
connected power data (VA) and energy amount
(kWh) from January 16 to January 31. Before the data
is entered into the artificial neural network, the data
must be normalized in the range [0 to 1] because the
input data of the artificial neural network uses the
logsig activation function (binary sigmoid). To
convert the original data into normalization data using
a formula.
Min – max normalization:
𝑋
𝑋𝑚𝑖𝑛 𝑋
𝑟𝑎𝑛𝑔𝑒𝑋
𝑋𝑚𝑖𝑛 𝑋
𝑋
𝑚𝑖𝑛 𝑋
𝑋
𝑋𝑚𝑒𝑎𝑛 𝑋
𝑆𝐷𝑋
Table 2: normalization data.
Backpropagation Artificial Neural Network
Program for electric power load forecasting using 15
input and 15 target data. It consists of 15 input units
and ten layers on the hidden layer and 15 units on the
output layer. The activation function of the input unit
to the hidden layer is a binary sigmoid (logsig) and
purelin.
Figure 3: Network creation toolbox
ISCP UTA’45 Jakarta 2022 - International Seminar and Call for Paper Universitas 17 Agustus 1945 Jakarta
296
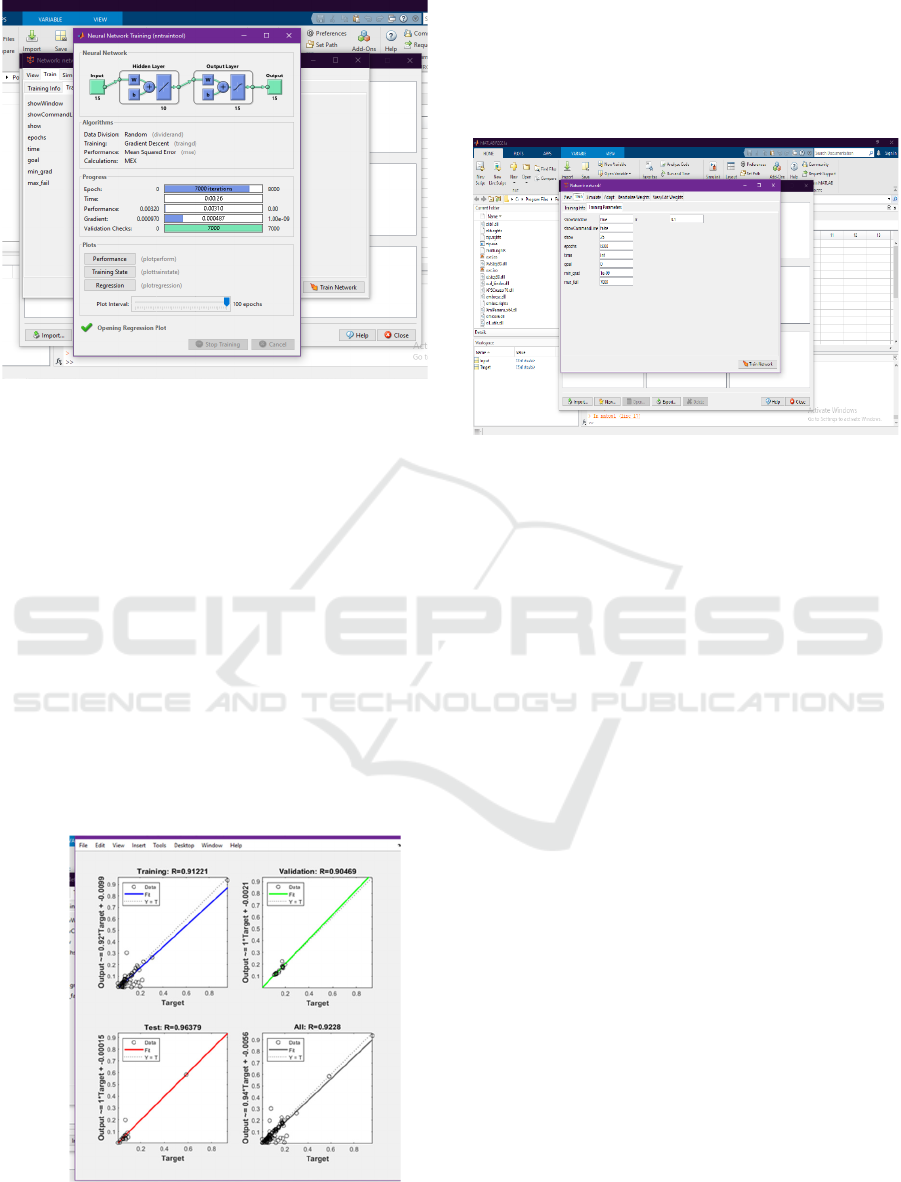
Figure 4: Best training and gradient with learning rate 0.1
and purelin activation function
Figures 3 and 4 show the best training and
gradients using ten hidden layers, learning rate 0.1
and binary sigmoid activation functions (logsig) and
purelin. In training with the best iteration with
conditions without isolation using the activation
function of binary sigmoids (logsig) and purelins,
binary sigmoids with a range of 0 to 1 while purelin
is a function of linearizing each input into its linear
value. The linear process will produce an input value
equal to the output value (y = x). These two activation
functions are commonly used for artificial neural
networks trained using the backpropagation method.
The identity activation function returns an MSE value
close to reaching the target. This is affected because
the input of the activation function is the same as the
output.
Figure 5: Regression of daily electricity use of high-rise
residential buildings
Figure 5 is a Regression of training results using
Hidden Layer 10, epoch 8000, and Learning Rate 0.1.
With a regression value of 0.91, the degree of
proximity between the training target and the training
result is very close.
Figure 6: Training Parameters
Figure 6 is the parameter used to perform JST
testing with the backpropagation method. The
parameters used are epochs 8000, learning rate 0.1,
min_grad 10-9, and max_fail 7000. Comparison table
and errors that what can obtain in the prediction of
daily electricity use in high-rise buildings: Based on
table 3, we can see that the results of predicting the
use of electricity in high-rise buildings calculate the
accuracy of the forecasting/prediction that has been
carried out, namely using calculations and analysis of
the Mean Absolute Percentage error (MAPE). Mean
Absolute Percentage error (MAPE) is the percentage
of the average error absolutely (absolute). The
definition of Mean Absolute Percentage Error is a
statistical measurement of the accuracy of forecasts
(predictions) on forecasting methods. The wider
community can use measurement using Mean
Absolute Percentage Error (MAPE) because MAPE
is easy to understand and apply in predicting
forecasting accuracy. The Mean Absolute Percentage
Error (MAPE) method provides information on how
much the forecasting error is compared to the actual
value of the series. The smaller the percentage error
value on MAPE, the more accurate the forecasting
results will be.
The Mean Absolute Percentage Error (MAPE) value
is analyzed:
Prediction of Daily Electricity Use in Residential High-Rise Buildings Using Artificial Neural Networks
297

Table 3: Comparison of electric power load forecasting in
high-rise residential buildings
Table 4: Range Mean Absolute Percentage Error (MAPE)
From the table above, we can understand the
range of values that show the meaning of the error
percentage value on MAPE, where the MAPE value
can still be used if it does not exceed 50%. If the
MAPE value is above 50%, then the forecasting
model cannot be used.
The calculation of the MAPE method is as follows:
𝑀𝐴𝑃𝐸
∑
1
𝐴
𝐹
𝐴
100
𝑛
Information
A
t
= Actual request to t
F
t
= forecasting result to t
N = magnitude of forecasting data
Where there is an absolute symbol in the MAPE
formula indicating that the negative value of the
calculation result will remain positive.
Table 4: Range Mean Absolute Percentage Error (MAPE)
𝑀𝐴𝑃𝐸
0.972491563
15
100 6.483 %
Based on the calculation results, it can be seen that
the MAPE value is 6.5%. This shows that the
prediction of electricity use in residential buildings
using the JST Backpropagation method has excellent
forecasting capabilities.
Table 5: Results of Predicted Electricity Consumption of
Residential High-Rise Building
From the results of the predicted data, it can be
concluded that the network can study the dispersion
of data based on 30 data used and 560 data patterns
used. The network can also find the optimal solution
to minimize cost functioning. The result of prediction
or forecasting for 15 days in the coming month is a
solution in this case, which is useful for
understanding the peak load in the upcoming month
so that you can determine how much energy will be
used.
5 CONCLUSIONS
Based on the training results using several
parameters, the best results for the testing and
prediction process were obtained, namely using
Hidden Layer 10, epoch 8000 and Learning Rate 0.1.
The results of calculating the MAPE value of 6.5%
show that the prediction of electricity use in
residential buildings using the JST Backpropagation
method has excellent forecasting accuracy
capabilities.
ISCP UTA’45 Jakarta 2022 - International Seminar and Call for Paper Universitas 17 Agustus 1945 Jakarta
298

REFERENCES
Arifah, N., Murnomo, A., & Suryanto, D. A. (n.d.).
Implementing Neural Network on Matlab for Forecast
of Electricity Load Consumption in Ponorogo Regency,
East Java.
Arya Hamidie, K. (2009). Energy coefficient method for
short-term load forecasting on the Balinese Madura
champion network. 1–10.
Eirene, H., & Sau, M. (2019). Textbook of Energy And
Electrical Power Operation ETAP Applications. CV.
Budi Utama.
Fayeldi, T., Murniasih, T. R., & Yunus, A. (2016). Basics
of Computer Programming Using MATLAB.
Jay, H. (2009). Operations Management (C. Sungkono
(ed.); 9th ed.). Salemba Four.
Khair, A. (2011). Term Electric Load Forecasting. 138.
Kuncoro, A. H., & R, D. (2005). Application of Artificial
Neural Networks for Long-Term Electric Power Load
Forecasting in Electrical Systems in Indonesia. Year
XIX, 3, 211–217.
Kusumadewi, S. (2004). Building artificial neural networks
(using MATLAB and Excel links) (F. W. Nurwiyati
(ed.); First Edition).
Marsudi, D., Generator, P., & Tobing, B. (2016). Gear
Tension crowbar. Generation of Electrical Energy, 7(1),
4–31.
Panjang, J., & Setiabudi, D. (2015). Electrical Load
Forecasting Information System. 1(1), 1–5.
Prasetyo, E., & Sahala, A. (2014). Data mining: processing
data into information using MATLAB. ANDI
OFFSET.
Rahman, A., Abdullah, A. G., & Hakim, D. L. (2012).
Long-Term Peak Load Forecast in Indonesia's
Electrical System Using adaptive neuro-fuzzy inference
system algorithm. Electrans, 11(2), 18–26.
Rohman, F. (2022). Electrical Load Prediction Using
Artificial Neural Networks Backpropagation Method.
JOURNAL OF SOLAR ENERGY, 5(2).
https://doi.org/10.32502/jse.v5i2.3092
RUPTL, P. P. 2021-2030. (2021). Electricity Supply
Business Plan (RUPTL) of PT PLN (Persero) 2021-
2030. Electricity Supply Business Plan 2021-2030,
2019-2028.
S. Haykin, S. (2009). Neural Networks and Learning
Machines. In Encyclopedia of Bioinformatics and
Computational Biology: ABC of Bioinformatics (3d
Edition, Vols. 1–3). Pearson Education, Inc.
https://doi.org/10.1016/B978-0-12-809633-8.20339-7
Setyowati, D., & Sunardiyo, S. (2020). Forecast of
Electrical Energy Needs with Artificial Neural Network
Backpropagation Method 2020-2025. In EECCIS
Journal (Vol. 14, Issue 1). https://jurnaleeccis.ub.ac.id/
Siang, J. J. (2009). Artificial Neural Network &
Programming Using Matlab (Kedu Edition). ANDI
OFFSET.
Stevenson, J. W. D. (1984). Elements of Power System
Analysis 4th Edition. In Power System Analysis (p.
365).
Sugiarto, & Harijono. (2000). Business Forecasting.
Gramedia Main Library.
Sulasno. (1993). Analysis of electric power systems (Cet.
1). Satya Discourse.
Sunardiyo, S. (2009). Load Flow Analysis Study of Electric
Power System Implementation on Electrical Network at
UNNES.
Yuan, O. D. P., Afandi, A. N., & Putranto, H. (2018).
TEKNO Journal of Electrical and Vocational
Technology The study of electrical load forecasting
using artificial neural network methods. In Department
of Electrical Engineering (Vol. 28).
http://journal2.um.ac.id/index.php/tekno
Zebua, F. Y., Mulyani, S. H., & H., M. E. (2012). Modelling
of Liver Cirrhosis Disease Detection using Artificial
Neural Networks. Sisfotenika, 2(2).
https://doi.org/10.30700/jst.v2i2.71
Prediction of Daily Electricity Use in Residential High-Rise Buildings Using Artificial Neural Networks
299
