
The System of Automated Diabetes Control
Vitalii L. Levkivskyi
1 a
, Galyna V. Marchuk
1 b
, Oleksandr V. Kuzmenko
1 c
and Anton Yu. Levchenko
2 d
1
Zhytomyr Polytechnic State University, Department of Computer Science, 103 Chudnivska Str., Zhytomyr, 10003, Ukraine
2
Zhytomyr Polytechnic State University, Department of Software Engineering, 103 Chudnivska Str., Zhytomyr, 10003,
Keywords:
Diabetes, Disease, Glucose, Insulin, Glycemia, Data Analysis, Insulin/Glucose Balance.
Abstract:
Modern information technology creates new opportunities for quickly obtaining information about the status
and trends of diseases such as diabetes. This paper considers the task of automating the collection and analysis
of data on the condition of a patient. The object of the research is information technology for creating mobile
applications and mathematical models for calculating the optimal insulin therapy. The aim of the work is to
analyze the incidence of diabetes and the development of a software product for man-aging blood glucose
levels. We developed a self-control diary which is the main functional feature of the system. It allows users to
quickly obtain in-formation about the state and trends of the disease. Based on the accumulated daily data, it
is possible to take the necessary actions on time to improve the disease course. In the process of development,
the database was designed and mathematical methods were used to analyze the data. The module of the
analysis of the collected data for the specific period is developed. The results of the analysis can be obtained
by the following indicators: the average glucose blood level, the number of glucose measurements, glucose
deviations, the number of basal insulin injections, the number of hypo/hyperglycemia, the amount of bolus
insulin. In our work we used object-oriented design techniques, document-oriented databases, modern web
technology stacks for mobile application development and design of interfaces. The result of solving the
given task is a system of accumulation and systematization of statistical data on the course of the disease.
An automated diabetes control system has been designed and developed. Mathematical models were used to
calculate the glucose/insulin balance. The developed software can significantly improve the living standards
of people with this disease. The system was tested by patients with diabetes.
1 INTRODUCTION
Diabetes mellitus, commonly known as diabetes, is
a chronic disease characterized by high blood glu-
cose level over a prolonged period of time. This
leads to serious problems in various systems of the
human body, especially nerve endings and blood ves-
sels. Diabetes is a dangerous complication that leads
to disability. In low- and middle-income countries,
the prevalence of diabetes is growing faster than in
high-income countries.
Diabetes is one of the leading causes of blindness,
kidney failure, heart attacks, strokes and lower ex-
tremity amputations. From 2000 to 2016, premature
a
https://orcid.org/0000-0002-1643-0895
b
https://orcid.org/0000-0003-2954-1057
c
https://orcid.org/0000-0002-4937-3284
d
https://orcid.org/0000-0002-4411-6465
mortality from diabetes increased by 5%. In 2019, di-
abetes be-came the ninth leading cause of death in the
world and is estimated to be the direct cause of 1.5
million deaths. According to the World Health Orga-
nization (WHO), the disease increases mortality by 2-
3 times and significantly reduces life expectancy. At
the same time, the number of patients increases annu-
ally in all countries by 5-7%, and doubles every 12-15
years (World Health Organization, 2022).
Diabetes is treatable. A healthy diet, regular phys-
ical activity, maintaining a healthy weight and ab-
staining from tobacco use can prevent or delay the on-
set of diabetes. The implementation of the mobile ap-
plication ”Automated Diabetes Control System” will
allow for more effective treatment, thereby improving
the course of the disease. Users will be able to keep
a diary of self-control, particularly to enter and edit
data of physical activity, taking medication and food;
view disease-based analytics based on input and sync
Levkivskyi, V., Marchuk, G., Kuzmenko, O. and Levchenko, A.
The System of Automated Diabetes Control.
DOI: 10.5220/0012009500003561
In Proceedings of the 5th Workshop for Young Scientists in Computer Science and Software Engineering (CSSE@SW 2022), pages 41-49
ISBN: 978-989-758-653-8; ISSN: 2975-9471
Copyright
c
2023 by SCITEPRESS – Science and Technology Publications, Lda. Under CC license (CC BY-NC-ND 4.0)
41

data with an application server.
2 PROBLEM STATEMENT
Diabetes is a disease whose main symptom is a con-
stant rise of blood sugar level. In the human body, the
pancreas is responsible for stabilizing blood glucose
levels, producing the hormones insulin and glucagon,
which in-crease or decrease glucose levels. However,
patients with diabetes have pancreas malfunction in
combination with low insulin sensitivity. This leads
to fluctuations in blood glucose levels, in particular to
the appearance of both hyperglycemia (high glucose
concentration) and hypoglycemia (low glucose con-
centration). Therefore, there is a need to find treat-
ments that can improve the living standards of people
with this disease.
The main purpose of our research is to analyze
the problem of diabetes and to develop an automated
control system. The defined purpose determines the
following tasks:
• to define the basic metrics and ways of their re-
ception for the development of the mathematical
module of the system;
• to design the structural components and algo-
rithms of the system;
• to develop an automated disease control applica-
tion.
3 REVIEW OF THE LITERATURE
The article “Global and regional diabetes prevalence
estimates for 2019 and projections for 2030 and 2045:
results from the International Diabetes Federation Di-
abetes Atlas, 9th edition” evaluates the prevalence of
diabetes in 2019 and forecasts for 2030 and 2045. The
study was conducted on 255 qualitative data sources
from 138 countries. Data was taken from adults aged
20-79 years for the period from 1990 to 2018, the
forecasts are not comforting (Saeedi et al., 2019). Ac-
cording to the IDF diabetes Atlas, the global preva-
lence of diabetes in 2021 is estimated at 10.5% (536.6
million people) and may increase to 12.2% (783.2
million people) in 2045 (Sun et al., 2022).
Saeedi et al. (Saeedi et al., 2020) estimated the
number of deaths related to diabetes among adults
aged 20–79. Diabetes is estimated to cause 11.3%
of deaths worldwide. Using a model that has only
one glucose compartment in its structure, the authors
conducted a number of simulations: taking into ac-
count the peculiarities of glucose absorption from the
intestine, they improved the procedure for detecting
latent forms of diabetes and analyzed the optimal in-
sulin therapy for an automated dispenser (Lapta et al.,
2014).
Levkivskyi et al. (Levkivskyi et al., 2020) are in-
vestigated the algorithms of data mining, which on
the basis of rules and calculations allow the creation
of a model that analyzes data by searching for cer-
tain patterns and trends. Through the study of data
mining algorithms, models and methods have been
developed to determine the impact of some chronic
diseases on others. The developed methods were im-
plemented in the system of intelligent data process-
ing. The conducted research testifies to the prospects
of using methods of data mining to improve the qual-
ity of medical care for patients.
The research conducted by Bolodurina et al.
(Bolodurina et al., 2020) aims to develop and numeri-
cally solve the problem of optimal glycemic control
in patients with type 1 diabetes mellitus by insulin
therapy based on the conditions of optimality for non-
smooth systems with constant delay in the phase vari-
able.
In the article by Karpel’ev et al. (Karpel’ev et al.,
2015) the basic mathematical models of the biological
control system of plasma glucose concentration are
presented.
Palumbo et al. (Palumbo et al., 2013) offers a
method focused on the most important clinical / ex-
perimental tests conducted to understand the mecha-
nism of glucose homeostasis.
The dynamic behavior of a mathematical model,
confirmed by experimental data, is studied by Trobia
et al. (Trobia et al., 2022) which takes into account
the relationship between glucose and insulin concen-
trations.
Shabestari et al. (Shabestari et al., 2018) presented
a new mathematical model to describe the interac-
tion between glucose, insulin and β-cells. The results
showed that the system shows different behaviors un-
der different conditions and is able to explain the in-
teraction between glucose, insulin and β-cells.
4 MATERIALS AND METHODS
4.1 Methods and Metrics for Modeling
an Automated Diabetes Control
System
To develop a system of automated control of diabetes,
it is necessary to define and implement methods for
collecting input data on the patient’s condition in real
CSSE@SW 2022 - 5th Workshop for Young Scientists in Computer Science Software Engineering
42

time. These data can be divided into two groups:
streaming and constant. Streaming data require reg-
ular input and include blood glucose, alcohol, carbo-
hydrates, weight, insulin, time and date, place of ad-
ministration, physical activity, stress and illness. The
constant data include such indicators as age, gender,
type of diabetes.
Some of these data can only be obtained by man-
ually entering it by a patient, others can be obtained
automatically. Information about blood glucose can
be obtained in two ways:
• after measuring blood glucose with a glucome-
ter. A patient can either enter data manually or
synchronize data with the system using Bluetooth
technology (if supported by the meter);
• with a continuous glucose monitoring system.
The monitor measures blood sugar every 10 sec-
onds and records the average value every 5 min-
utes.
After measuring the weight, the patient can either
enter the data or synchronize the data with the sys-
tem using Bluetooth technology (if supported by the
scale).
Information about physical activity has a differ-
ent nature of collection, one of which is the synchro-
nization of data from an external device such as a fit-
ness tracker – a gadget that, in most cases, is worn on
the hand and has built-in sensors that monitor activity
during the day, including: number of steps, heart rate,
sleep, calories burned, etc. An analogue of a fitness
tracker is data collection using an application installed
on the user’s smartphone, or the user can simply enter
data about daily activity manually.
If the data is entered manually, also the time and
date are required to be entered. If the data comes from
other devices or applications, it already contains time
and date information.
For developing the mathematical module of the
system metrics and methods for obtaining them were
determined.
Sokol et al. (Sokol et al., 2014) proposed the prin-
ciple of applying mathematical modeling to calculate
optimal insulin therapy. Bhonsle and Saxena (Bhon-
sle and Saxena, 2020) analyze various mathematical
models – despite the large number of mathematical
models, they are all based on one of two original
basic models: the model of the oral glucose toler-
ance test (OGTT) developed by Beaulieu in 1961 and
the model of the intravenous glucose tolerance test
(IGTT) by Bergman-Kobelli (Bergman et al., 1979).
The Beaulieu model is narrow in use, in particular,
it is generally unsuitable for describing the exponen-
tial decline of the glycemic curve of IGTT. The main
disadvantage of the IGTT model, in contrast to the
Beaulieu model, is that insulin is an input variable,
the value of which is determined clinically.
The mathematical model proposed by Shirokova
and Shirokov (Shirokova and Shirokov, 2006) is
based on the ratio of glucose balance and insulin con-
centration in human blood over a certain period of
time and improved by Bolodurina et al. (Bolodurina
et al., 2020).
Therefore, the experimental determination of
glycemic characteristics of insulin is as follows:
knowing the initial level of glucose in the blood, as
well as its integral characteristics, it is possible to
choose the right amount of insulin.
4.2 Design and Developing the
Algorithms of the System
For design and developing the automated diabetes
control system functional requirements were defined:
• User registration and authentication must be pro-
vided in the system;
• Data storage: the system must store information
and allow the user to manage it;
• Keeping a diary of self-control: entering and edit-
ing data of physical activity, medication and food;
• Analytics review: the system should provide the
ability to review analytics for the selected period.
The algorithm of the automated diabetes control
system is presented in figure 1. First, the user gets
to the authorization screen, if he is registered, he can
immediately pass it and get to the main screen. Oth-
erwise, it is necessary to go through the registration
process by filling out a standard form, the entered data
are checked for validity and entered into the appropri-
ate collection in the database.
Once on the home screen, the user can immedi-
ately view the statistics. The user can also go to
the screen with analytics, where the information for
a specified period is displayed. To work with entries,
the diary screen with the functions of viewing, adding,
deleting and editing entries is available. It is possible
to set user settings, medication and glucose level. The
data entered by the user when making changes to the
settings or when working with diary entries are en-
tered into the database.
On the main screen it is possible to add a new di-
ary entry by clicking on the correspondent button. On
the opened modal window with a form current time
and date are passed. After the user enters the data, val-
idation and synchronization with the database are per-
formed and the user is redirected to the home screen
The System of Automated Diabetes Control
43
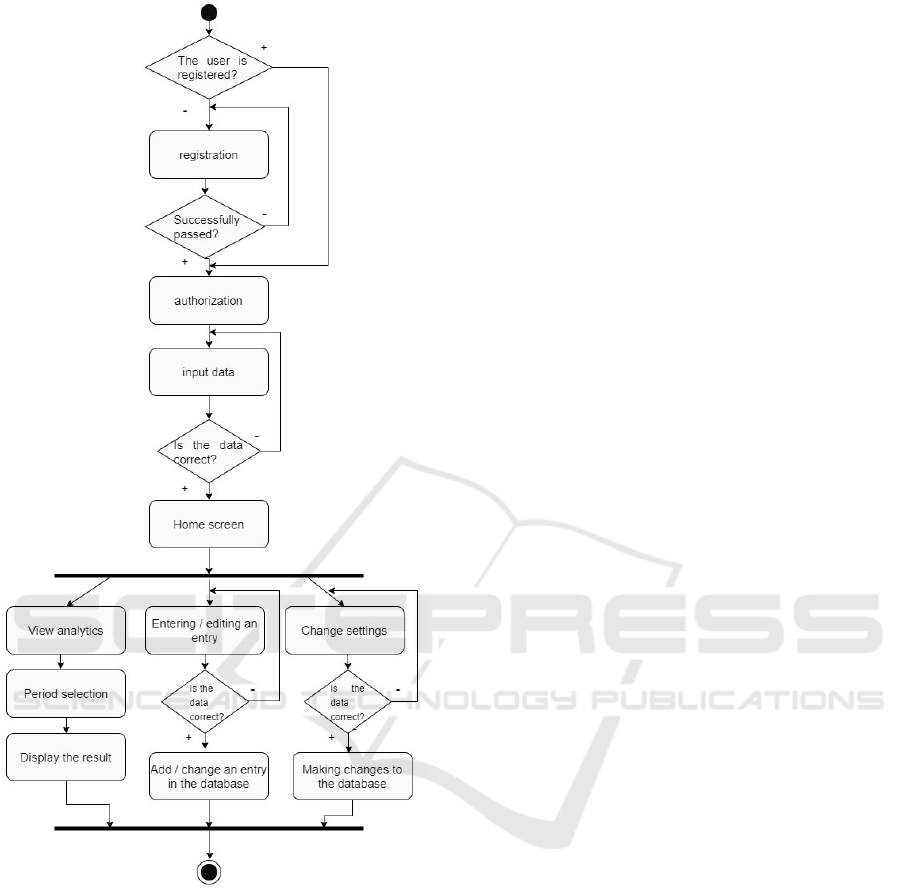
Figure 1: Activity diagram.
and methods are called to update the statistics based
on the entered data.
The analysis of functional requirements allowed
us to identify the following entities of the developing
process. Figure 2 shows a class diagram.
Some classes shown on the diagram are described
below.
• Home – a class of the main screen of the applica-
tion. It has the following methods: ionViewDid-
Load – this method starts after loading the screen
and initializes the methods for updating statis-
tics, updateStats – updating statistics for the week,
dailyStats – updating statistics for the day, pre-
pareStats – preparing statistics for the week, filter-
ByDate – filtering diary entries by date, newNote
– create a new diary entry, getFormatedDate, get-
Time – get the date and time, showHelp – display
help information.
• Diary – a class for work with the screen of the
system. It has the following methods: ionView-
DidLoad – this method is started after loading the
screen and initializes the methods for updating the
list of entries, editNote – editing the entry.
• NewNotePage – a class for work with the modal
window of adding and editing entries. Its meth-
ods – showDatePicker, showTimePicker – display
forms for selecting the date and time, add, edit and
delete for making corresponding operations with
entries.
• Analytics – a class for work with the analyt-
ics screen. It has the following methods: ion-
ViewDidLoad – it is called after loading the
screen and initializes methods for analytics up-
date, updateAnalytics, prepareReport (analytics
data preparation), filterByDate (filtering entries
by date), getFormatedDate, setFormatedDate,
showDatePicker (getting and setting dates, date
selection form correspondingly).
• Settings – a class for work with settings.
• Insulin-settings and Glucose-settings are classes
for work with medicine and glucose settings.
They have the following methods: ionViewDid-
Load – the method is called after loading the
screen and loads the settings, ionViewWillLeave –
the method is called before closing the screen and
saves the changes in the settings.
• Personal-settings – a class for work with per-
sonal set-tings. The class has the following meth-
ods: ionViewDidLoad, ionViewWillLeave, show-
DatePicker.
• Login is a class for the user authentication screen.
It has a method login for user authentication.
• Register is a class for the user registration screen.
It has a method register for new user registration.
• SettingsProvider – a class for working with user
set-tings in the database. Its methods: getSet-
tings – to get set-tings from the database, update-
Settings – to update the settings in the database,
addNewUserSettings – to create a document with
the settings of a new user.
• NotesProvider – a class for working with user di-
ary entries in the database. Its methods are get-
Notes – to load all user entries from the database,
addNewNote – to add a new entry to the database,
editNote – to update the entry in the database,
deleteNote – to delete the entry from the database.
CSSE@SW 2022 - 5th Workshop for Young Scientists in Computer Science Software Engineering
44
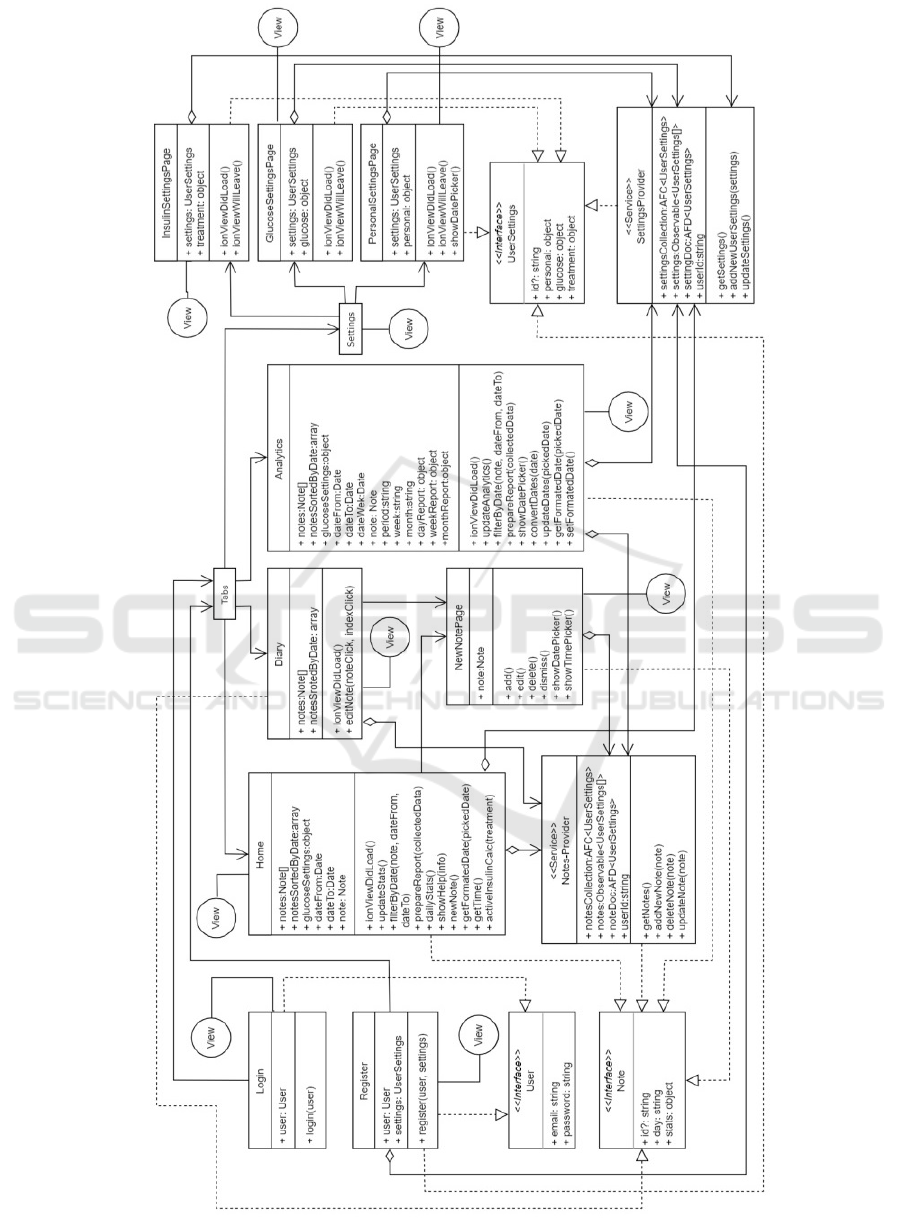
Figure 2: Class diagram.
The System of Automated Diabetes Control
45

Thus, the developed application has the function-
ality of making and editing entries in the system,
medicine selection, obtaining analytics, data synchro-
nization between devices, provided by the methods
of the components Home, Diary, NewNotePage, An-
alytics, Settings, Login, Register, Personal-settings,
Insulin-settings, Glucose-settings, SettingsProvider,
NotesProvider.
Functions in the class Analytics are used to per-
form analytics. The code snippet is below:
updateAnalytics() {
this.notesForAnalytics =
this.notesSortedByDate.filter(note =>
this.filterByDate(note,this.dateFrom,
this.dateTo));
let report;
let collectedData = {
noteCounter: 0,
glucoseCounter: 0,
glucoseSum: 0,
hiLowCounter: 0,
bolusInjectionCounter: 0,
basalUCounter: 0,
bolusUCounter: 0
}
this.notesForAnalytics.forEach(function
(noteScope, i, notes) {
noteScope.stats.forEach(function(note, i,
notesFromScope){
collectedData.noteCounter++;
if(note.stats.glucose){
collectedData.glucoseCounter++;
collectedData.glucoseSum +=
parseFloat(note.stats.glucose);
if(note.stats.glucose <
this.glucoseSettings.lowLevel
|| note.stats.glucose >
this.glucoseSettings.hiLevel){
collectedData.hiLowCounter++;
}
}
if(note.stats.bolus){
collectedData.bolusInjectionCounter++;
collectedData.bolusUCounter +=
parseFloat(note.stats.bolus);
}
if(note.stats.basal){
collectedData.basalUCounter +=
parseFloat(note.stats.basal);
}
}.bind(this));
report = this.prepareReport(collectedData);
if (i === 0){
if (noteScope.day === this.day) {
this.dayReport = report;
}
this.weekReport = report;
this.monthReport = report;
} else if ( i <= 6){
this.weekReport = report;
this.monthReport = report;
} else {
this.monthReport = report;
}
}.bind(this)); }
To store and access system information a database
was designed. It consists of three main collections
(User, UserSettings, UserNotes) (figure 3).
5 RESULTS
After starting the automated diabetes control system,
the login screen is shown, where the user must lo-
gin or register by clicking on the registration button.
After successful authentication the main screen is dis-
played (figure 4) with statistics of the main indicators
for the week and for the current day, namely: bolus
insulin per day, the amount of active bolus insulin at
the moment, the number of hypo/hyperglycemia for
the current day, average sugar level in seven days,
mean deviation of sugar in seven days and the amount
of hypo/hyperglycemia in seven days in percent. By
clicking on these indicators, the user can get reference
information (figure 4).
On the main screen there is a button to create
a new diary entry. By clicking on it a modal win-
dow with a form is opened. Navigation is carried
out through four tabs: Home screen, Diary, Analyt-
ics, Settings. On the screen of a diary (figure 5), all
entries sorted and grouped by date and time are dis-
played as rows of cards with entered metrics.
By clicking on any entry, a modal window is
opened to edit or delete the entry (figure 6). This
window has a form with all the necessary fields for
filling: medicine, food, activity, sugar level. The user
can also choose the time and date of the entry. In
editing mode of an entry, a button for deleting an en-
try appears in the navigation bar with a dialog box to
confirm the deletion of the record.
On the screen of analytics the user can choose the
desired period of a report, namely: one day, seven
days and thirty days. Also, the date can be specified
from which the data will be calculated (figure 7).
The screen with settings displays the user’s email
and a list of settings groups: personal settings,
glucose settings for adjusting glucose levels for
hypo/hyperglycemia, medication settings for choos-
ing medications. There is also a login button in the
navigation bar.
CSSE@SW 2022 - 5th Workshop for Young Scientists in Computer Science Software Engineering
46
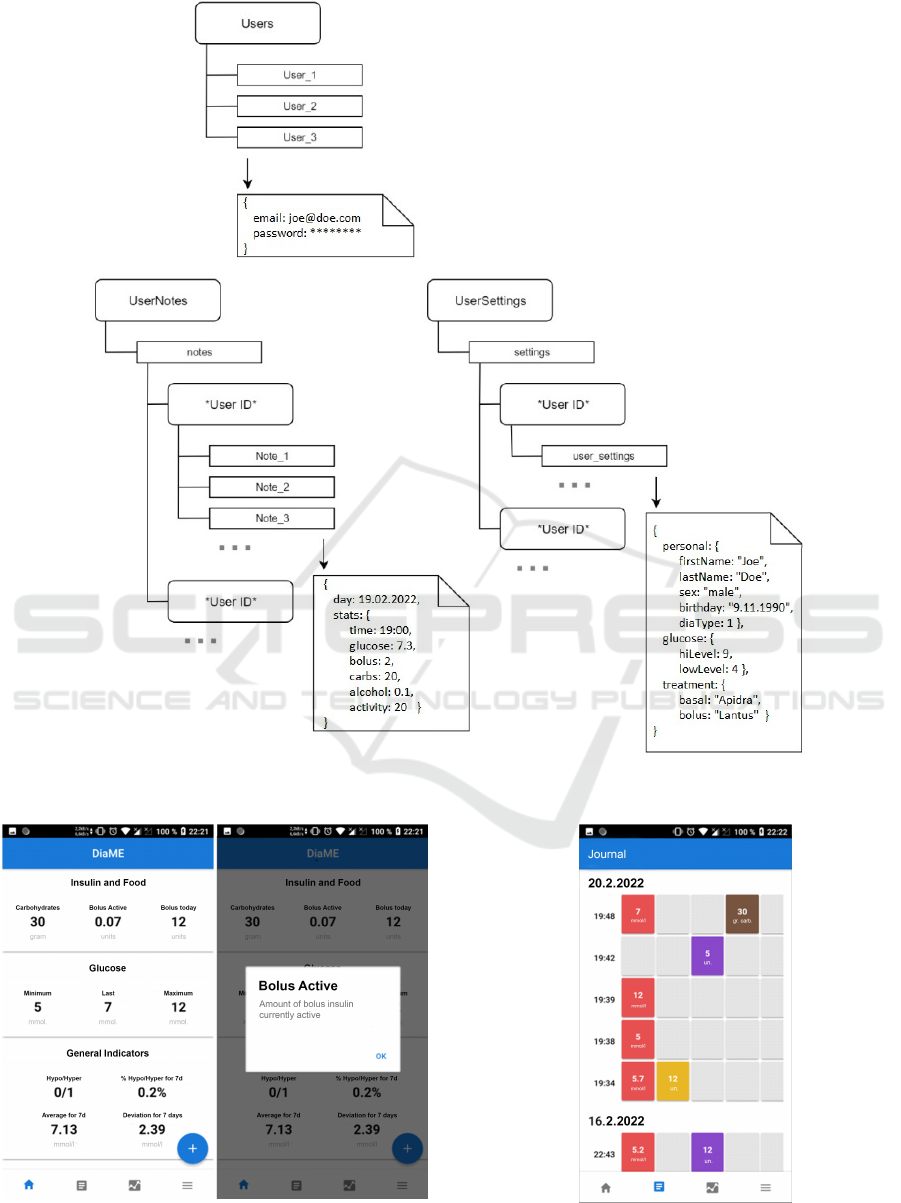
Figure 3: Database schema.
Figure 4: Home screen. Reference information.
Figure 5: The screen of a diary.
The System of Automated Diabetes Control
47

Figure 6: The forms for creating and editing entries.
Figure 7: The screen of analytics.
6 CONCLUSIONS
It is estimated that diabetes is the cause of one in nine
deaths among adults aged 20-79. Prevention of dia-
betes and its complications is important, especially in
middle-income countries, where the current impact is
estimated to be greatest (Saeedi et al., 2020).
As a result of the research, an analysis of the prob-
lem of diabetes was conducted. The basic metrics
and methods of production of these metrics for the
mathematical module of the system are determined.
The functional requirements for the automated dis-
ease control system were analyzed. Algorithms of the
system functions were defined and described, the or-
der of interaction of classes during the execution of
the programing code was determined and the system
of automated control of diabetes mellitus was devel-
oped.
In the process of development and testing, we con-
sulted with doctors and took into account their recom-
mendations. The system has received positive feed-
back from diabetes patients who continue to use it.
The developed software product is ready for use.
REFERENCES
Bergman, R. N., Ider, Y. Z., Bowden, C. R., and Cobelli, C.
(1979). Quantitative estimation of insulin sensitivity.
American Journal of Physiology-Endocrinology and
Metabolism, 236(6):E667. https://doi.org/10.1152/
ajpendo.1979.236.6.E667.
Bhonsle, S. and Saxena, S. (2020). A review on control-
relevant glucose–insulin dynamics models and regu-
lation strategies. Proceedings of the Institution of Me-
chanical Engineers, Part I: Journal of Systems and
Control Engineering, 234(5):596–608. https://doi.org/
10.1177/0959651819870328.
Bolodurina, I. P., Ivanova (Lugovskova), Y. P., and Antsif-
erova, L. M. (2020). Optimal Control of Glycemia
Regulation Dynamics in Patients with Type I Diabetes
Mellitus. Bulletin of the South Ural State Univer-
sity. Ser. Computer Technologies, Automatic Control,
Radio Electronics, 20(4):144–154. https://doi.org/10.
14529/ctcr200415.
Karpel’ev, V. A., Filippov, Y. I., Tarasov, Y. V., Boyarsky,
M. D., Mayorov, A. Y., Shestakova, M. V., and Dedov,
I. I. (2015). Mathematical Modeling of the Blood Glu-
cose Regulation System in Diabetes Mellitus Patients.
Annals of the Russian academy of medical sciences,
70(5):549–560. https://doi.org/10.15690/vramn.v70.
i5.1441.
Lapta, S. S., Pospelov, L. A., and Solovieva, O. (2014).
Computerized early diagnosis of diabetes mellitus by
methods of mathematical modeling. Vestnik NTU
KHPI, 36(1079):55–61. http://repository.kpi.kharkov.
ua/handle/KhPI-Press/9388.
Levkivskyi, V., Lobanchykova, N., and Marchuk, D.
(2020). Research of algorithms of Data Mining. E3S
Web of Conferences, 166:05007. https://doi.org/10.
1051/e3sconf/202016605007.
Palumbo, P., Ditlevsen, S., Bertuzzi, A., and De Gae-
tano, A. (2013). Mathematical modeling of the
glucose–insulin system: A review. Mathematical
Biosciences, 244(2):69–81. https://doi.org/10.1016/j.
mbs.2013.05.006.
Saeedi, P., Petersohn, I., Salpea, P., Malanda, B., Karu-
ranga, S., Unwin, N., Colagiuri, S., Guariguata, L.,
Motala, A. A., Ogurtsova, K., Shaw, J. E., Bright, D.,
and Williams, R. (2019). Global and regional dia-
betes prevalence estimates for 2019 and projections
for 2030 and 2045: Results from the International
Diabetes Federation Diabetes Atlas, 9
th
edition. Di-
abetes Research and Clinical Practice, 157:107843.
https://doi.org/10.1016/j.diabres.2019.107843.
CSSE@SW 2022 - 5th Workshop for Young Scientists in Computer Science Software Engineering
48

Saeedi, P., Salpea, P., Karuranga, S., Petersohn, I., Ma-
landa, B., Gregg, E. W., Unwin, N., Wild, S. H., and
Williams, R. (2020). Mortality attributable to dia-
betes in 20–79 years old adults, 2019 estimates: Re-
sults from the International Diabetes Federation Dia-
betes Atlas, 9
th
edition. Diabetes Research and Clin-
ical Practice, 162:108086. https://doi.org/10.1016/j.
diabres.2020.108086.
Shabestari, P. S., Panahi, S., Hatef, B., Jafari, S., and
Sprott, J. C. (2018). A new chaotic model for glucose-
insulin regulatory system. Chaos, Solitons & Frac-
tals, 112:44–51. https://doi.org/10.1016/j.chaos.2021.
111753.
Shirokova, N. A. and Shirokov, I. V. (2006). Mathematical
model of the balance “glucose – insulin – glucagon” in
human blood. Bulletin of Omsk University, (3):51–53.
https://tinyurl.com/5dsampk5.
Sokol, E. I., Lapta, S. S., Pospelov, L. A., and Solovieva,
O. I. (2014). Raschet rezhimov insulinoterapii
na osnove ma-tematicheskogo komp’juternogo mod-
elirovanija. Visnik NTU ”HPI”, 36(1079):61–66. http:
//repository.kpi.kharkov.ua/handle/KhPI-Press/9389.
Sun, H., Saeedi, P., Karuranga, S., Pinkepank, M.,
Ogurtsova, K., Duncan, B. B., Stein, C., Basit, A.,
Chan, J. C., Mbanya, J. C., Pavkov, M. E., Ramachan-
daran, A., Wild, S. H., James, S., Herman, W. H.,
Zhang, P., Bommer, C., Kuo, S., Boyko, E. J., and
Magliano, D. J. (2022). IDF Diabetes Atlas: Global,
regional and country-level diabetes prevalence esti-
mates for 2021 and projections for 2045. Diabetes
Research and Clinical Practice, 183:109119. https:
//doi.org/10.1016/j.diabres.2021.109119.
Trobia, J., de Souza, S. L. T., dos Santos, M. A., Szezech,
J. D., Batista, A. M., Borges, R. R., da S. Pereira,
L., Protachevicz, P. R., Caldas, I. L., and Iarosz,
K. C. (2022). On the dynamical behaviour of a
glucose-insulin model. Chaos, Solitons & Frac-
tals, 155:111753. https://doi.org/10.1016/j.chaos.
2021.111753.
World Health Organization (2022). Diabetes. https://www.
who.int/news-room/fact-sheets/detail/diabetes.
The System of Automated Diabetes Control
49
