
Open Channel Flow with Three-Layered Vegetation: Effect on the
Velocity Distribution of Flow
Xiaonan Tang
a
, Jiaze Cao, Yutong Guan, Yihong Liu, Kangping Xiong, Shilin Niu and Sen Guo
Department of Civil Engineering, Xián Jiaotong-Liverpool University, 111 Renái Road, SIP, Suzhou, China
Keywords: Vegetated Flow; Triple-Layered Vegetation; Downstream Velocity Distribution; Velocity Profile.
Abstract: Aquatic vegetation is widespread in rivers and influences their hydraulic characteristics. Due to individual
differences from a biological point of view, the vegetation of different heights always coexists in nature. The
attention on vegetation flow studies has shifted from the previous single-layer vegetation to more complex
cases such as double- or triple-layer vegetation. Although only a limited number of studies on two-layer
vegetation flow have shown that different vegetation heights have a significant effect on flow structure under
partially submerged conditions, the effect of multi-layer vegetation on flow is unclear. In this regard, we
conducted a novel experiment with triple-layered vegetation with all vegetation heights (10, 15 and 20 cm)
under fully submerged conditions. A micro propeller velocimeter was used to measure the velocity at various
locations in the downstream cross-section of the channel, including the positions behind short and tall plastic
dowels. The measured results showed that the vertical velocity distribution was strongly influenced by
vegetation height and its distribution. The observed data also showed differences in velocity directly behind
vegetation and in the area behind the vegetation gap. Typically, the velocity profile has a similar profile, with
almost a constant velocity from the bed to the height of about 0.75 of the short vegetation height and then a
slight increase to the height of the middle vegetation. Afterwards, the velocity rises fast to the water level,
where the reflection can be observed. This novel experiment reveals the effect of multiple layers of vegetation
on water flow. It would also contribute to the significance of this vegetation configuration and further research
on open channel flow in complex vegetation environments.
1 INTRODUCTION
Vegetation is an essential component of natural river
ecosystems, which can be exploited in river
engineering to meet hydraulic and ecological
requirements (Naiman et al. 1993; Curran & Hession,
2013; Rowiński et al., 2018). Previous experimental
and analytical studies have shown that vegetation can
affect vertical flow distribution, fluid resistance,
Reynolds stress and lateral flow variation in open
channels with single-layered vegetation (Follett and
Nepf, 2012; Tang et al., 2011; Tang et al., 2013a;
Tang et al., 2019a, 2019b; Yang et al., 2020; Box et
al. 2021). Recently, several studies have focused on
channel flow with double-layered vegetation, which
is more complex situation that creates strong vortices
in the interaction zone between the vegetation of
different heights (Tang et al. 2018; Singh et al., 2019;
Rahimi et al., 2020a; Tang et al., 2021b). The velocity
a
https://orcid.org/0000-0002-2434-9341
distribution in channels with multiple layers of
vegetation has received particular attention. Tang et
al. (2022) experimentally investigated the effect of
partially-submerged triple-layered vegetation on the
velocity characteristics of fluids in open channels.
The measured velocity profiles showed that the triple-
layered vegetation added a significant resistance to
the fluid, and the effect of high vegetation on velocity
was more significant than that of the short one.
Nevertheless, the study by Tang et al. (2022) was
based on partially inundated conditions and may not
be suitable for some situations, e.g., researchers in
freshwater ecosystems have found that reusing
inundated vegetation is an advance and feasible
approach to clean up water bodies and address
eutrophication (Chao et al., 2022). In addition, Tang
et al. (2021a) have also found that higher inundation
rates lead to increased velocity profile gradients in
areas of high and low vegetation interactions.
Tang, X., Cao, J., Guan, Y., Liu, Y., Xiong, K., Niu, S. and Guo, S.
Open Channel Flow with Three-Layered Vegetation: Effect on the Velocity Distribution of Flow.
DOI: 10.5220/0012016800003536
In Proceedings of the 3rd International Symposium on Water, Ecology and Environment (ISWEE 2022), pages 287-293
ISBN: 978-989-758-639-2; ISSN: 2975-9439
Copyright
c
2023 by SCITEPRESS – Science and Technology Publications, Lda. Under CC license (CC BY-NC-ND 4.0)
287
Therefore, it is of great importance to understand the
effect of multiple layers of vegetation on water flow
under fully submerged flow conditions.
In this study, three layers of vegetation, a set of
short, medium, and tall dowels, were placed orderly
at the bottom of an inclined flume, and the experiment
was set to a flow depth of 26 cm with all dowels
submerged. Velocities were measured at different
locations across the channel using a propeller
velocimeter. This research was particularly focusing
on the downstream section, since which is the area
most hydrological issues occur, such as flooding,
water pollution, and eutrophication (Scheumann et
al., 2011).
2 EXPERIMENTAL APPARATUS
AND SETTING
In order to mimic vegetation of different heights in
real water environments, this experiment was
conducted at Xi'an Jiaotong Liverpool University
(XJTLU) with a rectangular cross-section of 0.4 m
wide and 0.5 m high, a water depth of 26 cm, and a
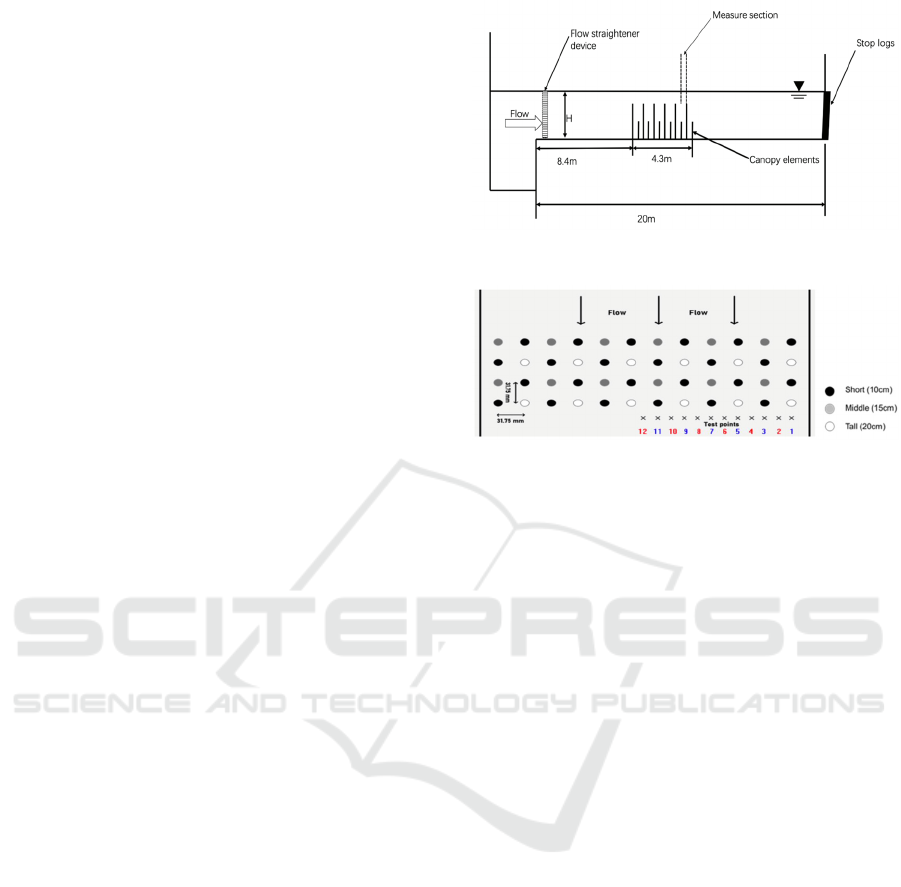
bed slope of 0.003 (Tang et al. 2021). A sketch of the
flume is shown in Figure 1, which has a 4.3 m long
vegetated segment, starting 8.4 m from the entrance
to the flume. Three different heights (10, 15, and 20
cm) of round plastic dowels were installed in the
vegetated area, with each having a diameter of 6.35
mm. All dowels were arranged linearly, as shown in
Figure 2. Each row was a staggered arrangement of
short and medium or tall dowels. The spacing
between two adjacent dowels was 31.75 mm.
There were 12 measurement points in the
downstream area of vegetation, as indicated by the
symbol cross (x) in Figure 2. At each location, the
flow velocity at 23 points above the bed was
measured with a micro propeller velocimeter to
obtain the vertical distribution of velocity. The
sampling time for velocity measurements was set to
20 seconds twice to ensure the accuracy of velocity.
Measurements were made at the downstream section
behind the row of the short and tall dowels (10 and 20
cm), respectively. At a flow depth of 26 cm, the
discharge of the open channel was 27.15 l/s; thereby
all short, middle, and high vegetation was completely
submerged.
Figure 1: The sketch of the experimental flume.
Figure 2: The layout of vegetation array and measurement
locations in the downstream zone.
3 RESULTS AND DISCUSSION
3.1 Velocity Profiles Directly Behind
Vegetation
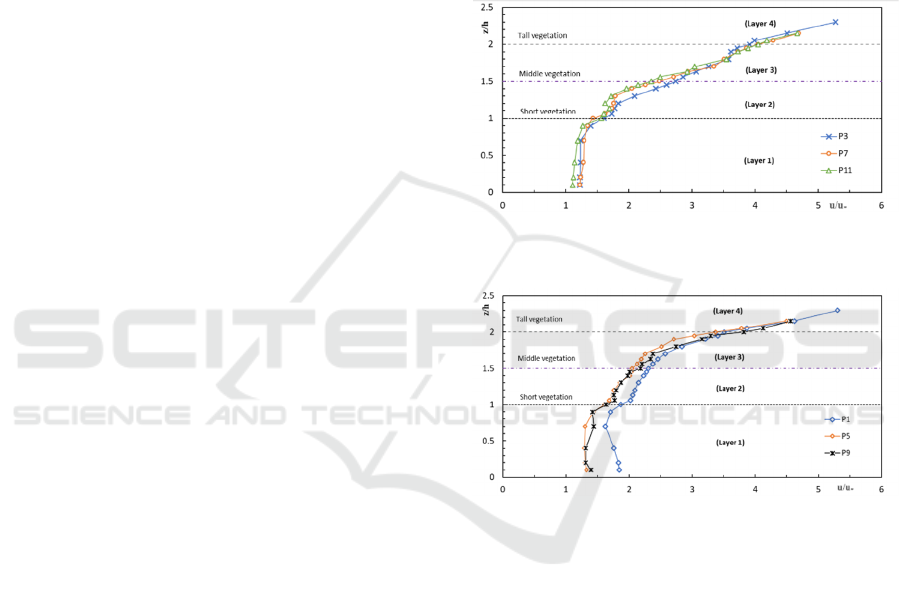
Figure 3 presents the velocity results for group A
(positions 3, 7 and 11, all behind short vegetation),
while Figure 3 illustrates the velocity profiles for
group B (positions 1, 5 and 9, all behind tall
vegetation). Note that u is the streamwise velocity, u
*
is the shear velocity, and h is the height of short
vegetation, z is the vertical distance above the bed in
all subsequent figures. The velocity profiles
demonstrate a distinct vertical variation.
As shown in Figure 3, in the low zone near the
bed (layer 1) where z/h is less than or equal to 1, the
flow velocity does not change greatly in the vertical
direction. It is noted that although there exist certain
minor decreases in flow velocity at these locations,
the magnitude of the changes is minimal (less than
10%) and can be taken as an allowable margin of
error. In the intermediate region (layer 2: 1 < z/h <
1.5), i.e., the region between the short vegetation and
the middle vegetation, the variation of flow velocity
is similar for the three positions: the flow velocity
gradually increases with height until about z/h = 1.25,
which seems to be a velocity inflection point. This S-
shaped velocity profile in this region has also been
found in studies of double-layered vegetation
(Rahimi et al., 2020b; Tang et al., 2021b), indicating
ISWEE 2022 - International Symposium on Water, Ecology and Environment
288
a steady slope of the curve at about 0.5 (u∕(u
*
))/(z∕h).
In the upper region (including layers 3 and 4), the
velocity steadily rises to the water surface starting
from a certain distance below the top of the middle
vegetation (about z/h = 1.25). Meanwhile, the range
of velocity variation was greater, and the rate of
change was larger in comparison with the other layers
(layers 1 and 2). In general, the velocity profile of
group A shows a typical -shaped curve with a small
increase in velocity in the lower layer, followed by a
transition at z/h = 1.25 and then a rapid increase up to
the water surface, which is consistent with the
findings of the other two layers of vegetative flow
(Rahimi et al., 2020b; Tang et al., 2021b).
For the velocity profile of Group B (Figure 4), the
overall profile does not differ much from that of
Group A, but the main difference is in the
intermediate layer (layer 2.) The velocity range rate
of Group B is larger in layer 2 than that of Group A,
indicating that the taller vegetation in Group B seems
to penetrate the flow more deeply. In addition, it can
be found that in the lower layer (layer 1), the velocity
of group A is generally smaller than that of group B
with an amplitude of about 29.4%. Moreover, when
the height of the middle vegetation is reached, there
is a transcendence between the two data sets (2.8 vs
2.25 in velocity).
Finally, when the water surface exceeds the
height of the maximum vegetation, the flow velocity
of the channel remains the same, about 4.5-5.5 for
group A and 3.5-3.8 for Group B; thus, we may draw
the following points:
• The vegetation in the water has a decreasing effect
on the flow velocity. The higher the depth from
the vegetation, the faster the velocity of the water
layer. The water layer beyond the vegetation-
occupied area shows the free surface flow and is
less influenced by vegetation.
• For the velocity profile behind the short
vegetation, the velocity beyond the vegetation
height rises rapidly (i.e., the velocity starts to rise
faster when z/h exceeds 1) and finally reaches a
stable value; however, for the velocity behind the
tall vegetation, it begins to increasease rapidly
after z/h = 2. Finally, the same stable value is
reached.
In addition, the side walls of the channel influenced
the flow velocity profile. Behind the tall vegetation
(group B, Figure 4), the velocity data (z/h<2) show
that the fastest velocities are found near the wall (P1)
than at other locations (P5 and P9) closer to the centre
of the channel. Nevertheless, the velocity in the outer
layer (or the free flow, z/h>2) is not influenced by the
wall. For the flow velocities in group A (behind short
vegetation, Figure 3), the effect of the wall seems to
be somewhat different in the upper layers: (a) just
below the top of the tall vegetation (z/h=1-1.8), the
flow velocities near the side wall (P3) are greater than
those near the centre of the channel (P11); (b)
However, above the tall vegetation, the flow
velocities change in the opposite direction, i.e., the
velocities are smaller near the side wall, indicating
that the side wall has certain blocking effect.
However, velocities away from the wall are less
influenced by the wall boundary but are dominated by
the vegetation.
Figure 3: Velocity profiles directly behind the short
vegetation (Group A).
Figure 4: Velocity profiles directly behind the tall
vegetation (Group B).
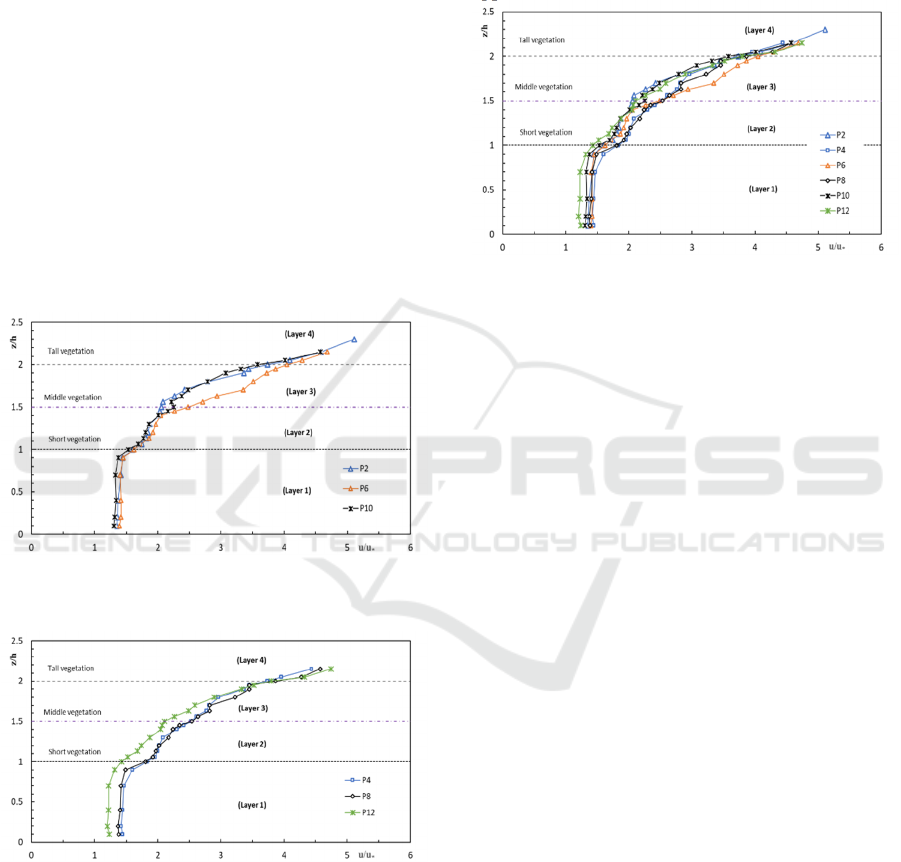
3.2 Velocity Profiles behind the Gap of
Vegetation
To better understand the lateral variation of velocity
profiles behind vegetation gaps (P2, 4, 6, 8, 10, 12),
these positions were divided into two groups. Group
C includes P2, P6, P10 (i.e., behind the gap between
tall and short vegetation), while group D includes P4,
P8, P12 (i.e., behind the gap between short and tall
vegetation).
According to Figure 5 (group C), in layer 1
(z/h<1), the velocity profiles of P2, P6 and P10 are
almost identical and do not have significant variation.
In layer 2 (1<z/h<1.5), the velocity gradually
increases with depth, showing a position-independent
profile. However, in layer 3 (1.5<z/h<2), the velocity
of P6 is significantly greater than the other two
Open Channel Flow with Three-Layered Vegetation: Effect on the Velocity Distribution of Flow
289
positions (P2 and P10), which are nearly identical. In
the layer near the water surface (z/h>2), all velocities
are close to a single profile. In general, the velocity
profile exhibits a -shape, although the upper end of
the curve may have different growth rates, depending
on the position. It appears that the growth of velocity
is more linear at position (P6) because the sidewall
less influences it.
Regarding the flow velocity profile of group D
(Figure 6), it generally indicates a similar flow
velocity profile to that of group C. However, within
the vegetative layer (z/h<2), the flow velocity of P12
(in the centre of the channel) is smaller than that of
P4 or P8 (which are identical), due to the effect of the
asymmetric distribution of vegetation. Above the tall
vegetation (layer 4, z/h>2), the velocity of P12
becomes larger than that of both P4 and P8, and their
difference becomes smaller. This result may be due to
a certain blocking effect of the sidewalls on P8 and
P4 (more as closer to the wall).
Figure 5: Velocity profiles behind the gap of vegetation
(Group C).
Figure 6: Velocity profiles behind the gap of vegetation
(Group D).
To compare the differences in the velocity profiles
between the two groups, all data for the 6 positions
are shown in Figure 7. It was found that the velocity
profiles have a similar trend. In the bottom layer (z/h
< 1), the velocity remains almost constant, although
P12 (at the centre) has the smallest value. However,
in the intermediate layer (1<z/h<1.5), the velocity
increases gradually with a similar growth rate, and
P12 has the smallest velocity, while P2 (near the
sidewall) has the highest velocity. As the flow depth
increases, the velocity in the upper layer (z/h > 1.5)
increases rapidly until the water surface and
approaches a curve.
Figure 7: Velocity profiles behind the gap of vegetation for
all positions.
In summary, vegetation has a retarding effect on
the flow through the gap of vegetation. The flow
velocity significantly reflects near the edge of the
vegetation, but the velocity is least affected by the
vegetation in the flow area above the tall vegetation.
When z/h<1, the flow velocity is dominated by the
vegetation, resulting in slight vertical variation in
velocity because large drag force of vegetation.
However, in the vegetated area (1 < z/h < 2), the flow
velocity starts to increase gradually (in the densely
vegetated area) and then increases rapidly (in the less
densely vegetated area). When z/h>2, the free flow
area where the velocity changes the most, and finally
the velocity reaches a stable value near the free
surface. According to Figure 6, the velocity profile of
P12 is smaller than the other locations (P4 and P8)
when z/h<1.75, between P4 and P8 in the range
1.75<z/h<2, and larger than P4 or P8 when z/H>2. In
fact, the velocity profiles of P8 and P4 are almost
indistinguishable when z/h<2. At approximately
z/h=2.15, the velocity profile of P8 is slightly larger
than that of P4 but smaller than that of P12. It
indicates that in the area above the tall vegetation
(z/h>2), the velocity profile near the wall is smaller
than that away from the wall. It can also be seen from
Figure 7 that the velocity profile near the wall is
greater than that far from the wall when z/h>2.15,
while in the upper vegetation layer (z/h>1.5), the
water velocity at P6 is greater than at any other
location (e.g., P2 and P10).
ISWEE 2022 - International Symposium on Water, Ecology and Environment
290
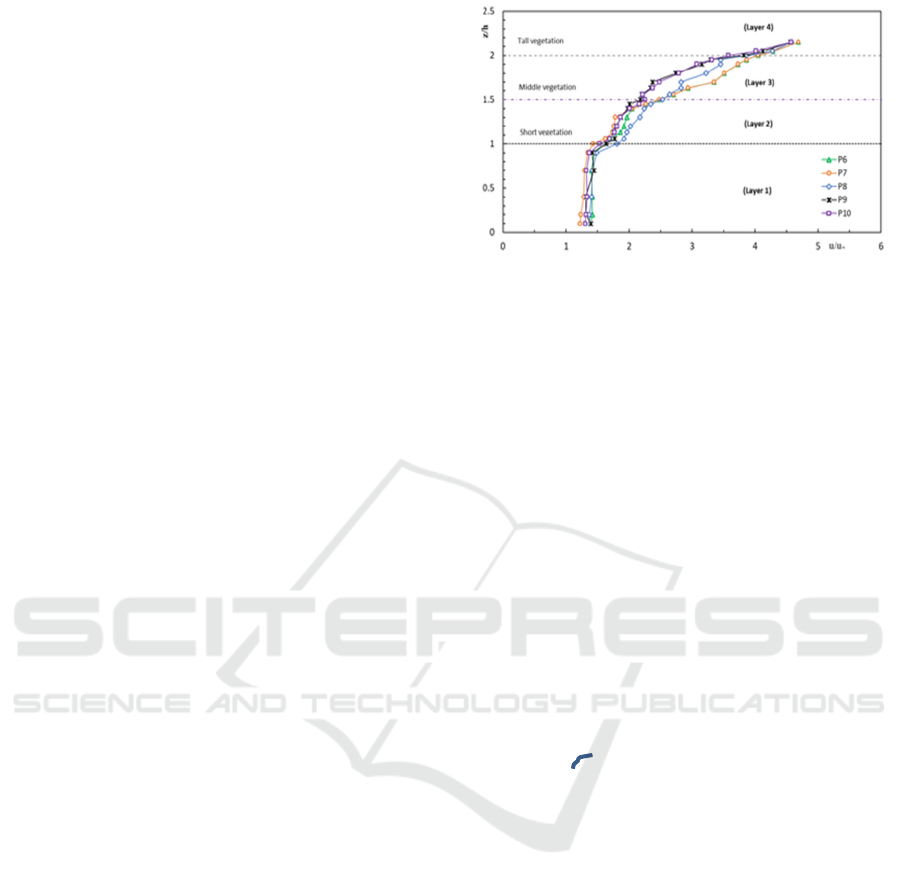
3.3 Comparison of Velocity Profiles at
Various Locations Behind
Vegetation
To investigate how vegetation affects the velocity
profiles at different locations behind the vegetation,
Figure 8 compares the velocity profiles at locations
far from the wall (i.e., P6-P10). Since they are
positioned at a certain distance from the wall, the
effect of the wall can be considered minimal and
negligible here.
In the bottom region of the channel (z/h<1), the
velocity was affected by the three different heights of
vegetation, with a similar pattern of velocity changes:
the velocity remained almost constant below the short
vegetation (although there were some slight
fluctuations, this small difference can be considered
as a type of measuring error in the experiment).
Furthermore, at about the 0.9h height, the velocity
starts to increase rapidly to the top of the short
vegetation. In terms of flow directly behind and
through the vegetation gap, the flow velocity behind
the vegetation gap was greater than that directly
behind the vegetation, although the difference was
small. This result is consistent with the results of
other studies (e.g. Rahimi et al., 2020b).
In the flow zone of z/h>1, the velocity has
increased rapidly and continued to the water surface.
It is inferred that the flow in the intermediate layer
(1<z/h<1.5) is more affected by overlaid vegetation
(middle and tall), and the increase of velocity is
relatively slow. The difference from the previous part
is that with the increase of height, the offset of the
flow velocity offset directly behind the vegetation
gradually decreases or even disappears. For example,
the flow velocity at P8 is greater than that at P7, but
as the height increases, the velocity at P7 gradually
becomes larger than that at P8. Therefore, this
phenomenon may be explained as a result of the
density of vegetation, which gradually shifts to a
regular pattern affected by the wall alone.
Furthermore, the flow velocity was greater at P7
(behind short vegetation) than at P9 (after high
vegetation). The reason may be that in the upper
layer, because P7 is not directly affected by
vegetation (height is above the short vegetation), it
will have a larger flow velocity than P9, which is
directly affected by the middle and tall vegetation.
Meanwhile, this also results in the reduction of
velocity.
Figure 8: Comparison of velocity profiles at various
positions behind the vegetation.
3.4 Comparison of Mean Velocity
Profiles at Various Positions
Behind Vegetation
In order to reveal the changes of averaged velocity
profiles at some typical locations, this section aims to
compare the combined effects of a group of
vegetation on averaged velocity profiles across a
channel section, as shown in Figure 9. BST represents
the averaged profile of P1, 5 and 9 (behind the tall
after short vegetation). BMS denotes the averaged
velocity profile value at P3, P7 and P11 (behind the
short after middle vegetation). SM represents the
averaged value of velocity profiles at P2, P4, P6, P8,
and P10 (behind the gap of tall and short vegetation).
Figure 9 demonstrates significant differences in
the averaged velocity profile at some typical locations
(BST, BMS and SM): The overall averaged velocity
profile is a ‘ ’ type, i.e., the velocity changes small
in the bottom region up to 0.9h, and then increases
quickly near the top of short vegetation (i.e. z/h =1),
where the strong vertical exchange of flow takes
place; then the velocity increases gradually in the
intermediate region (1<z/h<1.5) and continues fast to
the water surface. It was found that when z/h < 1.3,
the flow velocity of BMS is smaller than that of BST
and SM. Nevertheless, when z/h > 1.3, the flow
velocity change of BMS is faster and becomes larger
than that of BST and SM. The velocity profiles of
BMS, BST and SM are similar in the layer below
z/h=1.4, which is the turning point; afterwards, the
velocity of BST is accelerated and finally reaches the
highest value near the water surface (z/h = 2.2), where
the velocity of BMS and SM approaches.
Open Channel Flow with Three-Layered Vegetation: Effect on the Velocity Distribution of Flow
291
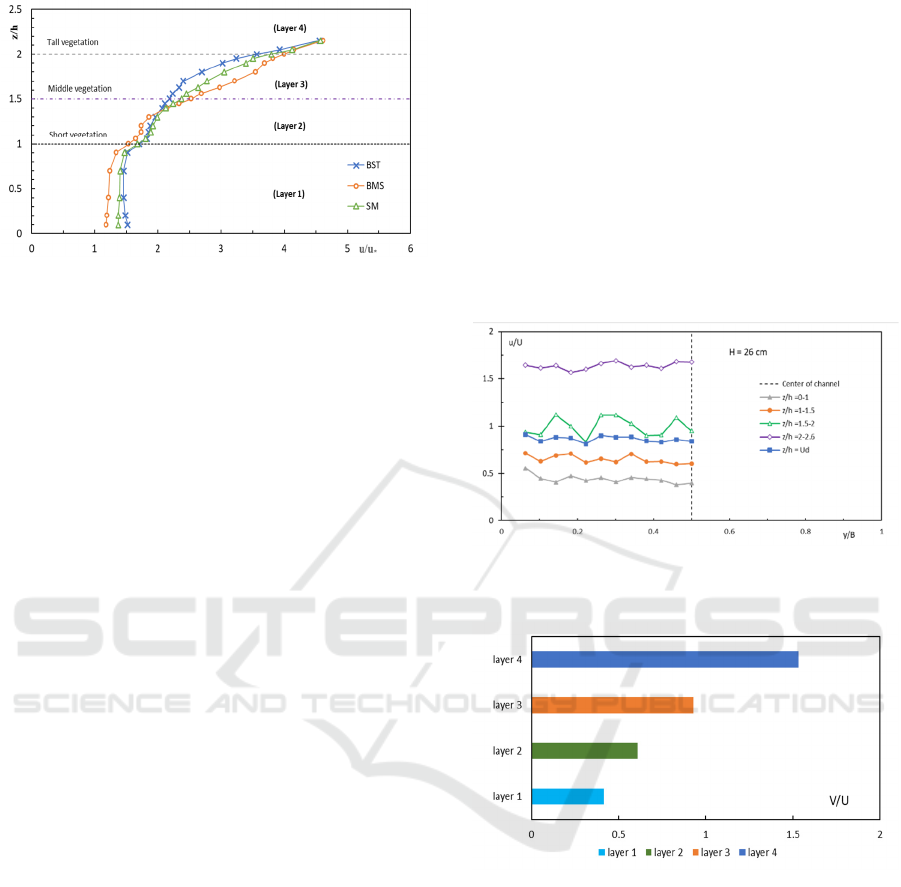
Figure 9: Lateral variation of averaged velocity profiles.
3.5 Lateral Variation of
Layer-Averaged Velocity
The layer-averaged and depth-averaged velocities can
be obtained from the measured velocity vertical
distribution. Figure 10 shows the lateral variation of
the layer-averaged and depth-averaged velocities for
a half channel. Note that in Figure 10, z/h=Ud denotes
the depth-averaged velocity, whereas the others
denote the layer-averaged. In general, the velocity at
the position directly behind the vegetation (odd-
numbered position) is smaller than the velocity at the
centre position behind the vegetation gap (even-
numbered position). However, for the locations close
to the sidewalls (P1 and P2) the velocities do not
appear to conform to the above results, indicating the
effect of walls. The velocities at the even-numbered
locations near the sidewalls are slightly smaller than
the velocities at the odd-numbered points. Thus, it
may be inferred that the wall has certain influence on
the flow velocity. In addition, contrary to the previous
results, in the vegetation-covered area (the first to
third layer), there is a tendency for the depth-averaged
velocity to decrease slightly towards the centre of the
channel, although the surface layer (above the tall
vegetation) is almost unchanged in the lateral
direction.
It is noted that in the middle layer (layer 3, 1.5 <
z/h < 2), i.e., in the area between the middle and tall
vegetation, the variation of layered-velocities is
particularly complex and fluctuating. Similar to the
analysis in the previous sections, the layer-averaged
velocities at P3, P7, and P11 are larger than at any
other position. This result may be due to the fact that
all three locations are directly behind the short
vegetation, thus making their flow velocities less
influenced by the middle and short vegetation
upstream (offset only by the tall vegetation). While at
P1, P5, and P9, their layered velocities are
considerably influenced by the tall vegetation
upstream, thus resulting in smaller flow velocities.
Besides, Figure 11 shows that the averaged layer
velocity increased with increasing flow depth,
indicating that the lowest velocity was found near the
bed (layer 1) and the highest velocity in the upper
layer (layer 4). The averaged velocity of each layer is
directly related to the vegetation density in the
corresponding layer. Layer 1 has the lowest velocity,
corresponding to the highest vegetation density,
leading to the lowest velocity. Layer 4 behaves as a
free-flowing layer (not directly influenced by any
height vegetation), leading to the maximum velocity.
Figure 10: Lateral variation of layer- and depth-averaged
velocity.
Figure 11: Averaged velocity (V) of each layer for the half
channel. Note: U is the cross-sectional mean velocity of the
channel.
4 CONCLUSIONS
A novel experiment was conducted to investigate the
effect of fully submerged triple-layered vegetation on
the flow in an open channel. Detailed flow velocities
were measured using micro propeller velocimetry at
different locations across a downstream section of the
channel. The overall velocity profile has shown that
the flow velocity increased with increasing flow
depth, which was significantly different from the
logarithmic law of velocity in open channels without
ISWEE 2022 - International Symposium on Water, Ecology and Environment
292

vegetation. More specifically, flow velocities were
relatively small and almost constant near the channel
bed up to 0.4 z/h (a position slightly below the top of
short vegetation), and then increased consistently to
1.5 z/h (i.e. the height of the middle vegetation). In
the region above the middle vegetation, the velocity
increased rapidly to the water surface. There are two
distinct reflections: the first one is below the short
vegetation near 0.4 z/h, and the second occurs close
to the top of middle vegetation. Besides, the lateral
variation of mean velocity profile is complex, which
implies that the open-channel flows with completely
submerged multi-layered vegetation are intricate.
More experiments or data would be required for
further understanding.
ACKNOWLEDGEMENTS
This work was partly supported by XJTLU via the
research fund (RDF-16-02-02, REF-20-02-03, and
PGRS2012007) and by the National Natural Science
Foundation of China (11772270).
REFERENCES
Box, W., Järvelä, J., Västilä, K, 2021. Flow resistance of
floodplain vegetation mixtures for modelling river
flows. Journal of Hydrology, 601, 126593.
Curran, J., Hession, W. 2013. Vegetative impacts on
hydraulics and sediment processes across the fluvial
system. Journal of Hydrology. 505, 364–376.
Follett, E.M. and Nepf, H.M., 2012. Sediment patterns near
a model patch of reedy emergent vegetation.
Geomorphology, 179, 141-151.
Naiman, R.J. Decamps, H., and Pollock, M. 1993. The role
of riparian corridors in maintaining regional
biodiversity. Ecological Application, 3, 209-212
Rahimi, H.R., Tang, X. and Singh, P., 2020a. Experimental
and numerical study on impact of double layer
vegetation in open channel flows. Journal of
Hydrologic Engineering, 25(2), 04019064.
Rahimi, H.R., Tang, X., Singh, P., Li, M. and Alaghmand,
S., 2020b. Open channel flow within and above a
layered vegetation: Experiments and first-order closure
modeling. Advances in Water Resources, 137, 103527.
Rowiński, P.M., Västilä, K., Aberle, J., Järvelä, J. and
Kalinowska, M.B., 2018. How vegetation can aid in
coping with river management challenges: A brief
review. Ecohydrology & Hydrobiology, 18(4), 345-
354.
Scheumann, W., Sagsen, I. and Tereci, E., 2011. Orontes
River Basin: Downstream challenges and prospects for
cooperation. Turkey's Water Policy, 301-312.
Singh, P., Rahimi, H., Tang, X., 2019. Parameterization of
the modeling variables in velocity analytical solutions
of open-channel flows with double-layered vegetation.
Environmental Fluid Mechanics, 19(3), 765-784.
Tang, X., Knight, D.W. and Sterling, M., 2011. Analytical
model for streamwise velocity in vegetated channels.
Proceedings of the Institution of Civil Engineers-
Engineering and Computational Mechanics, 164(2),91-
102.
Tang, X. and Ali, S., 2013. Evaluation of methods for
predicting velocity profiles in open channel flows with
submerged rigid vegetation. In Proceedings of the 35th
IAHR world congress (Vol.4, B1, 1744-1755).
Tang, X., 2019a. A mixing ‐ length ‐ scale ‐ based
analytical model for predicting velocity profiles of
open‐channel flows with submerged rigid vegetation.
Water and Environment Journal, 33(4), 610-619.
Tang, X., 2019b. Evaluating two-layer models for velocity
profiles in open-channels with submerged vegetation.
Journal of Geoscience and Environment Protection,
7(1), 68-80.
Tang, X., Guan, Y., Hu, Y. 2021. Velocity Profile and
Lateral Distribution in an Open Channel with Two
Distinct Vegetative Zones. In Proceedings of the 7th
International Conference on Water Resource and
Environment – WRE, 240-245, Scitepress.
Tang, X., Guan, Y., Rahimi, H., Singh, P. and Zhang, Y.,
2021a. Discharge and velocity variation of flows in
open channels partially covered with different layered
vegetation. In E3S Web of Conferences (Vol. 269,
03001). EDP Sciences.
Tang, X., Rahimi, H., Guan, Y. and Wang, Y., 2021b.
Hydraulic characteristics of open-channel flow with
partially-placed double layer rigid vegetation.
Environmental Fluid Mechanics, 21(2), 317-342.
Tang, X., Rahimi, H., Singh, P., Wei, Z., Wang, Y., Zhao,
Y., Lu, Q. 2018. Experimental study of open-channel
flow with partial double-layered vegetation. In:
Proceedings of the 1st International Symposium on
Water Resource and Environmental Management
(WREM 2018), Nov. 28-29, 2018, Kunming, China.
DOI: 10.1051/e3sconf/20198101010.
Tang, X., Zhang, S., Cao, J., Wang, H., Xiao, N. and Guan,
Y., 2022. Effect of Multiple Layered Vegetation on the
Velocity Distribution of Flow in An Open Channel. In
Proceedings of the 39th IAHR world congress. 1272-
1280, DOI: 10.3850/IAHR-39WC252171192022133.
Yang, F., Huai, W., Zheng, Y. 2020. New dynamic two-
layer model for predicting depth-averaged velocity in
open channel flows with rigid submerged canopies of
different densities. Advances in Water Resources,
138(2020), 103553.
Open Channel Flow with Three-Layered Vegetation: Effect on the Velocity Distribution of Flow
293
