
Discovery and Validation of Key Biomarkers based on Machine
Learning and Immune Infiltrates in Ovarian Cancer
Linlin Zhang
1,*
, Mingming Yu
1,*
, Xuehua Bi
2
, Guanglei Yu
2
and Kai Zhao
3
1
School of Software, Xinjiang University, Urumqi 830091, China
2
College of Biomedical Engineering and Technology, Xinjiang Medical University, Urumqi 830011, China
3
College of Information Science and Engineering, Xinjiang University, Urumqi 830046, China
Keywords:
Ovarian Cancer, Immune Cell, Feature Selection, Machine Learning, Biomarkers, CIBERSOFT.
Abstract:
Ovarian cancer (OC) is the deadliest gynecological malignancy which survival rate mainly depends on early
detection. Our purpose was to search for potential OC diagnostic markers and to examine the role of immune
cell infiltration in its disease process. OC expression profiles were extracted from Gene Expression Omnibus
(GEO) and differentially expressed genes (DEGs) were identified with the limma R package and subjected to
functional correlation analysis. We used Hilbert-Schmidt Independence Criterion Least Absolute Shrinkage
and Selection Operator (HSIC-Lasso), Support Vector Machine-Recursive Feature Elimination (SVM-RFE)
algorithms and Minimum Redundancy Maximum Relevance (mRMR) to select gene features and chose the
random forest (RF) algorithm as the classifier to validate the results of gene selection. Finally, we utilized
CIBERSORT to bulk gene ex-pression profiles of OC for quantifying 22 subsets of immune cells.
Subsequently, we analysed the correlation between diagnostic markers and infiltrating immune cells. ABCA8,
IGFBP2 and REEP1 were identified as diagnostic markers for OC in this study (AUC=0.96), and a total of
380 DEGs were identified. Immune cell infiltration analysis showed that plasma cells, CD8 T cells and
activated memory CD4 T cells may be involved in the occurrence and development of OC. In addition,
ABCA8 was positively correlated with neutrophils, monocytes, activated NK cells while negatively correlated
with activated CD4 memory T cells, naïve B cells and macrophages M1. IGFBP2 was positively correlated
with macrophages M1 while negatively correlated with monocytes and neutrophils. REEP1 was positively
correlated with neutrophils, monocytes, macrophages M2, activated NK cells and plasma cells while
negatively correlated with resting NK cells, activated CD4 memory T cells and CD8 T cells. In conclusion,
ABCA8, IGFBP2 and REEP1 can be used as diagnostic markers of OC, and immune cell infiltration plays a
crucial role in the occurrence and progression of OC.
1 INTRODUCTION
Ovarian cancer is one of the most common
malignancies in women and the leading cause of
death from gynecologic cancers, ranking fifth in the
United States. In 2022, the United States is estimated
to have about 19,880 new cases and 12,810 deaths
(SIEGEL, 2022). Owing to the particularity of
ovarian location, most cases of ovarian cancer are
diagnosed as advanced and have metastasized in the
abdomen. Ovarian cancer has poor prognosis and
high mortality due to lack of effective methods for
early detection (JAYSON, 2014). Biomarkers can be
utilized to develop personalized therapeutic
interventions, and the treatment of tumors is
increasingly being influenced by biomarkers. Finding
effective biomarkers and studying their roles in the
occurrence and development of OC are of great
significance for elucidating the pathogenesis,
diagnosis, prognosis of ovarian cancer. The
development of microarray-based analysis and high-
throughput biological sequencing technology have
made it possible to analyze DEGs in order that
biomarkers related to cancer diagnosis, treatment and
prognosis can be identified and potential biological
mechanisms discovered (VOGELSTEIN, 2013).
GEO contains high-throughput gene expression data
submitted by institutions that can be uploaded or
downloaded by other researchers (CLOUGH, 2016).
Based on the high-throughput gene expression data
provided by GEO, we can deeply insight into the
biological functions and regulatory mechanisms of
Zhang, L., Yu, M., Bi, X., Yu, G. and Zhao, K.
Discovery and Validation of Key Biomarkers based on Machine Learning and Immune Infiltrates in Ovarian Cancer.
DOI: 10.5220/0012019200003633
In Proceedings of the 4th International Conference on Biotechnology and Biomedicine (ICBB 2022), pages 253-265
ISBN: 978-989-758-637-8
Copyright
c
2023 by SCITEPRESS – Science and Technology Publications, Lda. Under CC license (CC BY-NC-ND 4.0)
253

ovarian cancer, clarify the mechanisms of its
occurrence and development, and explore new
diagnostic and therapeutic approaches. The GEO
database provides data support for our research.
In this study, 7 microarray datasets (GSE10971,
GSE18520, GSE26712, GSE36668, GSE40595,
GSE54388 and GSE69428) were extracted from the
GEO. Firstly, the DEGs between OC and normal
ovary samples were identified based on the above
seven datasets, and their potential biological
functions were analyzed by functional and path-way
enrichment analysis. Then, we validated OC
diagnostic markers using machine learning
algorithms and analyzed immune cell infiltration into
OC tissue using CIBERSOFT. Finally, we performed
correlation analysis to explore the relationship
between three diagnostic markers and immune cell
infiltration.
2 MATERIALS AND METHODS
2.1 Datasets Selection and Data
Processing
Seven microarray datasets (GSE10971, GSE18520,
GSE26712, GSE36668, GSE40595, GSE54388 and
GSE69428) were extracted from the GEO database
(https://www.ncbi.nlm.nih.gov/gds/). GSE26712
was based on Affymetrix GPL96 plat-form
(Affymetrix human genome U133A array),
GSE10971, GSE18520, GSE36668, GSE40595,
GSE54388 and GSE69428 were based on Affymetrix
GPL570 platform (Affymetrix human genome U133
Plus 2.0 array). A total of 426 tissue samples, in-
cluding 348 OC samples and 78 normal ovarian
samples.
In this study, six microarray datasets (GSE10971,
GSE26712, GSE36668, GSE40595, GSE54388 and
GSE69428) were used the limma R package
(RITCHIE, 2015) for filtering batch effects due to
datasets combination. Before removing batch effects,
we used log2 to transform the expressed values of the
dataset.
2.2 Functional Correlation Analysis
In this study, we utilized clusterProfiler R package
(YU, 2012) for Gene Ontology (GO), Disease
Oncology (DO) and KEGG enrichment analysis. GO
annotation are grouped into three categories:
biological process (BP), cellular component (CC) and
molecular function (MF). The enriched KEGG
pathway and GO annotations with P < 0.05 were
selected.
For gene set enrichment analysis (GSEA), we
obtained the GSEA software (version 3.0) from the
GSEA website, divided the samples into two groups
based on the expression levels of 3 hub genes, and
downloaded the background gene set required for the
study from the Molecular Signatures Database v7.4.
Based on gene expression profile and phenotype
grouping, we set the minimum gene to 5, the
maximum gene to 5000, and one thousand resamples,
P value < 0.05 and FDR < 0.25 were considered
statistically significant.
2.3 Gene Selection
In this study, we utilized singular value
decomposition (SVD) to process the expression
matrix. Subsequently, SVM-RFE is used to filter the
optimal feature subset, it gets the importance of each
feature by the importance of the feature, eliminates
the least important features from the current feature
set, and repeats this process recursively on the set
after elimination until finally reaching the number of
features to be selected (SUYKENS, 1999).
Algorithm 1: SVM-RFE
Input: Original gene sets F = (f
1
, f
2
, …, f
m
), number
of targets: k
Output: Target genes 𝐹
∗
=(𝑓
∗
,𝑓
∗
,…,𝑓
∗
)
1 Initialize F
*
= F;
2 Train SVM according to F
*
and get the descending
ranking of all features;
3 Delete the last feature and update F
*
;
4 If the number of F
*
is equal to k, ends; otherwise,
return to step 2.
The mRMR selects features based on mutual
information with the aim of finding the set of genes
in the original set of genes that are most correlated
with the final output result but least correlated with
each other (HANCHUAN P, 2005). In gene set S, the
maximally important and minimally redundant gene
i* is given by:
𝑖
∗
=𝑎𝑟𝑔𝑚𝑎𝑋
∈
𝑅
𝑄
,
(
1
)
Where 𝑅
represents the maximum correlation
condition, 𝑄
,
represents the minimum redundancy
condition.
HSIC Lasso is a kernel-based feature selection
algorithm. It focuses on the nonlinear correlation
between input features and output results, and finally
finds non redundant features that are highly
dependent on output results (YAMADA, 2014).
ICBB 2022 - International Conference on Biotechnology and Biomedicine
254

min
∈ℝ
1
2
𝐿 −𝛼
𝐾
(
)
+𝜆
‖
𝛼
‖
(
2
)
s.t.𝛼
,···,𝛼
≥0,
Where
‖
∙
‖
is the Frobenius norm, K
()
=
HK
()
H , L=HLH, H∈ℝ
×
are centered
matrices, λ is the regularization parameter, α∈ℝ
is a parameter to be sought with non-negative
constraints.
2.4 Classification and Evaluation
Metrics
For evaluating the result of feature selection in the
previous section, we chose the random forest
algorithm as the classifier.
This study used accuracy, precision, recall,
specificity, and AUC values as the criteria for
determining the results of the experiment. The
definitions are as follows:
𝐴𝑐𝑐𝑢𝑟𝑎𝑐𝑦=
𝑇𝑃+ 𝑇𝑁
𝑇𝑃+ 𝐹𝑃+ 𝑇𝑁+ 𝐹𝑁
(
3
)
𝑃𝑟𝑒𝑐𝑖𝑠𝑖𝑜𝑛=
𝑇𝑃
𝑇𝑃+ 𝐹𝑃
(
4
)
𝑅𝑒𝑐𝑎𝑙𝑙=
𝑇𝑃
𝑇𝑃+ 𝐹𝑁
(
5
)
𝑆𝑝𝑒𝑐𝑖𝑓𝑖𝑐𝑖𝑡𝑦=
𝑇𝑁
𝐹𝑃+ 𝑇𝑁
(
6
)
AUC is defined as the area composed of receiver
operating characteristic (ROC) curve and abscissa,
which can intuitively evaluate the performance of the
classifier. The higher AUC is, the better the
classification ability of the model is.
2.5 Analysis of Immune Cell
Infiltration
CIBERSOFT is a gene-based deconvolution
algorithm that evaluates the relative proportion of 22
tumor infiltrating immune cell profiles based on
expression files, covering plasma cells, B cells, T
cells, and myeloid cell subsets. In this research, we
utilized CIBERSORT to obtain an immune cell
infiltration matrix, filtering out samples with p<0.05.
Then, we used PCA to analyse the matrix data and
draw a PCA cluster diagram. To visualize the
correlation of the 22 infiltrating immune cells, we
produced a correlation heatmap using the corrplot R
package (FRIENDLY, 2002). Violin plots were
drawn using the ggplot2 R package to display the
differences in immune cell infiltration.
3 RESULTS
3.1 Data Processing and Differential
Expression Analysis
It is necessary to remove the batch effect from the
gene expression matrix and normalize after 6 datasets
(GSE10971, GSE26712, GSE36668, GSE40595,
GSE54388 and GSE69428) were merged. The
detailed flowchart was presented in Figure 1. We
obtained 380 DEGs using the limma R package after
data processing, as shown in the volcano plot (Figure
2).
Table 1: Details of GEO datasets.
Dataset Samples Features OC Normal
GSE10971 37 23520 13 24
GSE18520 63 23519 53 10
GSE26712 195 13515 185 10
GSE36668 12 23520 8 4
GSE40595 77 23520 63 14
GSE54388 22 23520 16 6
GSE69428 20 18184 10 10
Discovery and Validation of Key Biomarkers based on Machine Learning and Immune Infiltrates in Ovarian Cancer
255

Figure 1: Flowchart of the integrated analysis.
Figure 2: Volcano plot of DEGs; red represents up-regulated differential genes, black represents no significant difference
genes, and green represents down-regulated differential genes.
3.2 Functional Correlation Analysis
The DO results show that the DEGs were mainly
involved in embryonal cancer, ovarian cancer,
embryoma, germ cell cancer, female reproductive
organ cancer (Figure 3). In the KEGG pathway
enrichment analysis, the up-regulated DEGs mainly
participated in cell cycle, DNA replication, oocyte
meiosis, p53 signaling pathway (Figure 4A). The GO
analysis of DEGs classified DEGs into three
functional groups: BP, MF, and CC. For the BP
group, the up-regulated DEGs were mainly involved
in chromosome segregation, mitotic nuclear division,
nuclear division (Figure 4B). For the MF group, the
up-regulated DEGs mainly participated in cyclin-
dependent protein serine/threonine kinase regulator
activity, microtubule binding, tubulin binding
(Figure 4C). For the CC group, the up-regulated
DEGs mainly participated in spindle, chromosomal
region, mitotic spindle (Figure 4D). GSEA results
mainly included TGF-β signaling, hedgehog
signaling and epithelial-mesenchymal transition
(Figure 5).
ICBB 2022 - International Conference on Biotechnology and Biomedicine
256
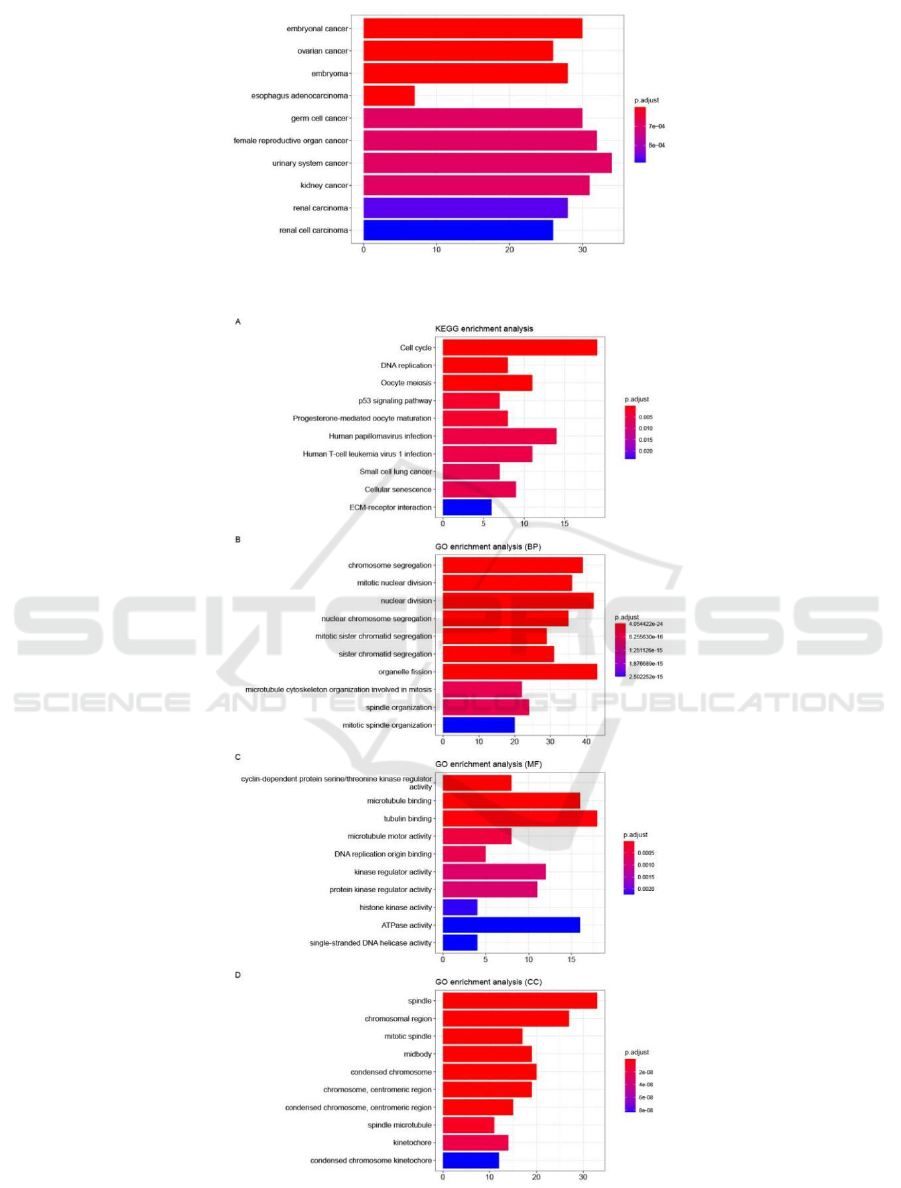
Figure 3: Histogram of DO analysis. The horizontal axis represents the number of DEGs under the DO item.
Figure 4: Histogram of KEGG and GO analysis. The horizontal axis represents the number of DEGs under the GO and KEGG
item.
Discovery and Validation of Key Biomarkers based on Machine Learning and Immune Infiltrates in Ovarian Cancer
257
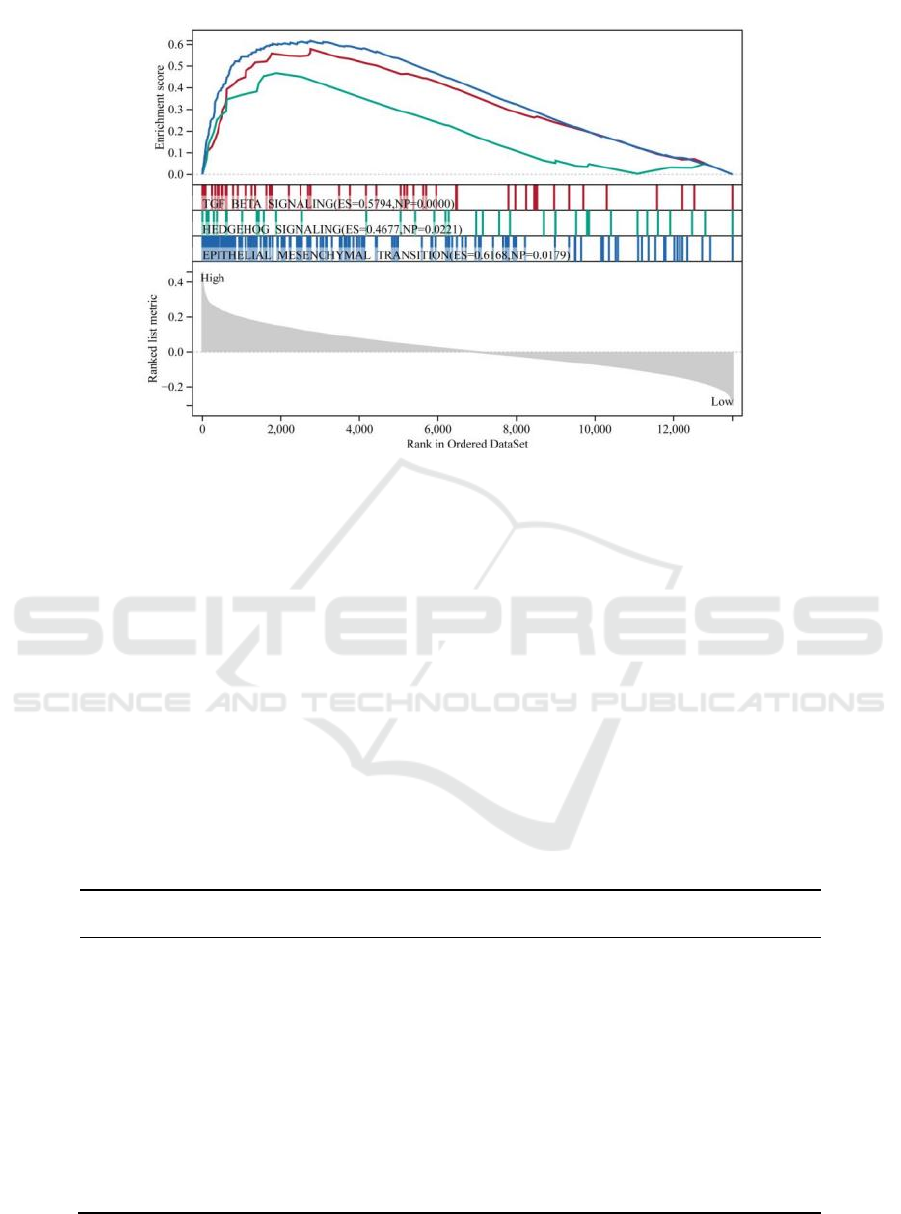
Figure 5: Gene set enrichment analysis. P value < 0.05 and FDR < 0.25 were considered statistically significant.
TGF_BETA_SIGNALING (FDR = 0.0983), HEDGEHOG_SIGNALING (FDR = 0.1169) and
EPITHELIAL_MESENCHYMAL_TRANSITION (FDR = 0.1669).
3.3 Screening and Identification of Key
Biomarkers
We downloaded seven datasets from GEO. The
number of patients was 363 (295 in the OC group; 68
in the control group). To search the biomarkers of
OC, we performed gene selection through SVM-
RFE, HSIC Lasso and mRMR (DENG, 2020;
MARVI-KHORASANI, 2019). The evaluation
metrics of the three feature selection algorithms were
shown in Table 2. The results of the SVM-RFE
showed that 11 genes were identified as signature
genes in OC. Meanwhile, we utilized the HSIC Lasso
algorithm to screen out 10 characteristic genes in OC.
Finally, the mRMR feature selection algorithm
selected 18 key genes related to ovarian cancer
(Figure 6). Known from the Venn diagram of the
three algorithms, three diagnosis-related genes were
obtained (Figure 6). We used GSE18520 to verify the
diagnostic efficacy of ABCA8, IGFBP2 and REEP1,
and the AUC results showed that the combination of
the three genes can reach a very high level in the
verification set (AUC = 0.96). The results showed
that ABCA8, IGFBP2 and REEP1 had greater
diagnostic value (Figure 7).
Table 2: Evaluation metrics for different feature selection algorithms.
Metrics SVM-RFE HSIC Lasso mRMR
Features 11 10 18
Accuracy (%) 96.00 98.13 97.87
Precision (%) 99.39 99.86 99.88
Recall (%) 97.40 98.31 98.08
Specificity (%) 89.60 96.49 96.56
AUC (%) 98.30 99.50 99.58
ICBB 2022 - International Conference on Biotechnology and Biomedicine
258
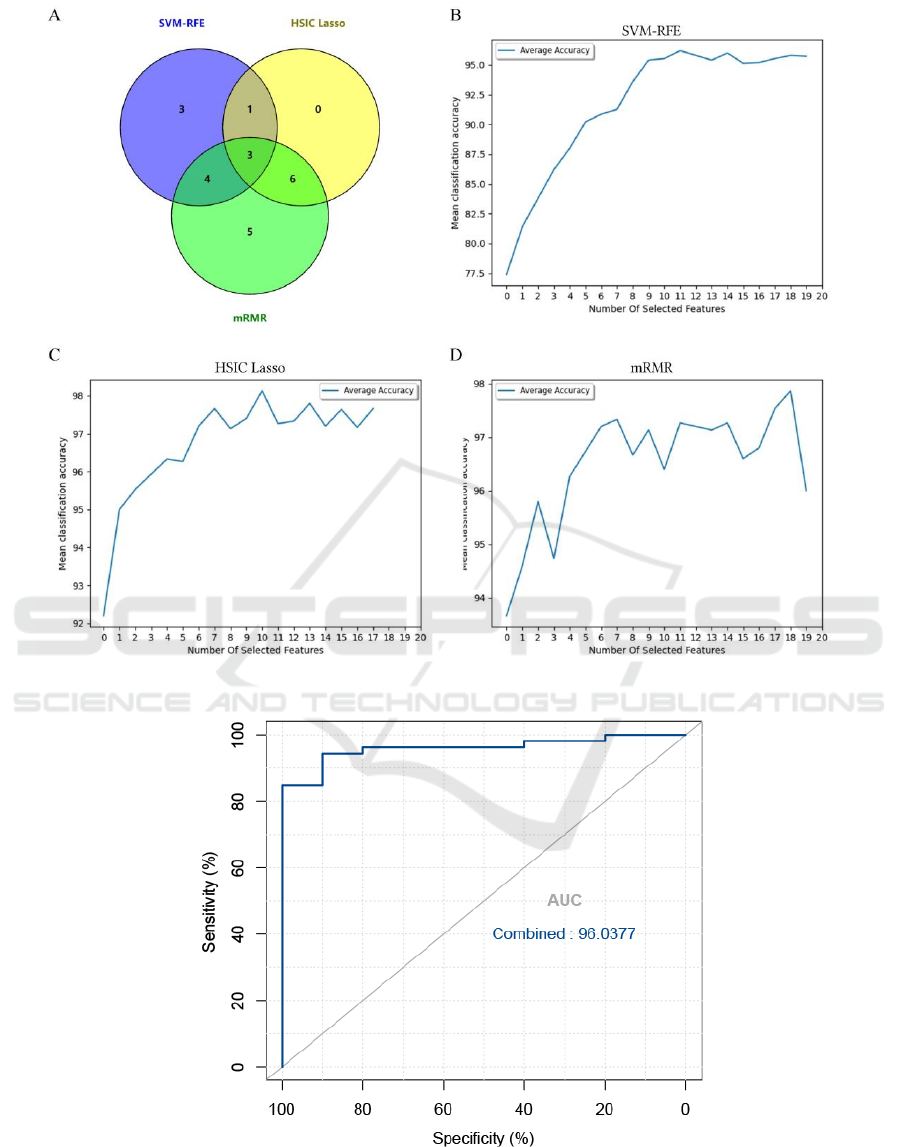
Figure 6: Venn diagram and average accuracy of three feature selection algorithms.
Figure 7: The ROC curve of patient category verification after the combination of three diagnostic markers.
Discovery and Validation of Key Biomarkers based on Machine Learning and Immune Infiltrates in Ovarian Cancer
259

3.4 Immune Cell Infiltration
To explore the role of immune cell infiltration in OC,
in this study, we utilized PCA cluster analysis to
observe differences between OC samples and normal
samples, and we found significant differences in
immune cell infiltration between the two groups.
(Figure 8A). Derived from the correlation heat map
of immune cells, activated CD4 memory T cells,
resting mast cells, and activated dendritic cells had a
significant positive correlation. The violin plot
indicated that the fraction for plasma cells, T cells
CD8 and T cells CD4 memory activated in the OC
group were significantly higher than the normal
group. On the contrary, the fractions of many cells
were lower than the normal group, such as T cells
CD4 naïve, T cells gamma delta, monocytes, and
neutrophils (Figure 8B).
The correlation analysis between ABCA8,
IGFBP2, REEP1 and infiltrating immune cells
showed that ABCA8 was positively correlated with
neutrophils, monocytes and activated NK cells while
negatively correlated with activated CD4 memory T
cells, naïve B cells and macrophages M1. IGFBP2
was positively correlated with macrophages M1
while negatively correlated with monocytes and
neutrophils. REEP1 was positively correlated with
neutrophils, monocytes, macrophages M2, activated
NK cells and plasma cells while negatively correlated
with resting NK cells, activated CD4 memory T cells
and CD8 T cells (Figure 9).
Figure 8: Immune cell infiltration analysis. (A) PCA cluster plot of immune cell infiltration between OC samples and normal
samples. (B) Violin diagram of the proportion of 22 types of immune cells. (C) Correlation heat map of 22 types of immune
cells.
ICBB 2022 - International Conference on Biotechnology and Biomedicine
260
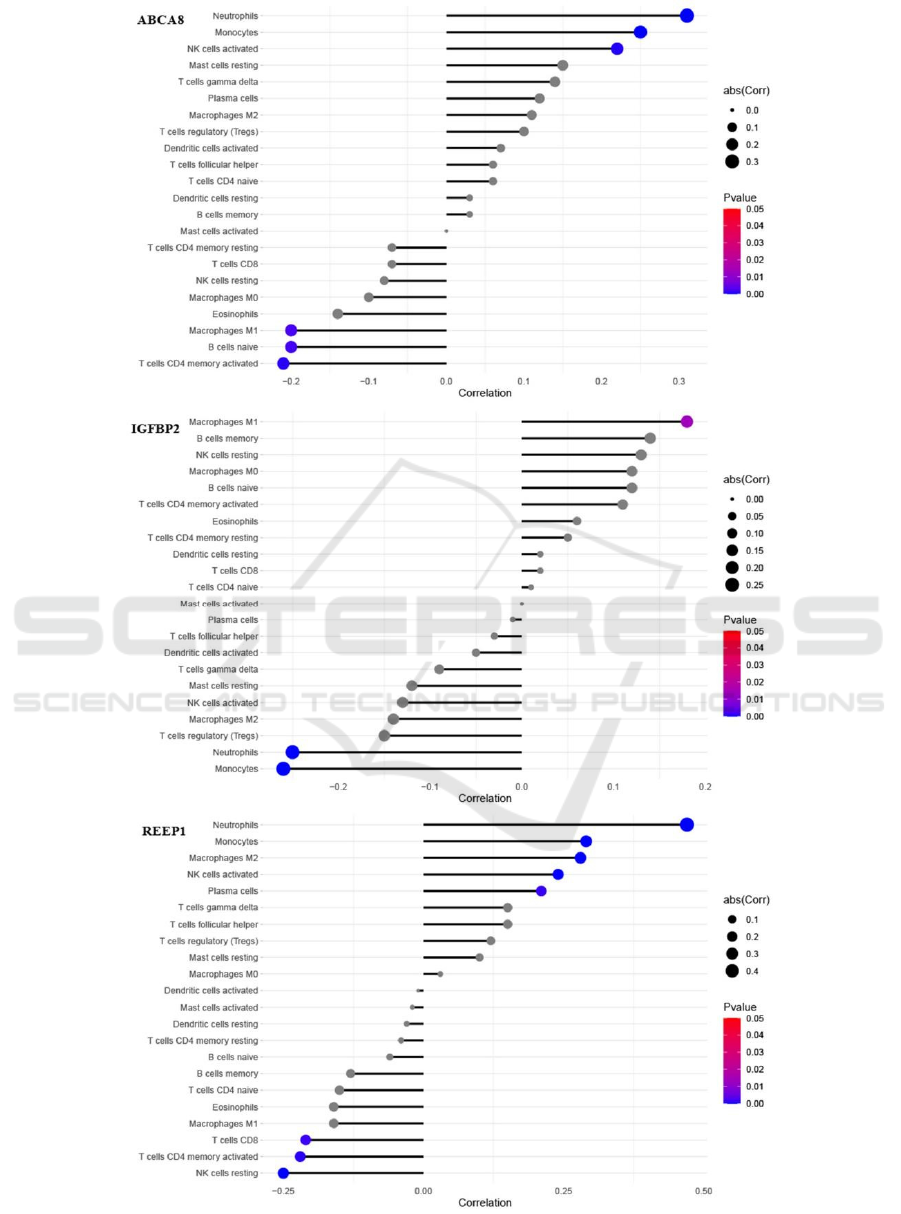
Figure 9: Correlation between ABCA8, IGFBP2, REEP1 and infiltrating immune cell.
Discovery and Validation of Key Biomarkers based on Machine Learning and Immune Infiltrates in Ovarian Cancer
261

4 DISCUSSION
Ovarian cancer is the deadliest gynecological
malignancies. In 2018, there were 295,414 new cases
and 184,799 deaths worldwide, showing a significant
upward trend. Due to the onset of ovarian cancer is
very insidious, there are no obvious symptoms in the
early stage of the disease, and accurate methods for
early screening are lacking. As a result, more than
70% of patients are at an advanced stage at initial
diagnosis. Studies have shown that the infiltration of
immune cells plays a crucial role in the occurrence
and development of OC (ZHANG, 2020). Therefore,
it is of great significance to use machine learning to
find specific markers and analyze the infiltration
patterns of OC immune cells to improve the
prognosis of OC patients. The CIBERSOFT tool also
facilitates the analysis of disease facial cell
infiltration. In this research, we utilized machine
learning method to identify the diagnostic markers of
OC. In addition, we also analyzed the role of immune
cell infiltration in OC.
First, we assembled 7 OC gene expression
datasets from GEO database, with a total of 426
samples, including 348 OC samples and 78 normal
samples. We identified 380 DEGs using limma R
package. KEGG results show that DEGs mainly
participated in the KEGG pathway including cell
cycle, DNA replication, oocyte meiosis, p53
signaling pathway. GO enrichment results show that
DEGs were mainly related to chromosome
segregation, mitotic nuclear division and cyclin-
dependent protein serine/threonine kinase regulator
activity. DO enrichment results show that the
diseases mainly include embryonal cancer, ovarian
cancer, embryoma, germ cell cancer, female
reproductive organ cancer. Furthermore, GSEA
results mainly involves TGF-β signaling, hedgehog
signaling and epithelial-mesenchymal transition.
Research by Basu et al. (BASU, 2015) found that the
activation of TGF-β signaling can induce the invasion
of OC cells. Wen et al. (WEN, 2020) showed that the
self-renewal, migration and invasion of OC stem
cells can be inhibited by blocking TGF-β signaling.
The study of Doheny et al. (DOHENY, 2020)
concluded that abnormal activation of the hedgehog
signaling plays a crucial role in the occurrence and
development of ovarian cancer. Nieto et al. (NIETO,
2016) showed that epithelial-mesenchymal transition
is the main process for the transformation of early
ovarian tumors into aggressive and metastatic
malignancies. The above results show that the
analytical results of our study are precise.
SVD is a widely used algorithm in machine
learning, mainly applied for feature decomposition in
dimension reduction algorithms. SVM-RFE is one of
the commonly used feature selection methods. The
so-called recursive feature removal is to take the form
of a loop to get the order of features. In each recursive
process, the score of each feature will be calculated
according to certain rules, remove the lowest score
(the least important feature), then repeat the process,
until all genes have their own sequence. HSIC is a
non-linear feature selection method that considers the
relationship between non-linear input and output.
HSIC Lasso uses HSIC to measure the dependencies
between variables. The mRMR selects features based
on mutual information with the aim of finding the set
of genes in the original set of genes that are most
correlated with the final output result but least
correlated with each other. First, we utilize singular
value decomposition to process the expression
matrix. The genes are then filtered using three
algorithms to create the optimal classification model.
Finally, combining the screening results of the three
algorithms, ABCA8, IGFBP2 and REEP1 were
identified as diagnostic markers for OC.
The ABC transporter superfamily can mediate the
ATP-dependent transport of many exogenous and
endogenous substances through the lipid bilayer. The
ABC transporter is responsible for the transport of
various inflammatory mediators and lipids. These
substances are directly related to tumor progression
in ovarian cancer. Therefore, they can contribute to
the clinical outcome and become a potential
therapeutic target for OC. Hedditch et al.
(HEDDITCH, 2014) showed that ABCA transporter
correlated with poor prognosis in serous ovarian
cancer, suggesting that lipid trafficking was a
potentially important process in epithelial ovarian
cancer. Cancer cells rely on de novo synthesis of
lipids to produce fatty acids to meet the increased
energy requirements of tumor growth. More and
more evidences indicate that lipid metabolism is
dysregulated in cancers including ovarian cancer
(PYRAGIUS, 2013). Therefore, we believe that
ABCA8 may be involved in the pathological process
of OC. The IGFBP family plays a vital role in
regulating basic biological activities outside and
inside cells (BAXTER, 2014). Research by Lee et al.
(LEE, 2005) found through western blotting and
tissue microarray analysis that IGFBP2 was
significantly overexpressed in malignant ovarian
tissues, indicating that IGFBP2 enhanced the
invasive ability of ovarian cancer cells. In addition,
the increase in IGFBP2 expression is positively
correlated with the level of serum tumor marker
ICBB 2022 - International Conference on Biotechnology and Biomedicine
262

CA125 (FLYVBJERG, 1997). Therefore, we
conclude that IGFBP2 can be used as a potential
marker for the diagnosis of OC, and given that
IGFBP2 can enhance the invasion ability of cancer
cells, IGFBP2 has great potential as a therapeutic
target in the future. REEP1 is a member of the
endoplasmic reticulum (ER)-forming protein family
that localizes to the ER and the plasma membrane
(RENVOISé, 2016; BJöRK, 2013). Voloshanenko et
al. (VOLOSHANENKO, 2018) used independent
experiments to prove that REEP1 can be used as a
non-classical target gene in colon cancer cells. Zhao
et al. (ZHAO, 2019) showed that REEP1 can be used
as a molecular diagnostic marker and therapeutic
target for breast cancer. GO annotations related to
REEP1 include microtubule binding, and research
showed that Paclitaxel, as a microtubule inhibitor,
can be used to treat high-grade serous ovarian cancer.
Due to the tumor resistance of paclitaxel as a
therapeutic drug, the discovery of new microtubule
inhibitors has become more and more urgent.
Therefore, it is necessary to study the mechanism of
the occurrence and development of REEP1 in ovarian
cancer.
We used CIBERSOFT to further explore the role
of immune cell infiltration in OC. The results showed
that an increased infiltration of plasma cells, CD8 T
cells, activated memory CD4 T cells, and a decreased
infiltration of naïve CD4 T cells, gamma delta T cells,
monocytes, neutrophils. Kroeger et al. (KROEGER ,
2016) indicated that plasma cells are related with
CD8(+) tumor-infiltrating lymphocytes response in
OC. Sato et al. (SATO, 2005) used
immunohistochemical analysis to confirm that
intraepithelial CD8+ tumor infiltrating lymphocytes
and high CD8+/regulatory T cell ratio can
significantly improve the survival rate of ovarian
cancer patients. In the tumor-associated lymphocytes
of ascites in patients with ovarian cancer, the
frequency of activated memory T-cells was
significantly increased, and they may be activated by
the tumor or the tumor-related microenvironment
(LANDSKRON, 2015). The patient with high mast
cell infiltration had a longer survival period was
found in (CHAN, 2005). The relationship between
macrophages and ovarian cancer was explored by
Zhang et al. (ZHANG, 2020), and they had found that
macrophages promote the proliferation and migration
of ovarian tumors, providing a potential treatment
method for patients with ovarian cancer. A new
mechanism of action for paclitaxel was discovered by
Wanderley et al. (WANDERLEY, 2018) through the
formation of several tumor models, they showed that
paclitaxel switched tumor associated macrophages to
an M1 like antitumor phenotype by reactivating
anticancer immune responses, which provided a
rationale for a new treatment regimen combining
paclitaxel with immunotherapy. Regarding
monocytes, Prat et al. (PRAT, 2020) verified that
they can be used as a biomarker of ascites immune
status and ovarian cancer progression. The
prerequisite step before the metastasis of ovarian
cancer in situ is that neutrophils flow into the
omentum, and the extracellular traps of neutrophils
combine with ovarian cancer cells to promote
metastasis (LEE, 2019). The above analysis shows
that plasma cells, CD8 T cells, activated memory
CD4 T cells, monocytes, neutrophils play crucial
roles in the pathogenesis of OC and should be the
focus of further research.
We combined SVD with three feature selection
algorithms to validate diagnostic markers for OC and
analysed immune cell infiltration in OC tissues using
CIBERSOFT. Our study has certain limitations due
to the limited genetic data available for analysis.
5 CONCLUSIONS
In this paper, we found that ABCA8, IGFBP2 and
REEP1 are diagnostic markers of OC. Also, this
study found that plasma cells, CD8 T cells, and
activated memory CD4 T cells may be involved in
the occurrence and development of OC. Besides,
ABCA8 was positively correlated with neutrophils,
monocytes, activated NK cells and negatively
correlated with activated CD4 memory T cells, naïve
B cells, macrophages M1. IGFBP2 was positively
correlated with macrophages M1 and negatively
correlated with monocytes, neutrophils. REEP1 was
positively correlated with neutrophils, monocytes,
macrophages M2, activated NK cells, plasma cells
and negatively correlated with resting NK cells,
activated CD4 memory T cells, CD8 T cells. In the
future, the role of these immune cells in ovarian
cancer requires further research to identify the targets
of OC immunotherapy, which can help to improve
the level of immunomodulatory therapy for OC
patients.
ACKNOWLEDGMENTS
This work was supported in part by the Natural
Science Foundation of Xinjiang Uygur Autonomous
Region under Grant 2019D01C062, 2019D01C041,
2019D01C205, and 2020D01C028; in part by the
Discovery and Validation of Key Biomarkers based on Machine Learning and Immune Infiltrates in Ovarian Cancer
263

National Natural Science Foundation of China under
Grant 12061071; in part by the Higher Education of
Xinjiang Uygur Autonomous Region under Grant
XJEDU2020Y003, and XJEDU2019Y006; in part by
the Major Science and Technology Special Project of
Xinjiang Uygur Autonomous Region under Grant
2020A02001-1; in part by the Major Science and
Technology Project of Sichuan Science and
Technology Plan under Grant 2020YFQ0018; in part
by the National Innovation Training Project for
College Student under Grant 202010755021.
REFERENCES
Basu M, Bhattacharya R, Ray U, et al. Invasion of ovarian
cancer cells is induced byPITX2-mediated activation of
TGF-β and Activin-A[J]. Molecular cancer, 2015,
14(162.
Baxter R C. IGF binding proteins in cancer: mechanistic
and clinical insights[J]. Nature reviews Cancer, 2014,
14(5): 329-341.
Björk S, Hurt C M, Ho V K, et al. REEPs are membrane
shaping adapter proteins that modulate specific g
protein-coupled receptor trafficking by affecting ER
cargo capacity[J]. PloS one, 2013, 8(10): e76366.
Chan J K, Magistris A, Loizzi V, et al. Mast cell density,
angiogenesis, blood clotting, and prognosis in women
with advanced ovarian cancer[J]. Gynecologic
oncology, 2005, 99(1): 20-25.
Clough E, Barrett T. The Gene Expression Omnibus
Database[J]. Methods in molecular biology (Clifton,
NJ), 2016, 1418: 93-110.
Deng Y-J, Ren E-H, Yuan W-H, et al. GRB10 and E2F3 as
Diagnostic Markers of Osteoarthritis and Their
Correlation with Immune Infiltration[J]. Diagnostics,
2020, 10(3): 171-187.
Doheny D, Manore S G, Wong G L, et al. Hedgehog
Signaling and Truncated GLI1 in Cancer[J]. Cells,
2020, 9(9): 2114-2130.
Flyvbjerg A, Mogensen O, Mogensen B, et al. Elevated
serum insulin-like growth factor-binding protein 2
(IGFBP-2) and decreased IGFBP-3 in epithelial
ovarian cancer: correlation with cancer antigen 125 and
tumor-associated trypsin inhibitor[J]. The Journal of
clinical endocrinology and metabolism, 1997, 82(7):
2308-2313.
Friendly M. Corrgrams: Exploratory Displays for
Correlation Matrices[J]. The American Statistician,
2002, 56(4): 316-324.
Guangchuang Yu L-G W, Yanyan Han, and Qing-Yu He.
clusterProfiler: an R Package for Comparing Biological
Themes Among Gene Clusters[J]. OMICS: A Journal
of Integrative Biology, 2012, 16(5): 284-287.
Hanchuan P, Fuhui L, Ding C. Feature selection based on
mutual information criteria of max-dependency, max-
relevance, and min-redundancy[J]. IEEE Transactions
on Pattern Analysis and Machine Intelligence, 2005,
27(8): 1226-1238.
Hedditch E L, Gao B, Russell A J, et al. ABCA Transporter
Gene Expression and Poor Outcome in Epithelial
Ovarian Cancer[J]. JNCI: Journal of the National
Cancer Institute, 2014, 106(7): dju149.
Jayson G C, Kohn E C, Kitchener H C, et al. Ovarian
cancer[J]. The Lancet, 2014, 384(9951): 1376-1388.
KROEGER D R, MILNE K, NELSON B H. Tumor-
Infiltrating Plasma Cells Are Associated with Tertiary
Lymphoid Structures, Cytolytic T-Cell Responses, and
Superior Prognosis in Ovarian Cancer[J]. Clinical
cancer research: an official journal of the American
Association for Cancer Research, 2016, 22(12): 3005-
3015.
Landskron J, Helland Ø, Torgersen K M, et al. Activated
regulatory and memory T-cells accumulate in
malignant ascites from ovarian carcinoma patients [J].
Cancer Immunology, Immunotherapy, 2015, 64(3):
337-347.
Lee W, Ko S Y, Mohamed M S, et al. Neutrophils facilitate
ovarian cancer premetastatic niche formation in the
omentum [J]. The Journal of experimental medicine,
2019, 216(1): 176-194.
Lee E J, Mircean C, Shmulevich I, et al. Insulin-like growth
factor binding protein 2 promotes ovarian cancer cell
invasion[J]. Molecular cancer, 2005, 4(1): 7-13.
Marvi-Khorasani H, Usefi H. Feature Clustering Towards
Gene Selection[C]. In Proc. of the 18th IEEE
International Conference on Machine Learning and
Applications (ICMLA). Dec 16-19, 2019, Boca Raton,
FL, USA, pp: 1466-1469.
Nieto M A, Huang R Y, Jackson R A, et al. EMT: 2016[J].
Cell, 2016, 166(1): 21-45.
Prat M, Le Naour A, Coulson K, et al. Circulating
CD14(high) CD16(low) intermediate blood monocytes
as a biomarker of ascites immune status and ovarian
cancer progression[J]. Journal for immunotherapy of
cancer, 2020, 8(1): e000472.
Pyragius C E, Fuller M, Ricciardelli C, et al. Aberrant lipid
metabolism: an emerging diagnostic and therapeutic
target in ovarian cancer[J]. International journal of
molecular sciences, 2013, 14(4): 7742-7756.
Renvoisé B, Malone B, Falgairolle M, et al. Reep1 null
mice reveal a converging role for hereditary spastic
paraplegia proteins in lipid droplet regulation[J].
Human molecular genetics, 2016, 25(23): 5111-5125.
Ritchie M E, Phipson B, Wu D, et al. limma powers
differential expression analyses for RNA-sequencing
and microarray studies[J]. Nucleic Acids Research,
2015, 43(7): e47.
Sato E, Olson S H, Ahn J, et al. Intraepithelial CD8+ tumor-
infiltrating lymphocytes and a high CD8+/regulatory T
cell ratio is associated with favorable prognosis in
ovarian cancer[J]. Proceedings of the National
Academy of Sciences of the United States of America,
2005, 102(51): 18538-18543.
Siegel R L, Miller K D, Fuchs H E, et al. Cancer statistics,
2022[J]. CA: A Cancer Journal for Clinicians, 2022,
72(1): 7-33.
ICBB 2022 - International Conference on Biotechnology and Biomedicine
264

Suykens J A K, Vandewalle J. Least Squares Support
Vector Machine Classifiers[J]. Neural Processing
Letters, 1999, 9(3): 293-300.
Vogelstein B, Papadopoulos N, Velculescu V E, et al.
Cancer Genome Landscapes[J]. Science, 2013,
339(6127): 1546-1358.
Voloshanenko O, Schwartz U, Kranz D, et al. β-catenin-
independent regulation of Wnt target genes by RoR2
and ATF2/ATF4 in colon cancer cells[J]. Scientific
Reports, 2018, 8(1): 3178.
Wanderley C W, Colón D F, Luiz J P M, et al. Paclitaxel
Reduces Tumor Growth by Reprogramming Tumor-
Associated Macrophages to an M1 Profile in a TLR4-
Dependent Manner[J]. Cancer research, 2018, 78(20):
5891-5900.
Wen H, Qian M, He J, et al. Inhibiting of self-renewal,
migration, and invasion of ovarian cancer stem cells by
blocking TGF-β pathway[J]. PloS one, 2020, 15(3):
e0230230.
Yamada M, Jitkrittum W, Sigal L, et al. High-Dimensional
Feature Selection by Feature-Wise Kernelized
Lasso[J]. Neural Computation, 2014, 26(1): 185-207.
Zhang Q F, Li J, Jiang K, et al. CDK4/6 inhibition promotes
immune infiltration in ovarian cancer and synergizes
with PD-1 blockade in a B cell-dependent manner[J].
Theranostics, 2020, 10(23): 10619-10633.
Zhao C, Lou Y, Wang Y, et al. A gene expression
signature-based nomogram model in prediction of
breast cancer bone metastases[J]. Cancer Medicine,
2019, 8(1): 200-208.
Zhang Q, Li H, Mao Y, et al. Apoptotic SKOV3 cells
stimulate M0 macrophages to differentiate into M2
macrophages and promote the proliferation and
migration of ovarian cancer cells by activating the ERK
signaling pathway[J]. International journal of
molecular medicine, 2020, 45(1): 10-22.
Discovery and Validation of Key Biomarkers based on Machine Learning and Immune Infiltrates in Ovarian Cancer
265
