
Research on Stock Price Prediction Based on Autoregressive Model of
Maximum Corentropy Criterion
Shenghan Gao
1a
, Mengyang Liu
1b
, Lina Wang
2c
, Xiaoyan Qiao
3d
and Feng Zhao
2,* e
1
School of Statistics, Shandong Technology and Business University, 191 Binhai Middle Road, Yantai, China
2
School of Computer Science and Technology, Shandong Technology and Business University, 191 Binhai Middle Road,
Yantai, China
3
School of Mathematics and Information Science, Shandong Technology and Business University, 191 Binhai Middle Road,
Yantai, China
Keywords: Stock Forecast, Relative Entropy, Clustering, Open Set Identification.
Abstract: As a barometer of the financial market, the stock market is closely related to national economic development,
corporate financing and investors' interests. However, there are many and complex factors affecting stock
price volatility, which makes accurate prediction of stock price volatility still a challenging problem. In order
to predict the stock price more accurately, the maximum correlation entropy autoregression model is proposed
in this paper. Specifically, the maximum entropy criterion is used to replace the minimum mean square error
criterion in the autoregressive model to eliminate the influence of singular values. Then a new clustering
method is used to cluster the segmented stock price curves, and a regression model is built for each class,
which reduces the influence of the order of the regression model on the prediction accuracy. In addition, the
open set identification method is adopted in this paper to add boundary constraints to each curve after
clustering, which is used to enhance the pertinence of the regression model and effectively improve the
prediction accuracy. The experimental results show that the proposed method has high prediction accuracy.
1 INTRODUCTION
As an important part of the national economy, the
stock market plays an irreplaceable role in the
economic development, and its changing trend is
considered as the barometer of the economic market.
The development of the stock market is of great
significance to the national macro economy,
enterprises and individual investors (Zeqiraj 2020). At
the national level, the changing trend of the stock
market can accurately reflect the development trend
of the national economy, which is conducive to the
country's macro-market regulation (Zhou 2021).
From the perspective of enterprises, the stock market
can help enterprises to make strategic adjustment and
enhance the liquidity and flexibility of investment
(Wu 2021). From the perspective of individuals,
a
https://orcid.org/0000-0002-3671-8036
b
https://orcid.org/0000-0001-9879-562X
c
https://orcid.org/0000-0003-1676-6230
accurate prediction of stock prices can improve
investment returns and reduce investment risks for
individual investors (Chen 2022). Therefore, stock
price prediction has very important research
significance, and has become a research hotspot of
many scholars at home and abroad.
At present, domestic and foreign scholars have
studied stock price prediction methods from different
angles, and have achieved relatively good results.
Generally speaking, the commonly used stock price
prediction methods at present mainly include
investment analysis method (Li 2022, Nti 2020,
Jordan 2018), statistical model (Khoojine 2020, Ji
2021, Wang 2020) and machine learning (Zhang
2021, Zhang 2018, Xiao 2020). Among them,
autoregressive (AR) model is regarded as a crucial
forecasting method in time series analysis, which is a
process of using itself as a regression variable as well
as adopting the minimum mean square error criterion
d
https://orcid.org/0000-0002-2011-9717
e
https://orcid.org/0000-0003-3954-4307
Gao, S., Liu, M., Wang, L., Qiao, X. and Zhao, F.
Research on Stock Price Prediction Based on Autoregressive Model of Maximum Corentropy Criterion.
DOI: 10.5220/0012023700003620
In Proceedings of the 4th International Conference on Economic Management and Model Engineering (ICEMME 2022), pages 67-75
ISBN: 978-989-758-636-1
Copyright
c
2023 by SCITEPRESS – Science and Technology Publications, Lda. Under CC license (CC BY-NC-ND 4.0)
67

to estimate the model. Further, AR model and its
variant versions have been extensively used in field of
economics and finance (Ye 2017, Santosa 2022, Tash
2011). For example, Ye proposed an ARIMA-SVR
stock prediction model based on wavelet analysis,
which improved the forecasting accuracy but did not
overcome the influence of singularities in the time
series (Ye 2017). ARIMA model was employed to
predict the prices of 45 stocks with different
characteristics, and the stock sequence suitable for the
model was procured by classification (Santosa 2022).
Tash and Modarres applied the AR/GARCH model to
Tehran stocks, and the prediction results show ed that
their method could improve the prediction accuracy
(Tash 2011).
However, the method based on autoregressive
model still has two deficiencies, which may lead to
prediction bias in the model.
(1) The mean square error criterion used in the
autoregressive model will lead to errors in prediction.
Specifically, if some data points of random variables
are far away from each other in the coordinate system
of the same name, the error will expand in the form of
square, which makes a huge gap between the two
random variables.
(2) The autoregressive model uses the same order
to predict different fluctuations, which will lead to
prediction errors. Specifically, because of the
complexity of the stock price curve, a regression
model is used to predict the change of the price curve
of all stocks, resulting in low prediction accuracy.
In order to accurately predict the stock price trend,
this paper proposes a stock price trend prediction
method based on the maximum correlation entropy
autoregressive model. Specifically, firstly, the stock
price curve is segmented and correlational entropy is
used as the similarity measure to cluster the price
curve segments. Then, for each class of clustered data,
a regression model is constructed using the maximum
corentropy criterion as the constraint function, which
is used to predict the change trend of the stock price
curve. In summary, this paper mainly does the
following four aspects :(1) based on the maximum
correlationentropy criterion, a new regression
prediction model is constructed. Traditional
autoregressive models are sensitive to singularities
because of the minimum mean square error criterion.
In this paper, the maximum corentropy criterion is
used as the constraint function, and the Gaussian
corentropy is used to limit the infinite expansion of
the error, which effectively weakens the influence of
the singularity on the curve similarity measurement.
(2) Based on the clustering strategy, a well-targeted
regression prediction model is constructed for each
type of price curve. The prediction accuracy of
regression model is greatly affected by model order.
Because of the complexity of using the stock price
curve, using one regression model to predict the
change of the price curve of all stocks leads to low
prediction accuracy. Using the clustering strategy, the
price curves with similar change trends are grouped
into a group, and a regression model is constructed
for price prediction, which can effectively improve
the accuracy of prediction. (3) Based on correlational
entropy, a new similarity measure of price curve is
proposed. The existing clustering methods are
generally based on Euclidean distance and the
clustering results are particularly sensitive to the
singularity of the stock price curve. Correlational
entropy is used to measure the similarity of any two
curves. Essentially, two curves are taken as random
variables to measure the similarity based on the
difference of their probability distribution, which can
better overcome the influence of singularities. (4)
Based on the open set identification, the singularity
problem in the clustering process is optimized. In this
paper, the open set recognition strategy is adopted to
add boundary constraints to the clustering results,
which makes the clustering results more accurate and
can better deal with the problem of singular point
classification in the clustering process. In order to
visually illustrate the advantages of open set
recognition, this paper clustering the data containing
singularities. As shown in Figure 1, Figure 1 (b)
represents the original data, where sample points
①~④ represent the data to be classified. Figure 1
(a) shows the result obtained by using closed sets,
and symbols "⊕" and "
○
,— " represent different
categories. It is obvious that singularities ② and ④
do not fit into any category. If open set identification
is adopted, the result is shown in FIG. 1 (c). It can be
seen that singularities ② and ④ are outside the
boundary constraints and can eliminate this problem.
2 RELATED METHODS
This section mainly introduces the methods related to
this paper, including similarity measures and
autoregressive models. This paper uses uppercase
letters (e.g. X,Y ) to represent time series data,
lowercase letters with subscripts (e.g. x
,y
) to
represent individual data, uppercase bold letters
(e.g.𝑿,𝒀)to represent matrices, and superscript letter
d to represent distances (e.g.d
, Euclidean distances).
ICEMME 2022 - The International Conference on Economic Management and Model Engineering
68
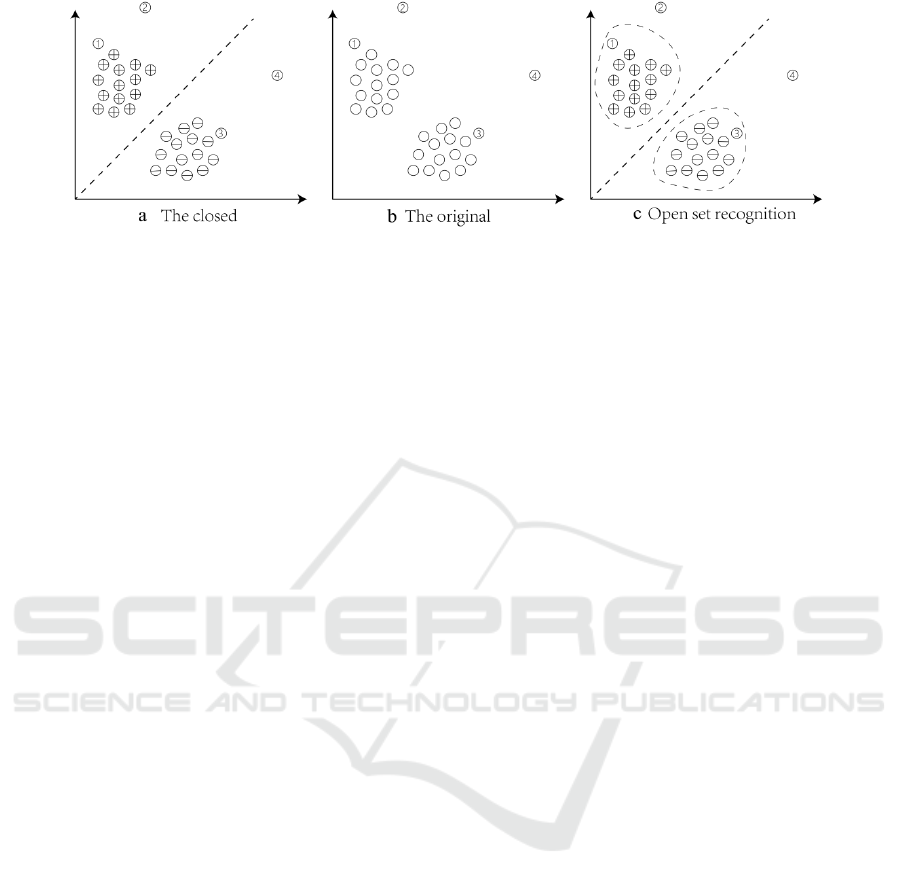
Figure 1: Comparison of classification results.
2.1 Autoregressive Model
For the multidimensional regression model, the N-
order regression process of data series {𝛸
} is :
𝛸
=𝛽
𝛸
+𝛽
𝛸
-2
+⋯𝛽
𝛸
+𝐸
(1)
According to the linear theory, the p-dimensional
regression model is expressed as:
𝛸
(
𝑖
)
=𝛽
(
𝑖
)
𝛸
+⋯+𝛽
(
𝑖
)
𝛸
+𝐸
(
𝑖
)
(2)
Among them 𝑖=1,2, ···
,
𝑃
The least square algorithm is used to minimize the
sum of squares of errors, so that 𝛽=[𝛽
,𝛽
,…𝛽
]
and 𝑌
=[𝛸
,𝛸
,···
,
𝛸
] ,get the target
function:
min
(𝛸
−β𝑌
)
(3)
The final regression coefficient is : β =
(𝑌
𝑌
)
𝑌
Χ
.
However, the use of the minimum mean square
error criterion in the autoregressive model and the use
of the same order to predict different stock volatility
will lead to the model being more sensitive to singular
points. Specifically, if some data points of a random
variable are far away from each other in the
coordinate system with the same name, the error will
be expanded by the square situation, thus making a
huge gap between the two random variables. As stock
prices are affected by abnormal and unexpected
events, there are many singular points in stock price
data, so autoregressive model can not accurately
predict stock prices. Aiming at this problem, this
paper adopts an improved prediction method to
establish a robust regression prediction model based
on the maximum correlationentropy criterion.
3 CONSTRUCTION OF
AUTOREGRESSIVE MODEL
BASED ON
CORRELATIONENTROPY
In order to eliminate the singularity sensitivity
problem of stock price data, the correlational entropy
autoregressive model is adopted in this paper, and its
flow chart is shown in FIG. 2, where (a) represents
the training stage process of the model, and (b)
represents the prediction stage process of the model.
In the model training stage, the segmented stock
price curves are firstly clustered, corentropy is used
as the similarity measure in the clustering process,
and the open-set recognition method is integrated to
improve the accuracy of clustering results, as shown
in step 1 in FIG. 2 (a). Secondly, after the completion
of clustering, a regression model is constructed for
each class, and the prediction value is obtained by
using the constructed model, as shown in step 2 in
FIG. 2 (a). Finally, Step 1 and step 2 are repeated with
different orders and the error with the real value is
calculated to select the optimal order. In the model
prediction stage, firstly, the distance between the data
to be predicted and each class center is calculated,
and the class with the smallest distance is selected as
its category, as shown in step 1 in FIG. 2 (b).
Secondly, the correlational entropy autoregressive
model is used for prediction, and the final predicted
value is obtained, as shown in step 2 in FIG. 2 (b).
3.1 Construction of Curve Similarity
Measure Based on
Correlationentropy
Aiming at the sensitivity of Euclidean distance to
singularity, correlational entropy is chosen as the
similarity measure of curves in this paper. When the
statistical distributions of the two random variables
Research on Stock Price Prediction Based on Autoregressive Model of Maximum Corentropy Criterion
69
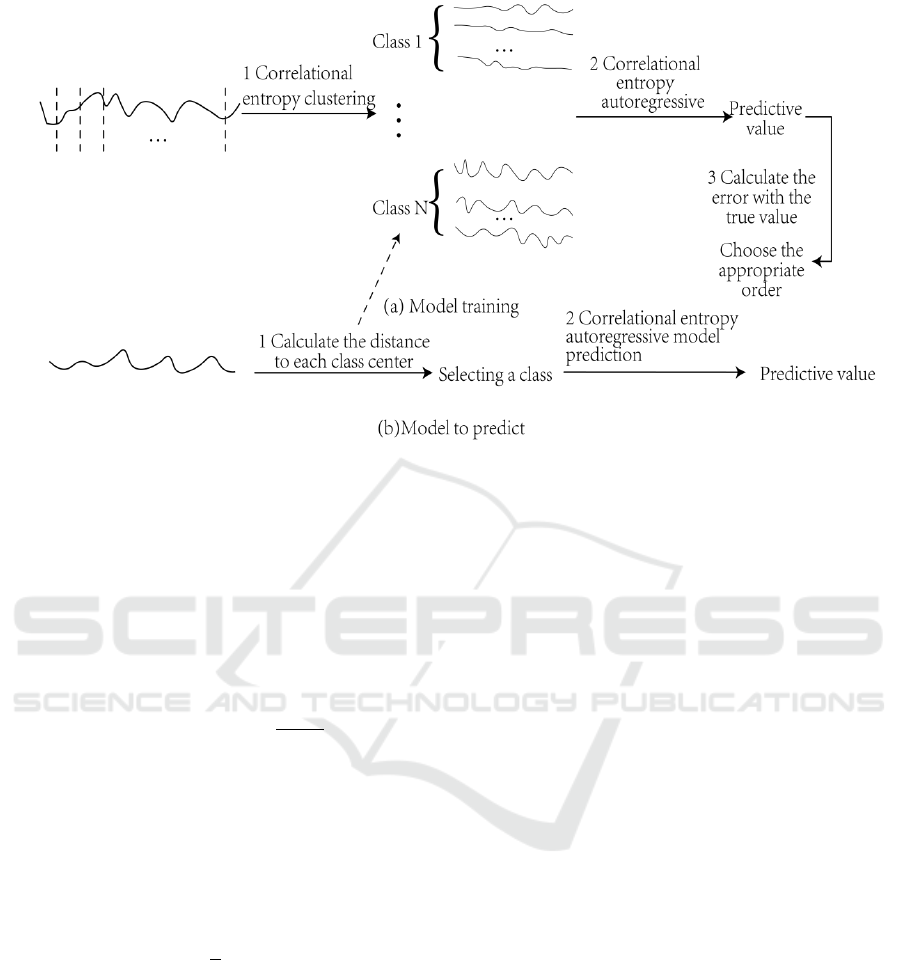
Figure 2: Flowchart of correlational entropy autoregressive model.
are closest, the objective function of Equation (8) is
the smallest. Correlational entropy is a measure of
similarity between two random variables, which can
be expressed as:
𝑑
(
𝑋,𝑌
)
=𝐸[𝑘
(𝑋,𝑌)] (4)
Among them, 𝐸[∙] Said expectations, 𝑘
(X,Y)
denote Gaussian kernel:
𝑘
(𝑋,𝑌) = 𝑒𝑥𝑝( −
()
)
(5)
𝜎 represents the kernel width, selected using
density estimation.
In actual calculation, because only some finite
samples can be obtained, the joint probability density
cannot be calculated, so the correlational entropy of
finite samples is estimated by the Parzen window
method:
𝑑
(
𝑋,𝑌
)
=
∑
𝑘
(𝑦
−x
)
(6)
The main advantages of the method adopted in
this paper are as follows: 1. Considering the
influence of abnormal data, correlational entropy
adopts kernel width to control the adjustable
window, which can effectively reduce the adverse
influence of outliers. 2. Considering the algorithm
complexity, the sample estimation method is simpler
than the traditional moment expansion method. 3.
From the geometric perspective, in the sample space,
the mean square error (MSE) in the least squares is
expressed as the 2-norm of the distance. In
correlational entropy theory, when the distance
between two points is close, it is equivalent to the
distance measured as 2 norm. With the increase of
the distance between two points, it is similar to 1
norm, and even tends to 0 norm eventually.
Therefore, correlational entropy has the
characteristic of suppressing abnormal data, and
introducing correlational entropy can enhance the
robustness of the training model.
3.2 Correlational Entropy
Autoregressive Model Construction
In the autoregressive model, the least mean square
error criterion is used to make the model more
sensitive to the singularity. Specifically, if there are
singular values in the data, the error will also be
expanded in a quadratic way, making the influence of
these samples far greater than that of other samples,
resulting in a huge gap between the two random
variables. Aiming at this problem, this paper
establishes a new regression model by transforming
the constraint function. For the convenience of
calculation, the equality constraint is
introduced 𝛷
𝛷=1, then the constraint problem is:
max
𝑘
x
−ΦY
𝑠.𝑡.Φ
Φ=1 (7)
Equation (11) is a nonlinear non-convex
constrained optimization problem, which cannot be
ICEMME 2022 - The International Conference on Economic Management and Model Engineering
70

solved directly. In this paper, we use the properties
of conjugate convex functions to solve the semi-
quadratic technique, define the matrix 𝑅=
𝑑𝑖𝑎𝑔(ω
) ,among them, ω
=
[−𝜔
,−𝜔
,⋯,𝜔
],Based on this equation (11), it
can be written as:
min
R
‖
X−ΦY
‖
s.t.Φ
Φ=1 (8)
The variable 𝑡is introduced to solve the non-
convex quadratic programming problem shown in
Equation (12), when the initial conditions 𝑅(0) =
𝑑𝑖𝑎𝑔(1) and t
=1,The above equation can be
transformed into a homogeneous constrained
programming problem:
min
‖
𝑡𝑋 − ΦY
‖
𝑠.𝑡.t
=1,Φ
Φ=1 (9)
And then:
min
[
𝛷
𝑡
]
Y
Y−Y
X
−X
Y
‖
Y
‖
Φ
𝑡
𝑠.𝑡.t
=1,Φ
Φ=1 (10)
Make 𝜉=[𝛷
𝑡]
,𝐵=
𝐼
×
0
00
, 𝐶=
Y
Y−Y
X
−X
Y
‖
Y
‖
,Equation (14) can be written as:
min
𝜉
𝐶𝜉
𝑠.𝑡.𝜉
𝐵𝜉 = 1 (11)
Using the semidefinite relaxation (SDR) method,
the objective function and constraints in Equation
(15) are respectively equivalent to:
𝜉
𝐶𝜉 = 𝑇𝑟{𝜉
𝐶𝜉} = 𝑇𝑟{𝐶𝜉𝜉
}
𝜉
𝐵𝜉 = 𝑇𝑟{𝜉
𝐵𝜉} = 𝑇𝑟{𝐵𝜉𝜉
} (12)
Where Tr denotes the trace of the matrix and
defines the matrix:
𝛺=𝜉𝜉
. (13)
Ω is a symmetric positive semidefinite (PSD)
matrix with rank 1, and the final semidefinite
relaxation optimization constraint is obtained:
min
𝑇𝑟{𝐶𝛺}
s.t.𝑇𝑟
{
𝐵𝛺
}
=1,𝛺≥0 . (14)
The eigendecomposition of matrix Ω can be
expressed as:
𝛺=𝑉R𝑉
. (15)
Among them, 𝑉=[𝑣
,𝑣
,⋯,𝑣
] the
Ω eigenvector of lambda, 𝑅=𝑑𝑖𝑎𝑔(𝑟
,𝑟
,⋯,𝑟
)
represents the corresponding eigenvalue, Because
when rank is one, 𝛺(1) = 𝑟
𝑣
𝑣
the closest Ω,
Therefore, the following equation is used to
estimate ξ.
𝜉=
√
𝑟
𝑣
. (16)
The solution of the final regression prediction
parameter Φ is the first Ν values of ξ. Finally,
the coefficient value optimized by MCC model is
obtained, and the predicted value at the future
moment is obtained by the weighted sum of
historical data.
3.3 Open Set Identification Method
Traditional clustering uses Euclidean distance, which
treats the differences between different attributes of
samples equally, which will lead to the deviation of
its results. In this paper, the open set identification
method is integrated with the traditional clustering
method, which can effectively deal with the
singularity problem in clustering results.
Algorithm 1. Open set recognition algorithm that
makes stock price prediction more accurate.
Step 1: Randomly select K cluster centers, and
then calculate the correlational entropy distance
between each stock price index series and the
selected cluster centers.
Step 2: According to the principle of minimum
distance, each sample point is assigned to the
corresponding cluster center, and then a new cluster
center is obtained.
Step 3: For the new clustering results, this paper
calculates the correlational entropy distance from the
sample point to the cluster center, as well as the mean
and standard errors. Then we judge whether the
distance between each sample point and the cluster
center is within three standard deviations of the
cluster distance. After the judgment is completed, a
new cluster center is calculated for the sample points
in its range.
Step 4: Continue to perform steps 2)~3) until the
loop terminates. For sample points that are not within
the scope, this paper considers that they do not
belong to any category and are left for subsequent
processing.
The open set identification method used in this
paper can effectively identify outliers. The reason is
that the traditional clustering method does not add
boundary constraints to the clustering results, which
leads to more outliers. However, the proposed
method can solve this problem well.
Research on Stock Price Prediction Based on Autoregressive Model of Maximum Corentropy Criterion
71

4 EXPERIMENTAL RESULTS
AND ANALYSIS
4.1 Selection of Experimental Data and
Evaluation Index
The experimental data in this paper are the daily
closing price data of CSI 300 Index, Dow Jones
Index and Nikkei Index, and the data collection
parameters are shown in Table 1. In this paper, stock
price data are divided into groups of every 10 by
sliding window, and the data source is British
Finance and Economics.
Table 1: Experimental data.
Csi 300 Index Dow Jones Index Nikkei Index
Data
interval
2010.1.1 ~2020.12.30 2010.1.1~2020.12.31 2010.1.1~2020.12.32
The training set 2010.1.1~2019.12.31 2010.1.1~2019.12.32 2010.1.1~2019.12.33
The test set 2020.1.1~2020.12.31 2020.1.1~2020.12.32 2020.1.1~2020.12.33
The amount of data 2675 2769 2719
In this paper, mean absolute error (MAE) and
mean absolute percentage error (MAPE) are selected
as the evaluation indexes to measure the performance
of the model. The formula is shown in Table 2,Where
𝑋 =
(
𝑥
, 𝑥
,…, 𝑥
)
is the true value and 𝑋
=
(
𝑥
, 𝑥
,…, 𝑥
)
is the predicted value.
Table 2: Definition of evaluation indicators.
Measure Expression
MAE
1
𝑛
|𝑥
−𝑥
|
MAPE
100%
𝑛
𝑥
−𝑥
𝑥
4.2 The Effect of Order on the
Prediction Result
To explore order for predicting results, the influence
of this article by selecting different order number, for
different categories using maximal entropy regression
model to forecast, forecast range of the csi 300 index,
the dow Jones index, the nikkei 2010 January 1 to
December 31, 2019, the closing price data, including
Shanghai and shenzhen 300 index data for 2433, Data
volume for the Dow was 2,516 and for the Nikkei
2,476. The prediction results are shown in FIG. 3. In
FIG. 3 (A1), (B1) and (C1), the abscissa represents
the order, and the ordinate represents the MAE value.
In FIG. 3 (A2), (B2) and (C2), the abscissa represents
the data points, and the ordinate represents the index
data.
According to the above results, the following
conclusions can be drawn :(1) in FIG. 3, the
prediction errors of different orders (a1), (b1) and
(c1) are different, indicating that the order has a great
influence on the prediction results. (2) The minimum
points of curves in FIG. 3 (A1), (B1) and (C1) are
different, indicating that the optimal order of
different categories is different. (3) Gently
fluctuating curve order has little influence on the
prediction effect, such as C5 curve in FIG. 3 (A1) and
(A2), while sharply fluctuating curve order has great
influence on the prediction effect, such as C5 curve
in FIG. 3 (B1) and (B2).
4.3 Measure of Similarity
In order to verify the correlational entropy distance
performance used in this paper, the following
experiments were conducted to construct three
groups of fluctuation curves, calculate the distance
with different similarity measures, and compare the
performance of each similarity measure through the
results. Among them, the first set of volatility curves
contains singularities, the second set of volatility
curves contains time offset, and the third set of
volatility curves contains singularities and time
offset. The experimental results are shown in FIG. 4,
where the abscissa represents the data point and the
ordinate represents the value.In the figure d
(
X,Y
)
Euclidean
distance calculation is used,d
(
X,Y
)
is
ICEMME 2022 - The International Conference on Economic Management and Model Engineering
72

Figure 3: Order selection and class mean line.
calculated using Rangelis distance, d
(
X,Y
)
indicates the use of dynamic bending distance
calculation, d
(
X,Y
)
is calculated using
correlational entropy.
From Fig.4, it is obvious that:(1) as can be seen
from FIG. 4 (a), for sequences containing
singularities. The correlational entropy measure
distance is 0.32, which is the smallest, indicating that
correlational entropy can obviously eliminate the
influence of singular points. (2) As can be seen from
FIG. 4 (b), for the time offset series. The correlational
entropy measure distance is 0.44, which is the
smallest, indicating that this method can better deal
with the problem of time offset. (3) As can be seen
from FIG. 4 (c), for the sequence containing time
offset and singular points, the correlational entropy
measure distance is 0.51, with the minimum distance,
indicating that the proposed method can effectively
deal with the problem of singular points and time
offset.
Figure 4: Results of different similarity measures.
4.4 Correlational Entropy
Autoregressive Model
In order to verify the model adopted by the
performance, this article USES the following scheme
to forecast experiments, using clustering to construct
a regression model, do not use the open set after build
regression model, clustering using open set after three
kinds of schemes to build regression model, and
compare forecast results, to validate the clustering
method and open set method for predicting effect for
ascension. The data used are the daily closing price
data of CSI 300 index from January 1 to December
31, 2020, with a volume of 243. Meanwhile, to verify
the performance of the proposed model, the results
are compared with the prediction results of statistical
models and machine learning models. The results are
shown in Table 3 and Table 4. The rows in the table
represent the prediction scheme used, the columns
represent the error indexes, and the optimal results
are represented in bold,In the table, A represents The
regression model was constructed without clustering
scheme, B represents Open set is not used to build
regression model after clustering scheme, and C
represents Open set was used to construct regression
model after clustering scheme.
Research on Stock Price Prediction Based on Autoregressive Model of Maximum Corentropy Criterion
73

Table 3: Comparison of errors.
Prediction method MAE MAPE
A 92.175 9.64
B 76.512 7.76
C 40.964 0.0474
From Table 3, it is obvious that:(1) the effect of
constructing regression model after clustering is
significantly better than that of constructing
regression model without clustering, indicating that
the addition of clustering method can effectively
improve the accuracy of prediction. The reason is that
the stock price fluctuation curve is different between
categories, so a single regression model is not applied.
(2) The effect of using open set method to construct
regression model after clustering is significantly
better than that of not using open set method. The
reason is that the traditional clustering method can not
deal with the outlier problem well. In this paper, the
accuracy of clustering results can be effectively
improved after the clustering results are constrained.
Table 4: Results compared with statistical models and
machine learning models.
Prediction metho
d
MAE MAPE
Machine
learning
Adaptive RNN 57.621 6.6
GRU 59.225 6.86
Statistical
models
AR 63.695 7.44
ARIMA 60.727 7.08
GARCH 61.03 7.13
Our proposed MCC-AR 40.964 4.74
From Table 4, it is obvious that :(1) the proposed
method is superior to the machine learning method.
The reason is that the maximum corentropy criterion
is used as the constraint function, and gaussian
corentropy is used to limit the infinite expansion of
errors, which effectively reduces the influence of
singularities. Moreover, the machine learning model
uses a large amount of data in training and testing, and
the method in this paper can get better prediction
results even when the sample size is small. (2) The
method in this paper is superior to the statistical
model method. The reason is that the statistical model
uses the same order to predict different fluctuations,
and does not consider the difference between curves.
5 CONCLUSION
In order to eliminate the influence of singularities on
stock price prediction, a maximum correlational
entropy criterion autoregressive model is proposed.
The experimental results show that: 1. Using the
clustering strategy, the price curves with similar
change trends are clustered into a group, and a
regression model is constructed for price prediction,
which effectively improves the prediction accuracy.
2. Correlational entropy is used to measure the
similarity of any two curves. Essentially, two curves
are taken as random variables to measure the
similarity based on the difference of their probability
distribution, which can better overcome the influence
of singularities. 3. In this paper, the open-set
recognition strategy is adopted to add boundary
constraints to the clustering results, which makes the
clustering results more accurate and can better deal
with the problem of singularity classification in the
clustering process. 4. In this paper, the maximum
corentropy criterion is used as the constraint
function, and the Gaussian corentropy is used to limit
the infinite expansion of the error, which effectively
weakens the influence of singularity points on the
curve similarity measurement.
To sum up, the correlational entropy measure
used in this paper can better deal with the singularity
problem in stock series. Correlational entropy
autoregressive model can deal with the singularity
problem in stock prediction. The open-set strategy
and the strategy of constructing a regression model
for each class can effectively improve the prediction
accuracy. The experimental results show that the
method proposed in this paper has a good prediction
effect.
ACKNOWLEDGEMENTS
This work is supported by National Natural Science
Foundation of China (62176140, 61972235)
REFERENCES
Chen Rongda, Yu Jingjing, Xu Min, Dang Chao, Huang
Jiahao. 2022. Research on the Influence of Investors'
Local Preference on the Information Efficiency of
Stock Market. J. Systems Engineering Theory and
Practice.
Jordan S J, Vivian A, Wohar M E. 2018. Stock returns
forecasting with metals: sentiment vs. Fundamentals. J.
The European Journal of Finance, 24(6).
Ji Jingyu,Li Deyuan. 2021. Application of autoregressive
tail-index model to China's stock market. J. Statistical
Theory and Related Fields,5(1).
Khoojine A S, Han D. 2020. Stock price network
autoregressive model with application to stock market
ICEMME 2022 - The International Conference on Economic Management and Model Engineering
74

turbulence. J. The European Physical Journal B, 93(7).
Li X J, TANG P. 2022. Stock price forecasting based on
technical analysis, fundamental analysis and deep
learning . J. Journal of Statistics and Decision,38(02).
Nti I K, Adekoya A F, Weyori B A. 2020. A systematic
review of fundamental and technical analysis of stock
market predictions. J. Artificial Intelligence Review,
53(4).
SANTOSA,R. G., CHRISMANTO, A. R., & LUKITO, Y.
2022.STOCKS Forecasting exploration on LQ45 index
USING ARIMA (p, d, q) model. J. Journal of
Theoretical and Applied Information
Technology,100(13).
Tash, F.H., & Modarres, M. 2011.Modeling volatility of
financial markets using an AR/GARCH model in
Tehran stock exchange. C. In Mechanical, Industrial,
and Manufacturing Engineering Proceedings of 2011
International Conference on Mechanical, Industrial, and
Manufacturing Engineering.
Wu Fei, Hu Huizhi, Lin Huiyan, Ren Xiaoyi.
2021.Corporate Digital Transformation and Capital
Market Performance: Empirical evidence from Stock
liquidity. J. Managing the world,37(07).
Wang Y, Guo Y. 2020. Forecasting method of stock market
volatility in time series data based on mixed model of
ARIMA and XGBoost. J. China Communications,
17(3).
Xiao C, Xia W, Jiang J. 2020. Stock price forecast based on
combined model of ARI-MA-LS-SVM. J. Neural
Computing and Applications, ,32(10).
Ye, Tian. 2017. Stock forecasting method based on wavelet
analysis and ARIMA-SVR model. C. International
Conference on Information Management,102-106.
Zeqiraj V, Sohag K, Soytas U. 2020.Stock market
development and low-carbon economy: The role of
innovation and renewable energy. J. Energy Economics
91: 104908.
Zhou Jun. 2021. Policy adjustment and Abnormal volatility
of Stock market . J. Shanghai Finance.(08).
Zhang D, Lou S. 2021. The application research of neural
network and BP algorithm in stock price pattern
classification and prediction. J. Future Generation
Computer Systems, 115.
Zhang H. 2018.The forecasting model of stock price based
on PCA and BP neural network. J. Journal of Financial
Risk Management,7(4)
Research on Stock Price Prediction Based on Autoregressive Model of Maximum Corentropy Criterion
75
