
Evaluation of Health Service Capacity and High-Quality
Development Path in China
Guorong Chai
1
and Jiaying Wang
2
1
School of Management, Lanzhou University, Lanzhou, Gansu,730000, China
2
Hospital Management Research Center, Lanzhou University, Lanzhou, Gansu, 730000, China
Keywords: Health Services Capacity, High-Quality Development, Coupling Coordination Degree, Intelligent Healthcare.
Abstract: On the basis of analyzing the connotation of high-quality development of health service capacity, this study
collects the medical resource data of 31 provinces (municipalities) in China from 2012 to 2019. The evaluation
of China's health service capacity is conducted using the rank-sum ratio method, the coupling coordination
degree model, and the cloud model, and relevant optimization paths are put forward. The results show that
the inter-regional health service capacity is constantly improving and stabilizing, but regions including Anhui,
Hainan, and Heilongjiang still face such problems as uncoordinated development of health service volume,
health service efficiency, and human resources. Based on the current development trend of health service
intellectualization, this paper puts forward optimization paths for health service capacity at the national,
regional, and institutional levels with the aid of digital healthcare.
1 INTRODUCTION
Over the past two years, we have been living under
the great impact of the major public health
emergencies marked by COVID-19, which also has
brought great challenges to the global governance
system and governance capacity. Notably, problems
such as fragile health service capacity and
unreasonable resource allocation were exposed in
some countries during the anti-pandemic period
(Ilardi, 2020; Patel, 2020). It is undeniable that the
lack of a single indicator of health service capacity
may be explained by the "hospital runs" during
emergencies such as the outbreak of the pandemic
and the surge in the number of confirmed cases.
However, it also exposes the poor coordination of
multi-indicator development of national health
service capacity, causing difficulty in forming a
strong health service capacity network. As people's
health has been put at the center of the world
*
Corresponding author
Chai Guorong (1976-), professor, whose main
research interests are digital health care and health
care management. Wang Jiaying (1993-), doctoral
student, whose main research interests are digital
health care and health care management.
development agenda and becomes a comprehensive
measure of economic and social development and
people's wellbeing, China has gradually focused on
optimizing the high-quality development of health
service capabilities (Uner, 2020). To this end,
relevant policies issued by China in November 2021
emphasize the need to strengthen health services
capacity and benchmarks (General office of the State
Council, 2021). Therefore, optimizing and improving
health service capacity is an important part of China's
high-quality development and an important link to
improving national public service capacity.
Currently, the research on high-quality
development in China mainly focuses on connotation
and measurement. There is no unified definition of
high-quality development in the academic circle, nor
a unified standard for measurement (Yu, 2019). On
the contrary, more attention is paid to the multi-
indicator coordinated development state with equal
emphasis on development speed and quality,
stability, and balance (Shi, 2021; Jin, 2018). The
Chai, G. and Wang, J.
Evaluation of Health Service Capacity and High-Quality Development Path in China.
DOI: 10.5220/0012041600003620
In Proceedings of the 4th International Conference on Economic Management and Model Engineering (ICEMME 2022), pages 663-671
ISBN: 978-989-758-636-1
Copyright
c
2023 by SCITEPRESS – Science and Technology Publications, Lda. Under CC license (CC BY-NC-ND 4.0)
663

existing research deems health service capacity as the
maximum degree of non-material service that can
provide actual medical output, with patients and
special groups as the main service objects, and
medical technologies, equipment, diagnosis and
treatment environment, and information technology
as basic service means. It mainly includes hospital
resource allocation, technical personnel, work
efficiency, diagnosis and treatment, technical level,
and other abilities (Wang, 2021). Scholars both in
China and abroad have conducted studies on health
service capacity. Foreign countries pay more
attention to the evaluation of emergency health
service provision (Alzahrani, 2021), while most
domestic studies are conducted from the perspective
of resource allocation and analyze the equalization of
health services at provincial, municipal, and primary
levels.
Overall, the existing research still has the
following shortcomings. First of all, theoretical
research is difficult to adapt to the current
development trend. The impact of the pandemic has
exposed the vulnerability of health service capacity,
so we should pay more attention to the formation of
a strong health service capacity network rather than
the equal allocation of medical resources. Second, the
existing research still leans toward the "hard"
indicator of facilities and pays little attention to the
"soft" indicator of resources. Moreover, the indicator
composition mostly chooses individual perception,
leaving objectivity doubtful. Finally, the elements of
health service capacity are interrelated as a network,
but no research regards them as a whole, ignoring the
coordination among the elements. The important role
of medical institutions in shaping and improving their
service capacity is also ignored.
Given the above analysis, this study constructs an
all-around indicator system for the evaluation of
health service capacity in 31 provinces
(municipalities) in China and further analyzes the
coupling coordination degree among these indicators
and the advantageous and disadvantageous indicators
of different regions. On this basis, this paper puts
forward the optimization path for health service
capacity, which provides a theoretical reference for
promoting the in-depth and diversified development
of health services.
2 CONSTRUCTION AND
CALCULATION OF
EVALUATION INDICATOR OF
HEALTH SERVICE CAPACITY
2.1 Construction of Evaluation
Indicator System
Accurately grasping the connotation of high-quality
development of health services capacity is the basis
of constructing a scientific evaluation indicator
system. It is considered that promoting the high-
quality development of health service capacity is a
major strategic choice for China to shore up weak
spots in consumer service industries and improve
people's quality of life in the face of the bottleneck of
regional resource allocation and complex and
changeable emergencies. The high-quality
development represents the optimized state of the
service capacity structure, which is closely related to
service facilities, service quality, human resources,
and supportive policies. Health service capacity is
affected by multiple internal and external indicators.
The service capacity of medical institutions in
different provinces is not only influenced by external
indicators such as regional economic development
and management policies; it is also affected by
internal indicators such as service facilities, service
efficiency, and human resources; moreover, the
development of the regional information technology
can also serve as a catalyst (Whitley, 2020).
According to the nature of indicators, they can be
divided into "hard indicators" and "soft indicators."
The former is relatively stable, including the number
of visits and the number of facilities; the latter is a
supplement to hard indicators and has certain
variability (Ni, 2010), including human resources,
information technology, etc. The interaction of "hard
indicators" and "soft indicators" destabilizes the
development of health service capacity, the latter of
which causes a huge disparity among different
provinces (municipalities). Therefore, this paper,
from the perspective of systemic analysis, established
an evaluation indicator system for evaluating the
coordinated development of "hard indicators" and
"soft indicators."
By combing the existing research results, five
evaluation dimensions were determined, including
the quality, efficiency, scope, and human resources of
hardware facilities and business operations. Given
the scarce recent research results in this aspect, this
paper further tested the rationality of the evaluation
indicator using the expert interview method to avoid
ICEMME 2022 - The International Conference on Economic Management and Model Engineering
664

omissions. Six administrative staff and nine medical
practitioners from the First and Second Hospitals of
Lanzhou University and Gansu Provincial People's
Hospital were selected for four anonymous
questionnaires and interviews, which took two
weeks. These interviews mainly introduced the
purpose and significance of the research to experts,
which in turn let us understand the internal evaluation
process and standards of services systematically and
draw opinions on indicator selection from
professionals. To further ensure the scientific
effectiveness of indicator selection, we consulted five
administrative staff and medical practitioners from
the National Health and Family Planning
Commission, Health Commission of Guangdong
Province, Huashan Hospital of Fudan University, and
the Third Affiliated Hospital of Sun Yat-sen
University, and confirmed the final evaluation
indicator system (Table 1).
Table 1: Selection of evaluation indicators for health service capacity.
Primary
indicato
r
Secondary
indicators
Tertiary indicators Indicator
attribute
Expert interview
results
Medical
treatment
Service
capability
Health
service
volume
Number of outpatient visits (A
1
)
+ 90% (18 persons)
Number of emergency visits (A
2
)
+ 95% (19 persons)
Number of health examinations (A
3
)
+ 85% (17 persons)
Number of discharged patients (A
4
)
+ 85% (17 persons)
Number of hospital admissions (A
5
)
+ 45% (9 persons)
Health
service
efficiency
Discharge rate per bed (B
1
)
+ 100% (20 persons)
Average number of visits per capita (B
2
)
+ 85% (17 persons)
Number of inpatients per doctor per day
(B
3
)
+ 80% (16 persons)
Average length of stay in hospital (B
4
)
+ 40% (8 persons)
Health
service
facilities
Number of hospital beds per 10,000
p
opulation (C
1
)
+ 100% (20 persons)
Occupancy rate of hospital beds (C
2
)
+ 85% (17 persons)
Number of medical institutions per 10,000
p
opulation (C
3
)
+ 60% (12 persons)
Health
service
human
resources
Practicing (assistant) physicians per 10,000
p
opulation (D
1
)
+ 100% (20 persons)
Practicing physicians per 10,000 population
(D
2
)
+ 100% (20 persons)
Registered nurses per 10,000 population
(D
3
)
+ 90% (18 persons)
Pharmacists per 10,000 population (D
4
)
+ 85% (17 persons)
Technicians per 10,000 population (D
5
)
+ 75% (15 persons)
While establishing the indicator system, in an
effort to eliminate the influence of the regional
population base as much as possible and reduce the
preference of medical workers in the interview, we
treated these indicators as relative indicators and used
the data from 2012 to 2019 to test the validity of the
system. The chronological data showed that the
dimensions of the overall evaluation indicator system
were set reasonably, but some indicators were still
required to be adjusted or deleted. Based on the
integration of expert interview results and the validity
test of the indicator system, indicators A
5
, B
4
, and C
3
were removed in this paper. The reasons for deletion
are as follows: The hospitalization rate (A
5
) is
considered to be related to the discharge rate (A
4
),
both indicating the sickness rate and the facility
carrying capacity of medical institutions. The average
length of stay in a hospital (B
4
) is more relevant to
Evaluation of Health Service Capacity and High-Quality Development Path in China
665

the specific conditions of the patient, and the number
of medical institutions per 10,000 population (C
3
) is
not explanatory enough as there may be big
differences in the level of medical institutions. As
such, the above indicators have a low degree of
interpretation of service efficiency and have not
passed the validity test, so they are not considered for
selection. The final indicator system comprises 14
evaluation indicators selected from four dimensions:
health service volume, service efficiency, medical
facilities, and human resources.
2.2 Analysis of Data Sources
This paper takes China's 31 provincial administrative
regions as the research object (except Hong Kong,
Macao, and Taiwan) within the period of 2012-2019.
The data involved in the research indicators come
from the National Population Health Data Center and
China Statistical Yearbook. Based on the research
topic, the author checked, screened, and integrated
the data, supplemented the missing data to ensure the
integrity of the sample, and carried out an equivalent
performance of indicators to ensure the validity and
accuracy of the data.
2.3 Construction of Evaluation Model
Rank-sum ratio (RSR) was used to measure the
ranking and grading of health service capacity in 31
provinces (municipalities). The RSR method
integrates the advantages of classical parametric
statistics and modern nonparametric statistics, and
the errors of objective weighting and method
simplification can be offset among regions.
Moreover, using the non-integer rank-sum ratio
method in the rank ordering can address the defects
of easy loss of quantitative information of original
indicator values, thus improving the reliability of
results (Li, 2019). For benefit indicators, the rank
ordering was made according to Formula (1), and
RSR distribution was determined by Formula (2).
After the RSR correction values were output through
regression validation, the ranking and evaluation
results were obtained.
1
11
min( , ,..., )
1( 1)
max( , ,..., ) min( , ,..., )
ij j nj nj
ij
j
nj nj j nj nj
XXXX
Rn
X
XX XXX
−
=+ −
−
(1)
1
1
m
ijij
j
RSR w R
n
=
=
(2)
The coupling coordination degree model was
used to measure the correlation degree and
coordinated development level among multiple
interactive indicators of regional health service
capacity. The four functions in Formula (3) are the
comprehensive evaluation indicators of health
service capacity, and C is the coupling degree. In
Formulas (4) and (5), T is the coordination indicator,
and D is the coupling coordination degree (Kong,
2021).
() ()
4
1/ 4
4{() () ()/ () () () }C fxgyhzlw fxgyhzlw=× × × × + + +
(3)
() ()
() ( )Tafx gy hz lw
βλω
=+ ++
(4)
*
D
CT=
(5)
The cloud model was used to measure the
imbalance degree of health service capacity
development in vulnerable areas and provides path
guidance for optimizing service capacity. The model
is an uncertain transformation model between
qualitative concepts and their quantitative
representations based on traditional fuzzy
mathematics and probability statistics. It overcomes
the shortcoming of randomness in the existing
evaluation and realizes the effective evaluation of
objects. Generally, the cloud model sets U as the
domain of X, C as a qualitative concept of U, and
sample x a random representation of qualitative
concept C, then the certainty of X to C is a random
number with stable tendency (Li, 2014), as expressed
in Formula (6).
[
]
0,1 , , ( )UxUxx
μμ
→∀∈→:
(6)
3 EVALUATION OF HEALTH
SERVICE CAPACITY
3.1 Comprehensive Evaluation of
Health Service Capacity
According to the designed evaluation principle, we
first made a preliminary analysis of the overall
evolution of health service capacity in 31 provinces
(municipalities) in China from 2012 to 2019. The
analysis results showed that the regression equation
had a good fitting effect, with R
2
> 0.95 and P <
0.001. In the fitted critical value, the corresponding
critical value of each grade was increasing
continuously. The critical value of the fifth grade
(optimal grade) rose from 0.686 in 2012 to 0.732 in
2019, and that of the first grade (lowest grade) rose
from 0.130 to 0.153. This indicated that the overall
health service capacity among regions was enhanced
in fluctuation, but it still showed a large difference in
the level of health service capacity among different
regions (Table 2).
ICEMME 2022 - The International Conference on Economic Management and Model Engineering
666

Table 2: RSR fitting thresholds and number of classifications.
Grade 2012 2013 2014 2015 2016 2017 2018 2019 Number
1 < 0.13 < 0.11 < 0.09 < 0.07 < 0.08 < 0.08 < 0.11 < 0.15 1
2 0.13~ 0.11~ 0.09 ~ 0.07~ 0.08~ 0.08~ 0.11~ 0.15~ 7
3 0.32~ 0.30~ 0.28~ 0.27~ 0.28~ 0.29~ 0.30~ 0.35~ 14
4 0.50~ 0.48~ 0.48~ 0.47~ 0.49~ 0.49~ 0.50~ 0.54~ 7
5 0.69~ 0.66~ 0.67~ 0.67~ 0.70~ 0.69~ 0.70~ 0.73~ 2
3.2 Difference Evaluation of
Coordinated Development of
Health Service Capacity
The coordinated development of the indicators of
health service capacity is the premise and key to
optimal development, so the coordination of multiple
indicators should not be ignored during the
evaluation. The coupling coordination degree
analysis can further measure the coordinated
development level of multiple interactive indicators
of inter-regional health service capacity. This paper
subdivided the coupling coordination degree into ten
levels, as shown in Table 3, in accordance with the
overview classification
of Cong et al. (2019). (Cong,
2019)
Table 3: Criteria for the classification of coupling coordination level.
Coupling
coordination D-
value interval
Grade
Degree of
coordination
Coupling
coordination D-value
interval
Grade
Degree of
coordination
(0.0~0.1) 1 Extreme disorder (0.5~0.6) 6 Barely Coordinated
(0.1~0.2) 2 Severe disorder (0.6~0.7) 7 Primary coordination
(0.2~0.3) 3
Moderate
disorder
(0.7~0.8) 8
Intermediate
coordination
(0.3~0.4) 4 Mild disorder (0.8~0.9) 9 Good Coordination
(0.4~0.5) 5
Nearly
dysfunctional
(0.9~0.10) 10 Quality coordination
The analysis results showed that the difference in
coupling coordination degrees of health service
capacity in the study areas was shrinking year by
year, China's health service capacity was improving
year by year, and the evolution path was steadily
optimized. Provinces (municipalities) with a high
coordination level of health service capacity include
Beijing, Shanghai, Zhejiang, etc., in contrast to other
regions such as Xizang, Shanxi, and Anhui.
However, the coupling coordination of regional
health service capacity changed little, which
generally remained at about two degrees(Figure 1).
The research results of coupling coordination degree
of health service capacity in 31 provinces
(municipalities) in 2019 are shown in Table 4, in
which the C value of each place is high, with the
maximum value reaching 0.99 and most around 0.8.
It can be seen that the multi-indicators of health
service capacity are closely related and require
coupling coordinated development. Only in areas
with their coupling coordination degree at a primary
level and above, the coordination indicator T≥0. 60;
in most other areas, the T value is relatively small due
to poor coordination development.
Evaluation of Health Service Capacity and High-Quality Development Path in China
667

Figure 1: Differences in coupling and coordination scores of medical service capacity among 31 Chinese provinces
(municipalities) in 2012 and 2019.
Table 4: 2019 Healthcare Service Capacity Coupling Coordination Values.
Region
C
value
T
value
D value
Coordina-
tion level
Region
C
value
T
value
D
value
Coordi
nation
level
Beijing 0.99 0.82 0.90 10 Fujian 0.88 0.35 0.55 6
Shanghai 0.95 0.83 0.89 9 Guangxi 0.75 0.40 0.55 6
Zhejiang
0.97 0.77 0.86 9 Qinghai 0.97 0.29 0.53 6
Jiangsu 0.96 0.53 0.71 8 Gansu 0.82 0.32 0.51 6
Shanxi 0.98 0.47 0.68 7 Liaoning 0.96 0.27 0.51 6
Sichuan
0.87 0.51 0.67 7 Hunan 0.77 0.33 0.51 6
Ningxia 0.97 0.46 0.67 7 Hainan 0.91 0.26 0.48 5
Xinjiang 0.90 0.49 0.67 7 Hebei 0.80 0.26 0.45 5
Guangdong
0.86 0.48 0.64 7 Jiangxi 0.66 0.29 0.44 5
Hubei
0.83 0.48 0.63 7 Neimenggu 0.90 0.21 0.44 5
Chongqing 0.88 0.45 0.63 7 Jilin 0.90 0.21 0.43 5
Shandong
0.96 0.40 0.62 7 Anhui 0.47 0.25 0.34 4
Guizhou
0.89 0.41 0.60 7 Heilongjiang 0.61 0.16 0.31 4
Henan
0.84 0.42 0.59 6 Shanxi 0.52 0.15 0.28 3
Tianjin
0.98 0.35 0.59 6 Xizang 0.37 0.07 0.16 2
Yunnan 0.80 0.39 0.56 6
(Comments: C value=Coupling degree,T value=Coordination index, D value= Coupling coordination degree )
ICEMME 2022 - The International Conference on Economic Management and Model Engineering
668
3.3 Evaluation of Health Service
Capacity in Vulnerable Areas
The cloud model evaluation is mainly used to
measure the health service capacity of vulnerable
areas and provide guidance for improving the health
service capacity in the future. Based on the previous
research results, the eight provinces (municipalities)
with lower rankings in the comprehensive evaluation
and poor indicator coupling degrees in 2019 are
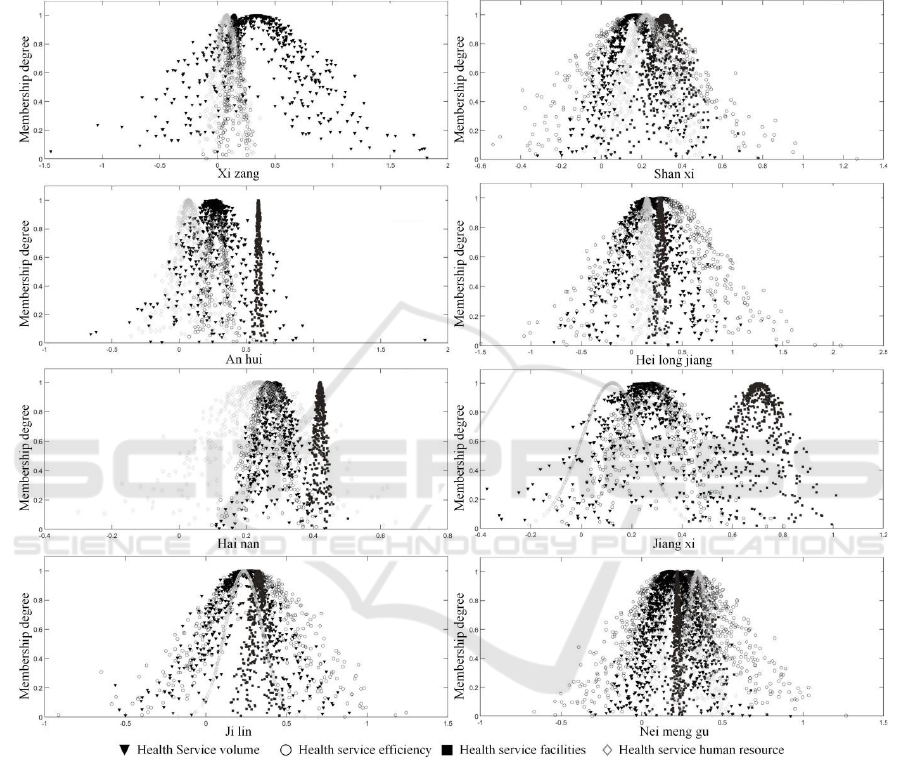
Anhui, Hainan, Heilongjiang, Jiangxi, Jilin,
Neimenggu, Shanxi, and Xizang.
Figure 2: Cloud Model Evaluation in 8 provinces (municipalities) in 2019(Group pictures).
The cloud model evaluation map for the
indicators of each place is shown in Figure 2. Among
the eight regions, Hainan, Jiangxi, Neimenggu, and
Jilin are on the verge of unbalanced development. As
shown in the figure, the health service efficiency in
Hainan is low and human resources are scarce; the
service efficiency and volume in Jiangxi are
undesirable, with the shortage of human resources
being the most urgent problem to be solved; the
service volume, efficiency, and facilities of health
service capacity in Neimenggu are poor. The
coupling degree of the four indicators in Jilin is high,
yet the overall development is interior and close to
imbalance. The health service capacity of Anhui and
Heilongjiang demonstrates slightly unbalanced
development, in which the evaluation results of
human resources and service volume in Anhui are
less satisfactory. The development status of
Heilongjiang and Jilin is similar, which shows
balanced yet inferior evaluation results. The health
service capacity of Shanxi is moderately unbalanced,
with an uncoordinated development of service
efficiency, facilities, service volume, and human
resources. The development of health service
Evaluation of Health Service Capacity and High-Quality Development Path in China
669

capacity in Xizang is severely imbalanced at a
relatively low overall level.
4 RESULTS DISCUSSION
The evaluation results of health service capacity
show the health service capacity of 31 provinces
(municipalities) in China from 2012 to 2019 has been
gradually enhanced, and the coordinated
development level of different indicators has been
continuously improved. However, it is clear that
although some regions in Northeast China, Northwest
China, and Central China have gotten rid of the
uneven distribution of basic medical resources, they
still face the plight of poorly coordinated
development between the soft and hard resources.
Therefore, research on health service capacity should
comprehensively consider the organic and
coordinated development of resources under
different development levels. At present, China
demands not only high-quality development of
service capacity, but also normalized Covid-19
prevention and control. The superposition of multi-
level development requirements increases the
difficulty of optimizing health service capacity to a
certain extent. Therefore, we should also consider the
impact of the environment on service capacity in real
development. In this context, the research on the
effectiveness of resource allocation is insufficient;
we should consider improving the hierarchical
medical system from the source.
5 OPTIMIZATION PATH FOR
HEALTH SERVICE CAPACITY
A holistic approach should be adopted to promote
high-quality development in the healthcare industry
through high-quality services. Advantaged areas
should continue to explore and optimize new ways of
health services; stable areas should learn from the
experience of advantageous areas to optimize their
service capability; vulnerable areas should focus on
the coordinated distribution of resources to improve
the service level in the region. Overall, health service
capacity is still in a complex social system and
affected by multiple indicators, so we should choose
the optimization path according to various indicators
and reality. Currently, the "intelligence" transition of
medical institutions can not only improve service
quality and efficiency, but also further upgrade
refined medical management, which can optimize the
allocation of medical resources and improve the
public's experience of medical care. Therefore, this
study put forward specific optimization paths from
national, regional, and institutional levels: (1) The
country should pay attention to the intelligent
evaluation of medical institutions and ameliorate
relevant policies, so as to moderately promote the
high-quality development of Internet medical
services and "Internet + nursing services" and
enhance the effectiveness of macro-guidance
policies. (2) Regions should increase financial
investment, establish integrated operation
management system, intelligent resource
management system, etc. to implement fine
management of resources so as to avoid blind
investment and optimize the allocation of
disadvantaged resources. (3) Medical institutions
should step up the construction and strengthen
internal and external management to improve health
service quality and efficiency.
FUND PROJECT
A major project of the National Social Science
Foundation of China, "Research on China's Digital
Power Strategy and Implementation Path in the New
Era" (21&ZD163).
REFERENCES
Alzahrani FA, Ahmad M, Nadeem M, et al. (2021)
Integrity Assessment of Medical Devices for
Improving Hospital Services J. Computers Materials &
Continua, 67: 3619-3633.
Cong X N. (2019) Expression and mathematical property
of coupling model, and its misuse in geographical
science J. Economic Geography, 39: 18-25.
General office of the State Council. (2021) General Office
of the State Council forwarding notice of national
development and reform commission on promoting
customer service industry to strengthen weak links and
improve people's quality of life [EB/OL]
http://www.gov.cn/zhengce/content/2021-
11/02/content_5648192.htm.
Ilardi A, Chieffi S, Iavarone A, et al. (2020) SARS-CoV-2
in Italy: Population Density correlates with Morbidity
and Mortality J. Japanese journal of infectious
diseases, 71: 61-64.
Jin B. (2018) Economics research on "high-quality
development" J. China Industrial Economics, (04): 5-
18.
Kong Y, Liu J. (2021) Sustainable port cities with coupling
coordination and environmental efficiency J . Ocean &
Coastal Management, 205 :1-13.
ICEMME 2022 - The International Conference on Economic Management and Model Engineering
670

Li M, Sun H, Singh V P, et al. (2019) Agricultural Water
Resources Management Using Maximum Entropy and
Entropy-Weight-Based TOPSIS Methods J. Entropy,
21 :1-17.
Li D, Du Y. (2014) Artificial Intelligence with Uncertainty
2nd Edition M. National Defense Industry Press,
Beijing.
Ni X, Li J Y. (2010) Public service performance evaluation
model of government performance: effective or
ineffective? — Review on controversy over validity of
public service performance evaluation J. Journal of
Renmin University of China, 24: 108-116.
Patel R J, Kejner A, Mcmullen C. (2020) Early institutional
head and neck oncologic and microvascular surgery
practice patterns across the United States during the
SARS-CoV-2(COVID19) pandemic J.Head And Neck,
42: 1168-1172.
Shi D, Zhao J B, Deng Z (Economic Daily),
2021.Understanding the connotation of high-quality
development from three aspects [EB/OL]..
http://theory.people.com.cn/n1/2019/0909/c40531-
31343036.html.
Uner M M, Cetin B, Cavusgil S T, et al. (2020) On the
internationalization of Turkish hospital chains: A
dynamic capabilities perspective J. International
Business Review, 29: 1-11.
Wang Z Q, Jiang W Y, Song X B, Gao Y and Yu S. (2021)
High-quality development and comprehensive
evaluation of China's macro accounting information
quality J. Accounting Research, (04): 39-48.
Whitley G A, Hemingway P, Law G R, et al. (2020) The
predictors, barriers and facilitators to effective
management of acute pain in children by emergency
medical services: A systematic mixed studies review J
.Journal of Child Health Care, 25: 481-503.
Yu Y Z, Yang X Z and Zhang S H. (2019) Spatial-temporal
transformation characteristics of China's economy
from high-speed growth to high-quality development J.
The Journal of Quantitative & Technical Economics,
36: 3-21.
Evaluation of Health Service Capacity and High-Quality Development Path in China
671
