
Adding Time and Subject Line Features to the Donor Journey
Greg Lee
1
, Ajith Kumar Raghavan
2
and Mark Hobbs
2
1
Jodrey School of Computer Science, Acadia University, 27 University Avenue, Wolfville, Canada
2
Fundmetric, 1526 Dresden Row, Halifax, Canada
Keywords:
Machine Learning, Time Series Data, Charitable Giving.
Abstract:
The donor journey is the path a charitable constituent takes on their way to making a donation. Charities
are moving towards more electronic communication and most appeals are now sent via email. The donor
journey can be followed electronically, monitoring constituent and charity actions. Previous research has
shown that it is possible to use past actions of a donor to predict their next gift within $25. We build on this
research by adding new features that capture the time between actions, as well as new email features, including
subject lines features in such a way as to isolate their effect on model accuracy. These additions show a small
improvement in accuracy of recurrent neural network models for most charities, showing these features do
indeed help deep learning methods understand the donor journey.
1 INTRODUCTION
On a day to day basis, the most asked question within
charities is typically “What do we do next?”, and this
question is asked about individual constituents (peo-
ple in the charity’s database). The goal of a charity is
to maximize how much money it raises in the long
term, so simply answering this question with “ask
them for money” is an oversimplification, since con-
stituents are not going to give gifts to a charity every
day. Instead, the charity might want to send a thank
you letter (an example of stewardship) or wait and let
the constituent take an action on their own, such as
visiting the charity’s website.. While sending a solic-
itation email is likely the right action at some point
along the donor journey, it is not necessarily the right
action at any given time.
The donor journey is the set of chronological ac-
tions a constituent and a charity take while the con-
stituent interacts with a charity. These include the
charity sending emails and the constituent opening
these emails, clicking links, and of course, donating
to the charity. Charities seek to optimize the donor
journey by performing the right actions at the right
times to maximize a donor’s lifetime value (i.e., max-
imize how much money the donor gives to the char-
ity). This is best achieved not only by maximizing do-
nations, but reducing costs and donor fatigue. All ap-
peals have associated costs which must be subtracted
from the revenue in order to calculate the actual gain
for the charity. In addition, when donors are asked
for money too often, they can become less likely to
donate in the future (Canals-Cerda, 2014).
Previous research on the donor journey (Lee et al.,
2022; Lee et al., 2020b) has shown that a constituent’s
donation amount can be estimated within a $25 mean
absolute error (MAE) using deep learning methods on
a chronological set of actions described by features
of their associated email. Sample data could be the
action opened with associated email features of 311
words, 3 paragraphs, and 2 variables. Window sizes
varied between 1 and 25 for these experiments. Here
the window size is how many past actions the deep
learning algorithm is allowed to consider when trying
to predict the donation amount.
We extend the work of the authors of (Lee et al.,
2022; Lee et al., 2020b) by adding time and email
subject line, and other email features for machine
learning in order to see if these features can help deep
learning algorithms improve their accuracy in terms
of predicting which sequence of actions will generate
the greatest lifetime value across a database of con-
stituents.
As the authors did in (Lee et al., 2022; Lee et al.,
2020b), we focus on email appeals and a sample char-
itable email as shown in Figure 1. Here, a university
foundation makes an appeal to members of the univer-
sity community (alumni, faculty, staff, and friends) in
an effort to help students adversely affected by the
COVID-19 pandemic. This email was one of 27 sent
Lee, G., Raghavan, A. and Hobbs, M.
Adding Time and Subject Line Features to the Donor Journey.
DOI: 10.5220/0011620900003393
In Proceedings of the 15th International Conference on Agents and Artificial Intelligence (ICAART 2023) - Volume 2, pages 45-54
ISBN: 978-989-758-623-1; ISSN: 2184-433X
Copyright
c
2023 by SCITEPRESS – Science and Technology Publications, Lda. Under CC license (CC BY-NC-ND 4.0)
45
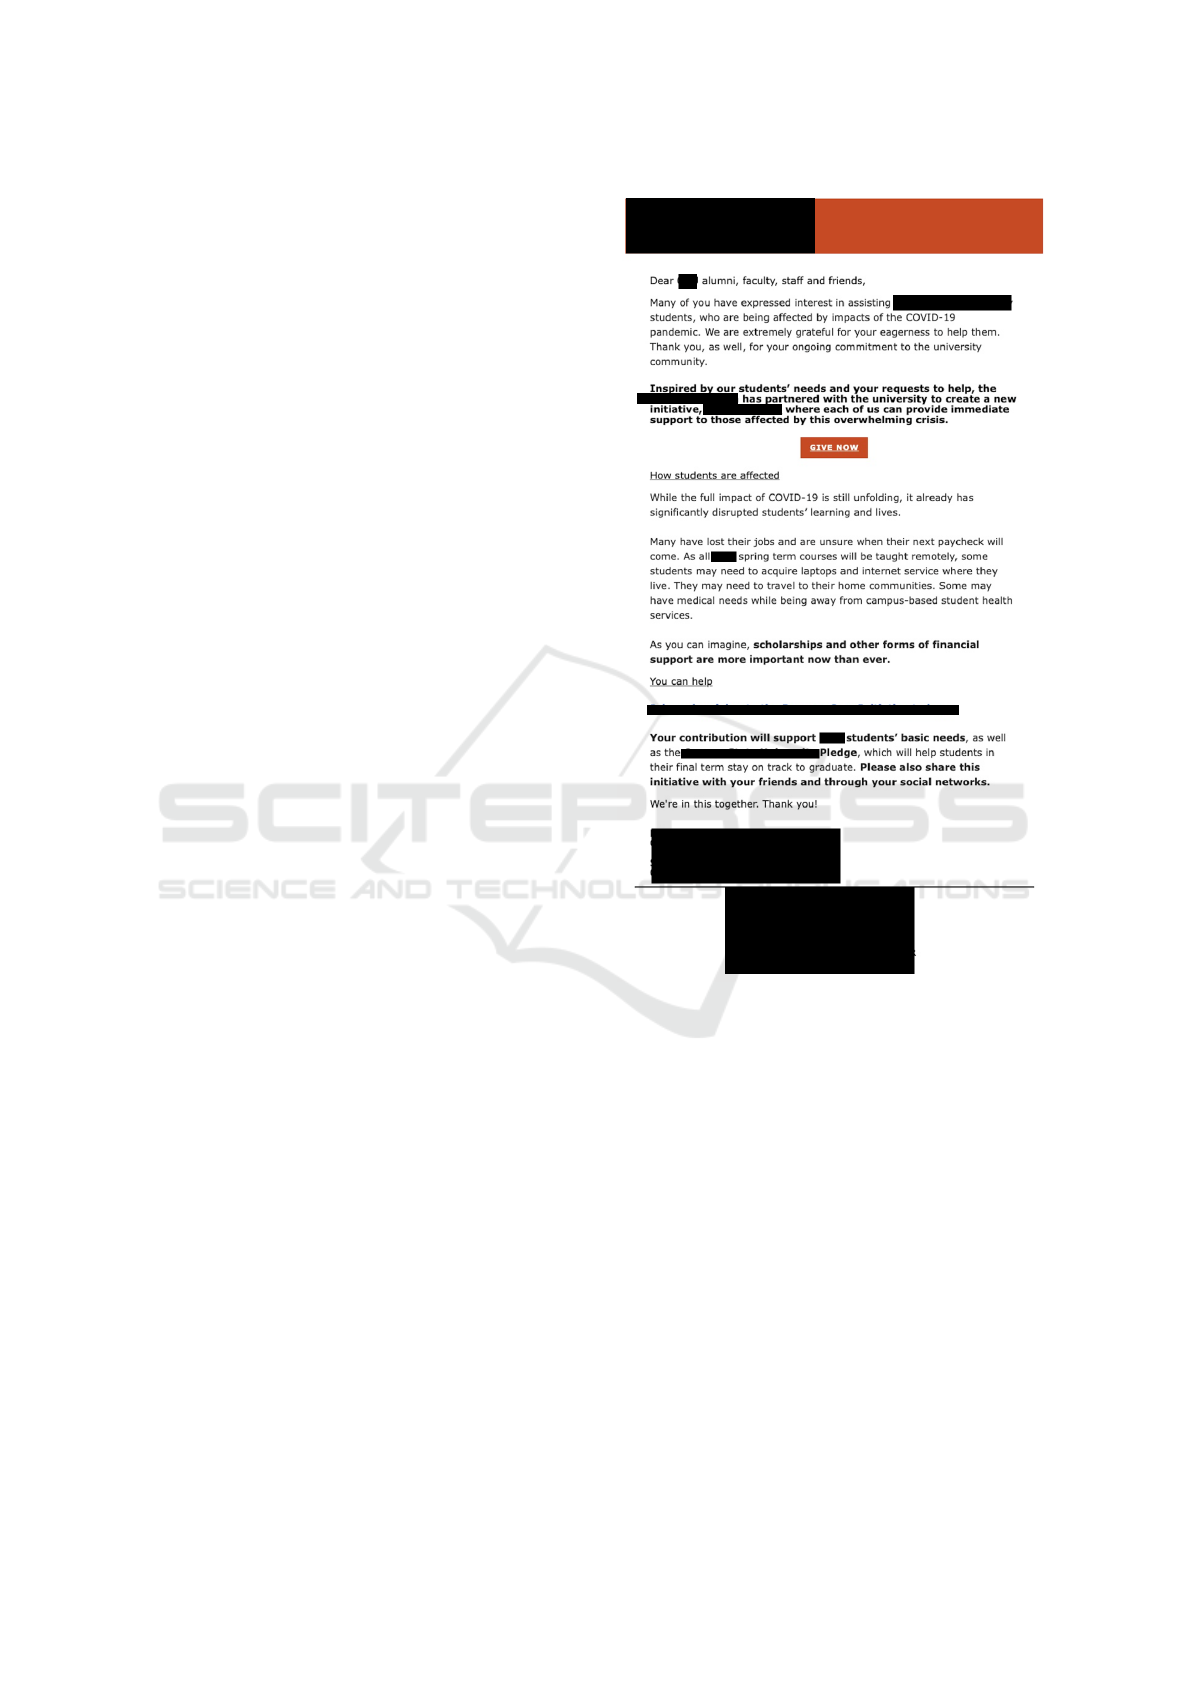
over an 8 month period and statistics were gathered
concerning how often the email got to constituents,
how often they opened it, and various other actions
we describe later. Note that many of the 27 emails
were sent to very specific groups of constituents (e.g.,
foundation board members or those who did not open
a previous email) so no constituent received more than
a few emails concerning this cause.
Since the only action a charity can take within an
email campaign is to send an email, we also query
the most accurate models found with a range of email
parameters and observe which parameters values are
most commonly regarded as those that will lead to
higher donations. Given that some of the features we
use were not used in previous work, charities now will
have suggestions for email parameters they could not
access previously, such as how many words to put in
a subject line and how many font colours to use.
The rest of the paper is organized as follows. We
next describe related research, followed by formulat-
ing the problem. Following this, we describe our ap-
proach and describe our experimental setup. The pa-
per concludes with empirical results and conclusions
and future work.
2 RELATED RESEARCH
In this research, we learn to model the donor jour-
ney by predicting donation amounts based on past
actions and query that model to select best actions
and email parameters. This is relatively new field
and little work has been done prior to this research.
Most donor journey advice amounts to bullet points
on websites (McLellan, 2022).
A few articles have investigated direct mail con-
tent through trials with Red Cross mailings. The au-
thors found that enrollment cards lead to repeat do-
nations, while providing donors with gifts hurt re-
tention (Ryzhov et al., 2015). Email campaigns are
generally evaluated based on demographics, interest
and social network influence of constituents and ex-
ternal time-related factors using best practices shared.
While for-profit organizations have been using ma-
chine learning models for predicting the customer
journey (Lemon and Verhoef, 2016), charities are
having trouble adapting to these techniques.
Machine learning has been applied to predicting
donations to charities. In (Lee et al., 2022; Lee et al.,
2020b) the donor journey is studied extensively in
terms of adding constituent features, experimenting
with multiple deep learning algorithms, combining
data across charities We build on this research in this
paper. Machine learning has also been applied to in-
Figure 1: A sample email solicitation, redacted to maintain
anonymity.
dividual predictions, such as “who is lapsed, but most
likely to return”. These predictions provide charities
with lists of constituents whom they can act on in
a uniform matter, since machine learning algorithms
predict they will all take a given action. These are
point in time predictions that ignore the time aspect
of the donor journey (Lee et al., 2020a).
Recurrent neural networks (RNNs) are special-
ized artificial neural networks that can use sequential
data to learn based on chronological events. They
can make use of long short-term memory (LSTM)
in order to keep track of relevant events from the
past while discarding less important events, through
learning. RNNs have been used to predict customer
churn, which is related to lapsed donors in charitable
giving (Sudharsan and Ganesh, 2022). Bidirectional
RNNs with LSTMs (BDLSTMs) can consider time
ICAART 2023 - 15th International Conference on Agents and Artificial Intelligence
46

series data in either direction, essentially looking both
forward and backward with two separate RNNs, using
backpropagation (Moolayil, 2019).
Convolutional neural networks (CNNs) are widely
used on image and video classification, but can be
used on sequential data as well (Xia and Kiguchi,
2021). CNNs can extract features from sequential
data and map the internal features of the sequence
to the previous layer for each convolutional layer in
the model. This network is effective for deriving
features from a fixed length segment of the overall
dataset (Kim, 2014). CNN LSTMs were developed
for predicting visual time series problems as well as
to generate text from sequence of images (Wang et al.,
2018). They have been used in various time series
prediction tasks, such as predicting air quality (Yan
et al., 2021).
In our work, we experiment with each of RNNs,
BDLSTMs, CNNs, and CNN LSTMs in order to see
which algorithm can produce the best models for pre-
dicting the next best action to take in the donor jour-
ney, in terms of maximizing donations, given the ad-
dition of time and new email features.
3 PROBLEM FORMULATION
In general, the issue at hand is to help charities raise
more money. This can be done on a point-in-time
scale, by asking questions such as “who is likely to
upgrade to a $500 gift?” and creating training data
for machine learning algorithms based on constituents
features at that given time. This would include fea-
tures such as “maximum donation” and “number of
emails opened”. We can make use of these features in
our work, but focus more on the order of constituent
and charity actions, and on what action to take next
rather than which behaviour a constituent is likely to
exhibit at some arbitrary point in the future.
The donor journey can be modeled by considering
the past n actions of the constituent and the charity
with respect to that constituent, and using that infor-
mation to try to predict the next best action for the
charity or constituent to take. Charities generally do
this by hand with “common sense” rules, such as “do
not send another solicitation email until 3 months af-
ter receiving a donation”. While many of the rules
charities use likely work in many situations, we seek
to eliminate bias and error from the process of under-
standing the donor journey, and use machine learning
to arrive at data-driven rules for charities to follow, on
an individual basis.
The actions considered in this and previous work
in this area are shown in Table 1. For one of the chari-
Table 1: The list of all actions used in our experiments for
every charity.
Action Description
No Action Filler action when none happened
Delivered Successfully delivered email
Opened The constituent opened an appeal email
Pageview The constituent viewed the donation portal
Donated The constituent made a donation
Clicked The constituent clicked on a email link
Complained The constituent reported an appeal email as spam
Dropped The appeal email did not reach the constituent
Bounced The appeal email was blocked by the constituent
Unsubscribed The constituent unsubscribed from a mailing list
Table 2: The list of all actions used in our experiments ex-
clusively for a university foundation (C5).
Action Description
Virtual Response Made a social media comment
Attended Attended a university event
Prospect Visit A major gift officer visited the constituent
Volunteer Member Volunteered for a foundation committee
Purchased Purchased an event ticket
Recurring signup Signed up for the same activity 2+ times
Volunteer General volunteering
Participant Participated in an advisory circle
Staff Foundation staff action
Current Continued volunteering
Mentors Participated in accelerator mentoring
Ex Officio Historic trustee action
Trustee Term Alumnus trustee action
Participating Host Off-campus event
Suppressed Unknown email error
Opt out Opted out of some email options
Failed Email did not reach constituent
Trustee Liaison Relevant board participation
Former Former board member action
ties used extensively in our experiments, extra actions
were available in the data, shown in Table 2. Note
that all actions are taken by the constituent except for
the “delivered” action, which is taken by the char-
ity. Since we are working with email campaigns, all
actions in this experiment have an associated email,
except for the ’no action’ action, for which all email
features are set to 0. ’No action’ is necessary to pad
donor journeys that are not n actions long (i.e., a con-
stituent who is newer to the charity than most con-
stituents), and since no action was taken, there cannot
be an associated email. The email features used both
in this work and previous work in this area are given
in Table 3.
Table 3: Variable email parameters.
Parameter Description.
Words Number of words
Paragraphs Number of paragraphs
Images Number of images
Links Number of HTML links
Blocks Number of sections
Divs Number of HTML content division elements
Editable Content Divs Number of editable HTML divs
Adding Time and Subject Line Features to the Donor Journey
47

4 OUR APPROACH
To model the donor journey, we use deep learning
algorithms that are sensitive to time steps, in order
to take advantage of the chronological aspect of the
donor journey. Opening an email and donating is not
the same as donating and then opening an email, and
thus we sought algorithms that can recognize this dif-
ference. An example of a sequence of actions lead-
ing to a donation would be a constituent receiving
an email, opening it, opening it again, clicking a
link in that email, clicking another link in that email,
and viewing the donation portal, which would be
registered as {Delivered, Opened, Opened, Clicked,
Clicked, Pageview}. To each of these actions, we add
the corresponding email features.
To build training data, each action is encoded as
a one-hot encoded action with corresponding email
features. In the experiments, this data is augmented
with the features that we describe in Table 4 in order
to observe the effect of the new features on model ac-
curacy. An example of a set of actions is shown in
Figure 2.
In Figure 2 a window of 6 actions is used and se-
lect actions and email features are given for space rea-
sons. The top of the figure shows the sequence of
actions with the donation amount ($150), while the
bottom shows the one-hot encoded actions with ap-
pended email features. The first action (A1) is the
“no action” action and thus has no associated email
features, which is why they are all 0 in the figure.
The second action is a true action (A2), and has as-
sociated email features. Here, E1 could be 220 words
and E4 could be 11 images. The third action is the
same action as the second action (A2) and has the
same associated email features. This could be a case
where the constituent opened an email twice in a row.
The fourth action (A3) is a different action from the
second and third action and has a different associated
email. The fifth action has the same associated email
as the fourth action, but is a different action (A10).
Finally, the sixth action is the same as the second and
third actions (A2), but has different email parameter
values, so this could be the constituent opening up a
different email.
For all experiments, the deep learning algorithms
are provided with training data in the form of Fig-
ure 2. Window sizes vary between 1 and 25. While
CNN LSTMs were the best performing algorithm in
previous research (Lee et al., 2022; Lee et al., 2020b),
we experiment with RNNs, BDLSTMs, and CNNs as
well to see the effect of the new features on these al-
gorithms, and to see whether the new features can ac-
tually improve their accuracies to the point of match-
Figure 2: A sample set of six actions used as training data
for deep learning models. The actions are one-hot encoded
and have corresponding email features appended.
Table 4: The new features added to training data. These are
divided into time features, subject line features, and email
features for clarity.
Feature Description
Time Features
Time Since Last Action Time in seconds since last action
Time Since Last Same Action Time in seconds since last same action
Subject Line Features
Subject Line Characters Number of chars in the subject line
Subject Line Words Number of words in the subject line
Subject Line Variables Number of variables in the subject line
Email Features
Special Characters Number of special chars
Font Colours The number of fonts
Background Colours The number of background colours
ing or surpassing that of the CNN LSTMs. In partic-
ular, since RNNs and BDLSTMs are more suited to
sequential data, we consider it important to continue
to evaluate their performance on this task.
Donor actions are given in sequence, but the ele-
ment of time is missing. In previous work, if action
B followed action A, there could have been years be-
tween these actions, or seconds, and the data did not
provide any information to allow the machine learn-
ing algorithms to distinguish between these situations.
We introduce two new features - time since last ac-
tion, and time since last same action. Time since last
action measures the time between the current action
and the previous action, while time since last same ac-
tion measures how much time has elapsed since an ac-
tion of the same type was taken (e.g., if the last action
was ’delivered’, how long it has been since the pre-
vious ’delivered’ action). We hypothesize that these
features could provide crucial information about the
meaning of actions following each other in the donor
journey. Figure 3 shows the data from Figure 2 aug-
mented with these two features.
In Figure 3 we give the times in a readable format,
but they are given as seconds in the training data. The
deep learning algorithms are now given information
about how long it has been since actions were taken.
While the times given are fabricated, we can see how
the sixth action happened 2 days after the last same
action (the third action) by summing 1 day, 6 hours,
ICAART 2023 - 15th International Conference on Agents and Artificial Intelligence
48

Figure 3: The action set from Figure 2 with TA (Time since
last action) and TSA (Time since last same action) added.
and 18 hours between them in terms of time since last
action. We can also see that the third action happened
20 minutes after the second action, but it was an en-
tire day later that the fourth action happened. Also,
the constituent has not taken A3 action in a year un-
til they do so on their fourth action. Without time
features, all of this information is not available to ma-
chine learning algorithms.
With emails, before the reader sees the email mes-
sage, they typically see the subject line. Subject
lines have been shown to affect response rates to sur-
veys (Sappleton and Lourenc¸o, 2016). We add 3 sub-
ject line features to the set of features describing an
email associated with an action (Table 4. Subject line
characters and subject line words are related, but it is
possible to have many short words, or few long words
and have the same number of characters. Subject line
characters gives a measure of the overall length of the
subject line, while subject line words help the algo-
rithms know how split up these characters are. Subject
line variables count how many variables there are in
the subject line, where a variable is a placeholder for a
value that can be personalized (e.g., the constituent’s
first name in “Hi (first name), we want to thank you
for your donation!”).
We also add the following email features – spe-
cial character count, font colours, and background
colour to investigate their effect on the donor journey.
Special character count counts how many “$” and
“&” characters are in the email. This can be thought
of primarily as how often money is mentioned, but
also how often the constituent is seeing symbols in
the email. Font colour counts the number of fonts
colours used in the email. Some emails have only
one font colour (black) but many fundraising emails
have several, in order to try to make the email ap-
pear more inviting and exciting. A similar story holds
for background colour, where often the only back-
ground colour is white, but some emails have many
backgrounds throughout, again to try to appear more
enticing to the reader.
Architectures for the deep learning algorithms
were kept the same as the best architectures in (Lee
et al., 2022; Lee et al., 2020b) for consistency in terms
of comparison, and because the authors stated that
Figure 4: The best deep learning architectures discovered
empirically and used in our experiments. From top to bot-
tom they are: CNN, CNN LSTM, RNN, and BDLSTM.
those architectures had been optimized for the data at
hand. The best deep learning architectures are shown
in Figure 4.
5 EMPIRICAL EVALUATION
Our experiments involve comparing the performance
of four deep learning algorithms (CNNs, CNN
LSTMs, RNNs, and BDLSTMs) using the features in
previous work to their performance with those fea-
tures + the features described in Table 4. We seek to
understand if these new features can help any charities
better model the donor journey for their constituents.
In order to try to isolate the effect of the new features
we are adding, we omit constituent features from the
data. In previous researchers work on this data (Lee
et al., 2022; Lee et al., 2020b) constituent features
generally helped lower MAE, but did not have a large
effect on it, so omitting them should not have a large
effect on the overall measurements. We also do not
combine data across charities, since for most chari-
ties this is not an option, since they do not have ac-
cess to other charities’ data. We believe this compar-
ison gives a more accurate assessment of whether the
features we are adding help deep learning algorithms
learn more accurate donor journey models.
All experimental results are averaged over 25
cross validation runs, where at each run we balance
donors and non donors. This is done by selecting
all of the smaller set (donors) and an equal random
number of the larger set (non-donors) for the training
set, and choosing a different subset of the larger set at
each subsequent iteration. While this is a regression
problem, it is as important for charities to distinguish
between donors and non-donors as it is to determine
how much a donor may give. Data is split into 75%
Adding Time and Subject Line Features to the Donor Journey
49

Table 5: Summary of training data from five charities.
C1 C2 C3 C4 C5
Donors 640 229 316 27 1258
Non-Donors 195669 195688 50811 60 173363
Total Raised $54,387 $55,952 $130,034 $6,285 $364,133
Mean Don. $85 $245 $409 $233 $290
Median Don. $50 $100 $100 $100 $100
Standard Dev. $105 $514 $1520 $585 $1,035
Min Don. $5 $1 $1 $10 $5
Max Don. $1,000 $5,000 $10,000 $3,000 $25,000
training and 25% testing.
5.1 Preliminary Experiments
The charitable data used in our preliminary experi-
ments is the same data used in previous research (Lee
et al., 2022; Lee et al., 2020b). This data is described
in Table 5. C1 is a wildlife charity, C2 is a disease
charity, C3 is a youth charity, C4 is a disease charity
and C5 is a university foundation. This data comes
from Fundmetric (www.fundmetric.com), a machine
learning platform that provides anonymized data that
mirrors the real world completeness of most data sets
for nonprofits.
Table 6: Preliminary experiment using all 5 charities, with
window size 20 and a CNN.
C1 C2 C3 C4 C5
Without Time Features $26 $490 $195 $59 $46
With Time Features $35 $290 $138 $57 $52
Tables 6 compares the MAE for the five charities
when time features are added to the action data to
the MAE without time features, using window size 20
for each charity, and the CNN algorithm. The MAE
for C2 and C4 saw a 41% and a 29% drop respec-
tively when adding time features to the data. This still
constitutes a $290 and $138 MAE for these charities,
which is too high of an error to use the model for sug-
gesting email parameters for those charities. For C1
and C5, where the MAEs were lower in previous ex-
periments, there was a slight increase in MAE with
the addition of time features.
In subsequent experiments, C1 and C5 were the
focus, in an attempt to further lower the MAE for
their donor journeys, since it was these charities for
which MAE was at more acceptable levels in terms
of a charity making decisions based on the results of
donor journey experiments, and since C5 has extra ac-
tions making it a different dataset on which to train.
We present the C2 and C3 results here to show that
when MAE is high, time features can be added in or-
der to move towards a more acceptable error. C4 has a
small data set (only 60 donors) and we did not include
it in further experiments as a result.
The following experiments show results for C1
and C5 when adding time features (Section 5.2), and
then adding the new email features (Section 5.3), us-
ing window sizes from 1 to 25. We experiment with
each of RNNs, BDLSTMs, CNNs, and CNN LSTMs
for each experiment, to see the effect of the newly
added features on their performance with respect to
MAE.
5.2 Experiment 1: Adding Time
Features
Tables 7, 8, 9, and 10 show the change in MAE when
the two time features are added to the data compared
to the MAE without these features for four deep learn-
ing algorithms. In all results tables, bold values show
the lower MAE in a comparison of data, and bold
italic values show the lowest value in the table for a
given charity.
For CNNs and CNN LSTMs, there is an increase
in MAE with almost every window size for both C1
and C5. On the contrary, for RNNs and BDLSTMs,
there is a decrease in MAE for most windows sizes for
both C1 and C5. Thus, the extra features seem to help
RNN-based deep learning algorithms. In addition, the
MAEs are generally lower for RNNs and BDLSTMs
than they are for CNNs and CNN LSTMs, suggesting
that adding time features and using RNN-based deep
learning algorithms is a charity’s best choice to ob-
tain the most accurate donor journey model. We next
experiment with adding subject line and other email
features to the time features data.
Table 7: Comparing the performance of CNNs with new
added time features to data without these features.“TF”
stands for time features being added to the data.
Window Size
1 3 6 10 15 20 25
C1 $32 $33 $26 $34 $29 $27 $27
C1TF $43 $42 $44 $43 $39 $41 $40
C5 $49 $49 $44 $49 $49 $50 $57
C5TF $52 $52 $46 $41 $52 $52 $50
Table 8: Comparing the performance of CNN LSTMs with
new added time features to data without these features.
“TF” stands for time features being added to the data.
Window Size
1 3 6 10 15 20 25
C1 $41 $41 $36 $35 $36 $42 $33
C1TF $41 $42 $43 $41 $40 $39 $39
C5 $49 $46 $47 $48 $47 $49 $46
C5TF $53 $52 $52 $53 $53 $52 $53
ICAART 2023 - 15th International Conference on Agents and Artificial Intelligence
50

Table 9: Comparing the performance of RNNs with new
added time features to data without these features. ‘TF”
stands for time features being added to the data.
Window Size
1 3 6 10 15 20 25
C1 $43 $31 $30 $28 $27 $26 $27
C1TF $25 $24 $24 $24 $25 $24 $24
C5 $55 $55 $55 $54 $55 $50 $48
C5TF $44 $38 $40 $41 $40 $40 $41
Table 10: Comparing the performance of BDLSTMs with
new added time features to data without these features.
“TF” stands for time features being added to the data.
Window Size
1 3 6 10 15 20 25
C1 $43 $31 $29 $28 $27 $28 $25
C1TF $28 $25 $28 $24 $25 $26 $24
C5 $53 $52 $42 $41 $43 $40 $50
C5TF $39 $38 $48 $40 $40 $40 $38
5.3 Experiment 2: Adding Subject Line
Features and More Email Features
We next added new email features, including those
describing the subject line for the email associated
with each action. Tables 11, 12,13, and 14, show
the change in MAE when these features are added to
the data compared to the MAE without these features
for four deep learning algorithms.
As with adding just time features, for CNNs and
CNN LSTMs, there is an increase in MAE in with
almost every window size for both C1 and C5. On
the contrary, for RNNs and BDLSTMs, there is a de-
crease in MAE for most windows sizes for both C1
and C5. Thus, the extra features seem to help RNN-
based deep learning algorithms.
For CNNs the MAEs are lowered when adding
new email and subject line features to time features,
while CNN LSTMs are unaffected. For RNNs the ad-
dition of new email and subject line features actually
caused an increase in MAE compared to only adding
time features, although these MAEs were still lower
than not adding new features at all. For BDLSTMs,
adding the new email and subject features had mixed
results compared to only adding time features, but for
C5 it was generally better to have all of the new fea-
tures in terms of MAE.
Overall, the lowest MAE for C1 data was $24
which was achieved by both RNNs and BDLSTMs
with time features and with time features and new
email features. For C5, the lowest MAE was $36
which was achieved using a BDLSTM with both time
features and new email features. These MAEs are
lower than any achieved in previous work ( (Lee et al.,
Table 11: Comparing the performance of CNNs with new
features(time and new email features) to without new fea-
tures.“NewF” stands for new email and subject line features
being added to the data.
Window Size
1 3 6 10 15 20 25
C1 $32 $33 $26 $34 $29 $27 $27
C1NewF $40 $42 $42 $39 $40 $39 $38
C5 $49 $49 $44 $49 $49 $50 $57
C5NewF $52 $58 $52 $53 $52 $52 $51
Table 12: Comparing the performance of CNN LSTMs with
new features(time and new email features) to without new
features. “NewF” stands for new email and subject line fea-
tures being added to the data.
Window Size
1 3 6 10 15 20 25
C1 $41 $41 $36 $35 $36 $42 $33
C1NewF $41 $42 $42 $42 $42 $42 $41
C5 $49 $46 $47 $48 $47 $49 $46
C5NewF $51 $50 $52 $53 $54 $53 $53
2022; Lee et al., 2020b)) when constituent features
and data combination were not used and thus show
that the addition of time and new email features helps
create deep learning models better capable of captur-
ing the donor journey.
5.4 Experiment 3: Querying the Most
Accurate Models
In order to ensure the models learned were reason-
able, we queried them to see which actions they
thought would lead to the highest donation amount
across donor journeys. This involved taking the last
n actions associated with a constituent and shift-
ing them back a position, and querying the model
with each of the possible actions, as shown in Fig-
ure 5. Doing this resulted in the highest predicted gift
amount being associated with pageview, donated, and
delivered in 80% of cases and actions such as com-
plained never being predicted to produce the high-
est donation amount. We interpreted this to mean the
model had learned positive actions help increase do-
Table 13: Comparing the performance of RNNs with new
features(time and new email features) to without new fea-
tures. “NewF” stands for new email and subject line fea-
tures being added to the data.
Window Size
1 3 6 10 15 20 25
C1 $43 $31 $30 $28 $27 $26 $27
C1NewF $24 $24 $32 $24 $24 $24 $24
C5 $55 $55 $55 $54 $55 $50 $48
C5NewF $44 $39 $41 $40 $44 $46 $48
Adding Time and Subject Line Features to the Donor Journey
51

Table 14: Comparing the performance of BDLSTMs with
new features(time and new email features) to without new
features.“NewF” stands for new email and subject line fea-
tures being added to the data.
Window Size
1 3 6 10 15 20 25
C1 $43 $31 $29 $28 $27 $28 $25
C1NewF $25 $25 $30 $29 $24 $25 $24
C5 $53 $52 $42 $41 $43 $40 $50
C5NewF $36 $41 $43 $41 $41 $42 $41
Figure 5: When querying the models, all actions are shifted
back by 1 and a new action is inserted into the last posi-
tion. The model is then queried for a predicted donation
amount with this set of actions. Email and time features are
included, but are not shown here.
nations and as a further sanity check on its reasoning.
Ultimately, since we cannot choose the actions of
the constituent, we want to be able to optimize the ac-
tion the charity can take, which is sending an email
(delivered). We queried the most accurate models
from Experiments 1–3 with the delivered action with
a range of values for each email parameter, and ob-
served which values led to the model suggesting the
highest donation amount for each constituent. These
results are shown in Tables 15, 16 show the mode,
median, mean and standard deviation for the email
parameter values deemed by BDLSTMs to be the best
in order to maximize donation values for C1 and C5
constituents respectively. We used BDLSTMs with
window size 20 in this experiment since this setup
generally had the lowest MAEs in our experiments.
For C1, BDLSTMs suggest a larger number of
paragraphs, while for C5 they suggest just 1 para-
graph, perhaps picking up on a difference between the
two charities. C1 is a wildlife charity and C5 is a uni-
versity foundation and their donors may have differ-
ent email preferences. Another difference is shorter
subject line words for C1 vs longer ones for C5. For
both charities, the model chose 5 words, but averag-
ing their lengths using the number of characters se-
lected gives us 4 letter words for C1 and almost 8 let-
ter words for C5. Donors to C5 may need more infor-
mation in their subject lines in order to be sufficiently
interested to open an email.
In terms of special characters and fonts, BDL-
STMs suggested 5 each for both C1 and C5, but sug-
gested 15 background colours for C1 vs 5 for C5.
Similarly to the choice of larger words for C5, this
is perhaps indicative of the BDLSTM learning that
university foundation donors prefer larger words with
fewer colours. For both C1 and C5, BDLSTMs chose
Table 15: Summary of email parameter values chosen by
BDLSTMs for C1.
Mode Median Mean St. Dev
Words 150 150 134.43 132.47
Paragraphs 18 18 15.03 6.43
Images 15 15 13.54 3.32
Links 35 35 34.14 2.1
Blocks 9 9 9 0
Special chars 5 5 6.76 3.8
Font colours 5 5 5.14 1.18
Background colour 15 15 12.52 4.32
Divs 41 41 44.64 6.4
Editable Content 9 9 10.17 2.3
Subject line words 5 5 5.69 2.7
Subject line characters 20 20 22.53 5.74
Subject line variables 0 0 0.4 0.49
Table 16: Summary of email parameter values chosen by
BDLSTMs for C5.
Mode Median Mean St. Dev
Words 150 150 124.8 56.23
Paragraphs 1 1 1 0
Images 15 15 13.4 3.3
Links 35 35 33.9 2.2
Blocks 9 9 9 0
Special chars 5 5 8.23 4.7
Font colours 5 5 9.9 5.03
Background colour 5 5 9.9 5.03
Divs 56 56 53.4 5.6
Editable Content 15 15 13.05 2.8
Subject line words 5 5 5 0
Subject line characters 38 38 29.12 9.06
Subject line variables 0 0 0.05 0.23
0 subject line variables except for in a few cases, indi-
cating that having a constituent’s name in the subject
line is not advisable, according to the models.
6 CONCLUSIONS AND FUTURE
WORK
This research builds on the work in (Lee et al., 2022;
Lee et al., 2020b) by augmenting donor journey data
with time features and more email features, includ-
ing subject line features. The former provides needed
context for the passage of time between actions, and
the passage of time between similar actions, while the
latter provides more information about the initial sec-
tion of an email the reader sees (the subject line) and
about the appearance of the email.
The addition of these features had a strong effect
on two charities (C2 and C3), reducing the MAE by
41% for one charity and 34% for another. But these
charities had high MAEs to begin with, so we focused
on charities that had lower MAEs, including one that
had extra actions compared to the other charities with
ICAART 2023 - 15th International Conference on Agents and Artificial Intelligence
52

data available, since these models are accurate enough
to be used in practice.
Adding time features increased MAE for CNNs
and CNN LSTMs in most cases, as those algorithm
were perhaps less well-equipped to handle the time
features and did not seem to learn from the new
email features. In contrast, when time features were
added to the data for RNNs and BDLSTMs, the MAE
dropped, and was below that of the CNN and CNN
LSTMs on data without time features. This showed
adding time features can help deep learning achieve
lower MAEs on the donor journey.
We next added subject line features and new email
features to the data with time features and again com-
pared to data without any new features. The results
were similar as to when time features were added, al-
though CNN and CNN LSTM MAEs improved with
data containing these new features compared to their
MAEs when only having time features added. For
RNNs and BDLSTMs, there was not a significant
change from only adding time features, but the lowest
MAEs were achieved with data having all of time fea-
tures, subject line features, and other new email fea-
tures. This shows that the new features added in these
experiments help create more accurate deep learning
models for the donor journey.
When querying the most accurate model to se-
lect email parameters, the BDLSTM model suggested
short emails for both C1 and C5, but many more para-
graphs for C1, which is a wildlife charity. It also
chose fewer background colours for C5, a university
foundation and larger words for its subject lines com-
pared to C1. This may reflect the level of language
sophistication around university donors, since many
of them are alumni of the university foundation, and
thus have a post-secondary education.
In the future, we will add in constituent features to
(hopefully) further lower MAE and see if deep learn-
ing algorithms can benefit from having all of actions,
email features, constituent features, and all the fea-
tures we added in this paper. We will also combine
data across charities to see the effect, even though this
combination of data is not realistic for most charities.
We will continue to add new features to the data as
they become available and as we create them.
In addition to understanding which features matter
for machine learning the donor journey, understand-
ing why such features matter is a possible avenue of
research. For instance, background colours may have
different effects on constituents from different cul-
tures. We can also survey constituents to obtain di-
rect answers concerning which email features actually
made a different in their decision to donate or not, and
in their decision concerning how much to donate.
Also in the future, the type of email sent will be
a feature, which would be in the set of {acquisition,
solicitation, stewardship, cultivation}. Acquisition
emails seek donations from non-donors, while solic-
itation emails seek donations from previous donors.
Cultivation emails seek to increase a donor’s dona-
tion amount, while stewardship emails thank donors
for their donations and keep them informed on the
activities of the charity. While adding these features
may seem straightforward, many emails fit more than
one category. Charities always try to say thank you
even when asking for money, so these features will
likely need to be scaled in the [0,1] range and we will
experiment to see which system works best for incor-
porating this information into the data.
REFERENCES
Canals-Cerda, J. J. (2014). Charity art auctions. Oxford
Bulletin of Economics and Statistics, 76(6):924–938.
Kim, Y. (2014). Convolutional neural networks for sentence
classification. In Proceedings of the 2014 Conference
on Empirical Methods in Natural Language Process-
ing (EMNLP), pages 1746–1751, Doha, Qatar. Asso-
ciation for Computational Linguistics.
Lee, G., Adunoor, S., and Hobbs, M. (2020a). Machine
Learning across Charities. Proceedings of the 17th
Modeling Decision in Artificial Intelligence Confer-
ence, page in press.
Lee, G., Raghavan, A., and Hobbs, M. (2022). Deep learn-
ing the donor journey with convolutional and recurrent
neural networks. In Wani, M. A., Raj, B., Luo, F., and
Dou, D., editors, Deep Learning Applications, Volume
3, pages 295–320. Springer.
Lee, G., Raghavan, A. K. V., and Hobbs, M. (2020b). Im-
proving the donor journey with convolutional and re-
current neural networks. In Wani, M. A., Luo, F., Li,
X. A., Dou, D., and Bonchi, F., editors, 19th IEEE In-
ternational Conference on Machine Learning and Ap-
plications, ICMLA 2020, Miami, FL, USA, December
14-17, 2020, pages 913–920. IEEE.
Lemon, K. N. and Verhoef, P. C. (2016). Understanding
Customer Experience Throughout the Customer Jour-
ney. Journal of Marketing, 80(6):69–96.
McLellan, T. (2022). Mapping the donor jour-
ney - part one: Five reasons to consider it.
http://www.finelinesolutions.com/academy/blogs/18-
non-profits-learn-here/129-mapping-the-donor-
journey-part-one-why-is-mapping-a-good-idea.html.
Moolayil, J. (2019). Keras in Action. In Learn Keras for
Deep Neural Networks, pages 17–52. Apress, Berke-
ley, CA.
Ryzhov, I., Han, B., and Bradic, J. (2015). Cultivating disas-
ter donors using data analytics. Management Science,
62:849–866.
Sappleton, N. and Lourenc¸o, F. (2016). Email subject lines
and response rates to invitations to participate in a
Adding Time and Subject Line Features to the Donor Journey
53

web survey and a face-to-face interview: the sound
of silence. International Journal of Social Research
Methodology, 19(5):611–622.
Sudharsan, R. and Ganesh, E. N. (2022). A swish rnn based
customer churn prediction for the telecom industry
with a novel feature selection strategy. Connection
Science, 34(1):1855–1876.
Wang, H., Yang, Z., Yu, Q., Hong, T., and Lin, X. (2018).
Online reliability time series prediction via convolu-
tional neural network and long short term memory for
service-oriented systems. Knowledge-Based Systems,
159.
Xia, J. and Kiguchi, K. (2021). Sensorless real-time force
estimation in microsurgery robots using a time se-
ries convolutional neural network. IEEE Access,
9:149447–149455.
Yan, R., Liao, J., Yang, J., Sun, W., Nong, M., and Li,
F. (2021). Multi-hour and multi-site air quality in-
dex forecasting in beijing using cnn, lstm, cnn-lstm,
and spatiotemporal clustering. Expert Syst. Appl.,
169:114513.
ICAART 2023 - 15th International Conference on Agents and Artificial Intelligence
54
