
Towards Building a Naturalistic Cycling Dataset Capturing
Bicycle/Car Interactions
Fahd Alazemi
1
, Karim Fadhloun
1
, Hesham Rakha
1a
and Archak Mittal
2b
1
Virginia Tech Transportation Institute, Virginia Tech, 3500 Transportation Research Plaza, Blacksburg VA, U.S.A.
2
Leidos, U.S.A. (This work was done while Arckak Mittal worked for the Ford Motor Company)
Keywords: Bicycle Behaviour, Naturalistic Cycling Data, Car/Bike Interactions, Computer Vision, Object Detection.
Abstract: As machine learning and computer vision techniques and methods continue to advance, the collection of
naturalistic traffic data from video feeds is becoming more and more feasible. That is especially true for the
case of bicycles, for which the collection of naturalistic data is not achievable in the traditional vehicle
approach. This study describes a research effort that aims to extract naturalistic cycling data from a video
dataset for use in safety and mobility applications. The used videos come from a dataset collected in a previous
Virginia Tech Transportation Institute study in collaboration with SPIN in which continuous video data at a
non-signalized intersection on the Virginia Tech campus was recorded. The research team applied computer
vision and machine learning techniques to develop a comprehensive framework for the extraction of
naturalistic cycling trajectories. In total, this study resulted in the collection and classification of 619 bicycle
trajectories based on their type of interactions with other road users. The results confirm the success of the
proposed methodology in relation to extracting the locations, speeds, and accelerations of the bicycles at a
high level of precision. Furthermore, preliminary insights into the acceleration and speed behavior of
bicyclists around motorists are determined. The resulting dataset will be made available to the research
community once the required approvals have been obtained from the study sponsors.
1 INTRODUCTION
Cycling, as a transportation mode, has been taking an
ever-increasing share of the mobility over the last
decade. As a sustainable commuting mode, it has
been the go-to solution of policymakers to lessen
traffic congestion in central downtown areas without
further road enlargement. That is justified by the fact
that short-distance bike commuting often takes less
time when accounting for congestion and delays in
public transportation and presents the most efficient
way to increase the road capacity while maintaining
existing infrastructure.
Despite the growing interest in bicycle use in the
last decade and the urgent need to develop models and
planning techniques for bicycle traffic operations,
traffic researchers have minimally investigated the
traffic flow dynamics of bicycles, unlike vehicular
traffic flow, which is heavily studied. The observed
literature gap between vehicular and bicycle traffic
a
https://orcid.org/0000-0002-5845-2929
b
https://orcid.org/0000-0001-6186-4513
research is mostly justified by the scarcity, and even
the non-existence, of naturalistic cycling data. Most
of the existing research that investigated bicycles as a
means of transportation (for simulation purposes)
(Jia et al., 2007; Jiang et al., 2018; Jiang et al., 2017;
Li et al., 2021; Qu et al., 2017; Ren et al., 2016) were
in relation to investigating the interactions of bicycles
with cars and other possible entities. Technically
speaking, a significant portion of those studies falls
under, either the Cellular Automata (CA) model that
involves discretizing the time and space domain using
a non-continuous cell grid such as the work of (Jia et
al., 2007; Jiang et al., 2018; Ren et al., 2016); or the
social force model approach (Li et al., 2021; Qu et al.,
2017) because of its advantages in terms of
simulating dynamic lateral dispersion characteristics
of mixed traffic. However
,
while these models
offered a concise theoretical framework for the
simulation of bicycle longitudinal and lateral traffic
behavior in a mixed traffic environment, they were
Alazemi, F., Fadhloun, K., Rakha, H. and Mittal, A.
Towards Building a Naturalistic Cycling Dataset Capturing Bicycle/Car Interactions.
DOI: 10.5220/0011710000003479
In Proceedings of the 9th International Conference on Vehicle Technology and Intelligent Transport Systems (VEHITS 2023), pages 35-45
ISBN: 978-989-758-652-1; ISSN: 2184-495X
Copyright
c
2023 by SCITEPRESS – Science and Technology Publications, Lda. Under CC license (CC BY-NC-ND 4.0)
35

limited in their validation work due to the lack of
naturalistic data capturing such interactions.
In addition to the above cycling research that is
oriented towards capturing the effect of bicycles in a
mixed traffic environment, a few other studies
investigated the fundamental concepts behind bicycle
longitudinal motion based on the assumption that
there are no major differences between the dynamics
of single-file bicycle traffic and vehicular traffic.
These include models specifically developed for
bicycle motion modeling such as the Necessary
Deceleration Model (NDM) (Andresen et al., 2014)
developed in 2012. Another approach used by
researchers to model the longitudinal motion of
bicycles investigated the possibility of capturing
cyclists’ behavior through revamping certain aspects
of existing car-following models. That is the case, for
example, in the Intelligent Driver Model (IDM)
(Treiber et al., 2000) which, after a simple re-
parameterization, was shown to be a good descriptor
of bicycle-following behavior (Kurtc & Treiber,
2020). In a similar fashion, driven by the complete
overlook of the effects that the cyclist and the road
environment have on bicycle motion behavior, the
research team proposed a longitudinal motion model
for bicycles (Fadhloun, 2021) that is derived from the
Fadhloun-Rakha (FR) car-following model
(Fadhloun & Rakha, 2020). A common factor
between the NDM model as well as the proposed
IDM and Fadhloun-Rakha bicycle-specific
formulations is that they were all validated against
cycling data collected in a similar experimental
setting in which participants were instructed to follow
one another on a ring-road without the possibility of
overtaking (Andresen et al., 2014; Kurtc & Treiber,
2020). While the used data in these efforts is in
accordance with their assumptions and the approach
used is scientifically sound, it is quite clear that those
models are not capable of capturing the inherent
naturalistic non-lane-based traffic behavior
characteristics of bicycles. To address that issue, the
research team complemented, in a second stage, the
Fadhloun-Rakha longitudinal bicycle-following
model with a lateral control module (Alazemi, 2022),
thus inducing a certain degree of freedom in bicycle
lateral motion by allowing overtaking maneuvers to
occur. However, that effort remained theoretical in
nature due to the unavailability of two-dimensional
naturalistic cycling data that could serve to validate
and verify the model formulation.
While the above studies differed based on their
purpose and applications, they all share one key
element. That is to say, the complete lack or
superficiality of validation work due to the non-
existence of naturalistic cycling data that is well fitted
for their objectives. In this study, the research team
tries to fill, at least partially, the apparent gap in
naturalistic data that exist between vehicular traffic
and bicycle traffic.
Specifically, this paper describes a research effort
that aims to extract naturalistic cycling data from
video feeds for use in different mobility applications.
To achieve this objective, the research team first
applied computer vision, machine learning, and data
reduction techniques to a video dataset in order to
identify and extract bicycle trips in the pixelated
domain of the videos. The selected video dataset is
the result of a previous Virginia Tech Transportation
Institute study in collaboration with SPIN in which
continuous video data at a non-signalized intersection
at the Virginia Tech campus was collected. Next,
using the results of a high-precision surveying
campaign of the observed area, the collected
trajectories were projected in the Northing-Easting
coordinate system allowing for the determination of
the actual locations, speeds, and accelerations of the
bicycles. Besides its main contribution that resulted
in the collection of 619 bicycle trajectories, it is
noteworthy to mention that the trips were classified
into different scenarios depending on the type of
interactions the bicyclists had with cars. Subsequently,
a better understanding of bicyclists’ behavior around
motorists is achieved. The results could be used to
analyze the interactions between cyclists and drivers,
both for safety and capacity studies.
Concerning its layout, the paper starts with a brief
overview of the used naturalistic video dataset. That
is followed with a detailed description of the different
methodologies and techniques involved in the
extraction of the naturalistic cycling trajectories from
the video feeds. Finally, the results and findings of the
study are presented.
2 NATURALISTIC DATASET
Due to the continuous proliferation and
advancements in machine learning and computer
vision techniques, it is becoming feasible to acquire
reliable naturalistic traffic data in a cheap and
efficient manner from video datasets. That is
especially true for the case of bicycles as they are not
as instrumented as cars, which would not allow the
capture of their full surroundings in the context of a
naturalistic data collection study. In the case of this
study, the complete video dataset is the result of a
previous Virginia Tech Transportation Institute study
in collaboration with SPIN in which continuous video
VEHITS 2023 - 9th International Conference on Vehicle Technology and Intelligent Transport Systems
36

data at several fixed locations at the Virginia Tech
campus was collected for a seven-month period. For
the purpose of this research, only a portion of the
above dataset at a single location is used. The selected
dataset was collected over 55 days between the
months of September and December 2019 using a
roof-mounted high-definition camera facing a non-
signalized three-way stop intersection. The selected
dataset includes approximately 810 hours of 3720 x
1728 pixels videos recorded at a frequency of 30 Hz.
3 VIDEO PROCESSING
The first step of this research effort involves the
identification of the bicycle events from the different
videos. Given the big size of the video feed, a manual
data reduction was judged to be infeasible, as it will
be both a costly and lengthy process. Instead, the
research team opted for a more automated route that
makes use of existing object detection techniques.
Specifically, a two-step object-detection algorithm
was developed.
The first step of the proposed algorithm uses a
cascade detector based on the histograms of oriented
gradients (HOG) with 11 stages to detect potential
regions of interest that might be bicycles in the video
frames. The number of stages used to train the
detector is not random. In fact, the research team
initially used a database composed of 400 positive
images and 900 negative images to train detectors
with different number of stages (5, 7, 9, 11, and 13)
and a false alarm rate fixed at 2.5%. The number of
training images and stages were purposefully set
relatively low in order to ensure a quick training
process. The focus of the research team, at this level,
was to ensure that the number of stages of the detector
is high enough to detect a significant percentage of
the true positives regardless of the number of false
positives as these will be addressed and eliminated
later. Next, the trained detectors were run on a one-
hour video from the database at 5-second intervals to
quantify their performance. The outputs from this
step consisted of bounded areas that highlight regions
that might be inclusive of bicycles in the examined
video frame, as illustrated in Figure 1.
Figure 1: Sample output of HOG detectors.
The following metrics were used to assist with the
evaluation of each of the detectors:
The number of true positives: These refer to the
bounded areas identified correctly by the
detectors in that they contain a bicycle.
The number of false positives: These
correspond to the bounded areas identified
wrongfully by the detectors.
The number of false negatives: These account
for the cases in which a bicycle was present in
the video frame without being detected.
It is noteworthy to mention that all the detectors,
regardless of their number of stages, were able to
identify 42 out of the 44 bicycle trips. However, a
deeper look into the results using the above metrics
highlighted the huge differences between them.
Figure 2 plots the variation of the true positives
(Figure 2.a), false positives (Figure 2.b), and false
negatives (Figure 2.c) against the number of stages
used to train the detector. The main revelation from
the figures is that the total number of false positives
significantly decreases as the number of training
stages increases. However, the observed decrease is
also accompanied by a decrease in the number of true
positives and an increase of the number of false
negatives. Based on the observed patterns, it is
evident that the detector with 11 stages is the best
among those investigated albeit a relatively high
number of false positives (a total of 1994). To address
that issue, the bicycle-detection algorithm was
complemented with another technique with the main
objective of decreasing the occurrences of false
detections.
In fact, in the second stage of the algorithm, the
highlighted areas of interest are selected for further
examination using a semantic segmentation network
that attempts to classify every pixel in them and
assign them to different classes. For that purpose, the
research team selected an existing pre-trained
DeepLabv3+ network (Chen et al., 2018), which
is a convolutional neural network (CNN) designed for
Towards Building a Naturalistic Cycling Dataset Capturing Bicycle/Car Interactions
37
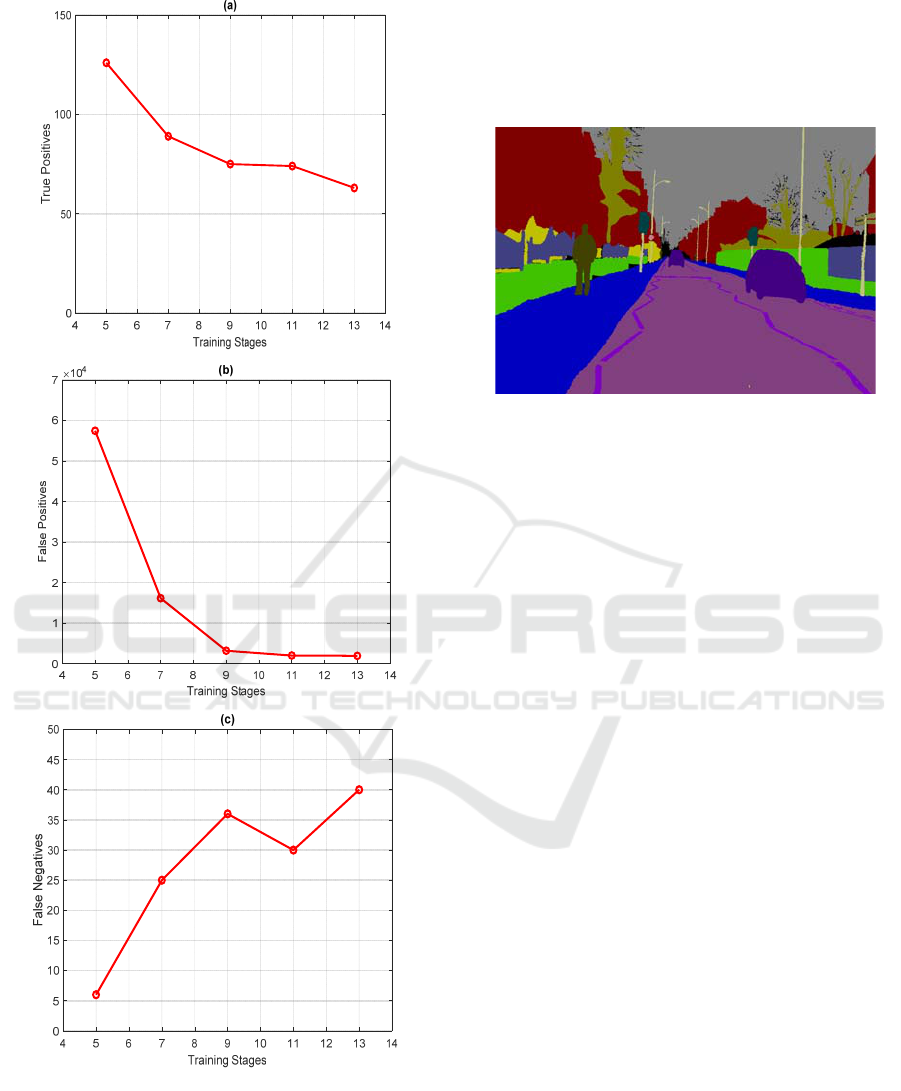
Figure 2: Variation of the detector metrics as a function of
the number of training stages a) True positives; b) False
positives; c) False negatives.
semantic image segmentation. The network is
available for download at the Mathworks website and
was trained using the CamVid dataset (Brostow et al.,
2009) from the University of Cambridge. The dataset
consists of a collection of street-level images that are
segmented at the pixel-level using 32 semantic
classes (such as bicyclist, pedestrian, and car) as
shown in Figure 3.
Figure 3: Sample image from the CamVid dataset.
As mentioned earlier, the main reason behind the
semantic segmentation phase is to eliminate the false
positives that were detected by the HOG detector in
the previous step. That was achieved through a
comparison between the number of pixels that were
classified as bicyclist and the total number of pixels
in the investigated area. If the ratio between the two
values is greater than a set threshold of 5% in at least
one of the highlighted regions, the examined video
frame is saved for manual confirmation. Otherwise, it
is rejected (Figure 4). The application of the semantic
segmentation algorithm over the areas identified by
the HOG detector proved to be quite successful. In
fact, the number of frames selected for further
investigation decreased from 683 frames for the
standalone HOG detector to 89 frames when the two
algorithms together without any decrease in the
number of bicycles detected. The algorithm was able
to detect accurately 42 out of the existing 44 bicycle
events (95.5%).
With the algorithms ready, the different videos of
the database were processed using the HOG detector
in conjunction with the semantic segmentation at 5-
second intervals. That is mainly due to the heavy
computational toll of those algorithms. However, that
did not have much effect on the accuracy of the
algorithm in bicycle detection as demonstrated
earlier. Furthermore, to further illustrate the
performance of the algorithm in relation to false
positives, it was run on the 4-hour video between
6AM and 10AM on Christmas day, which is a period
in which no bicycles were present. The algorithm
saved only 21 frames for further investigation out of
the 2880 frames examined (< 1%).
VEHITS 2023 - 9th International Conference on Vehicle Technology and Intelligent Transport Systems
38
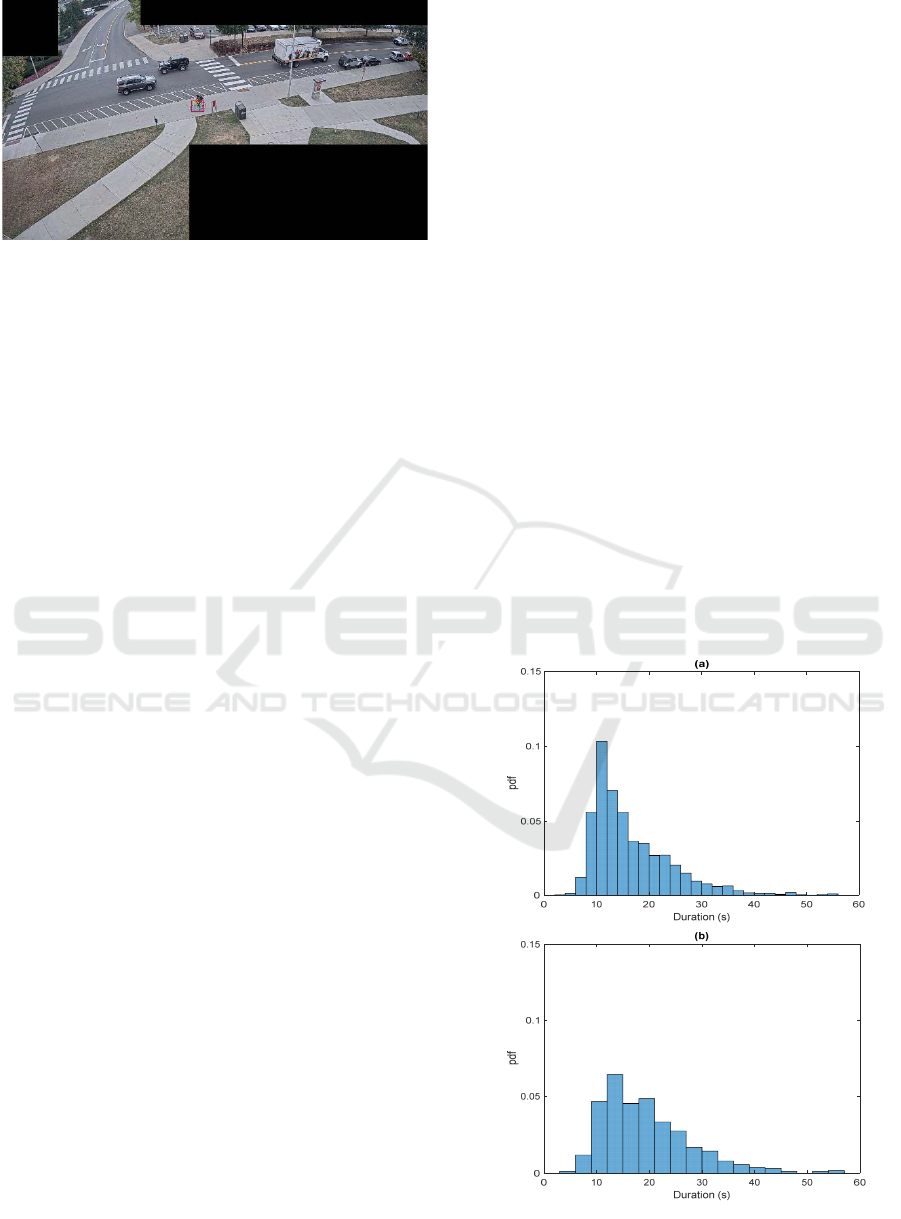
Figure 4: Sample output after semantic segmentation.
4 EVENT PROCESSING
The previous step resulted in an image database in
which the video frames selected for further
investigation were saved separately with pertaining
information to the date, time, and timestamps in their
respective videos. Through a manual data reduction
process, the resulting database was investigated to
identify the different cycling trips and noting their
start times and end times. The result of this process
was the identification of a total of 2259 cycling
events.
More importantly, the data reductionists were
instructed to classify the identified events based on
whether the bicycle interacted with other entities or
not during this trip. That is of utmost importance
when it comes to validating existing bicycle behavior
models. For instance, the portion of trips in which the
bicycle is traveling without any impact from the
surrounding traffic will be mostly useful for the
validation of bicycle motion models (in the free-flow
regime where no leader is involved). However, when
it comes to mobility studies investigating bicycle
interactions with cars (or other modes), information
about the interacting entities along with the
trajectories of the bicycles is necessary for any
validation work.
In that regard, the research team defined 56
scenarios to classify the bicycle trips based on the
following criteria. The first criterion relates to the
motion behavior of the car. The interacting car with
the bicycle is categorized by whether it is moving
straight, turning, or coming to a complete stop. The
second classification criterion captures the relative
position of the bicycle in relation to the car. The
bicycle can be behind, ahead, or next to the car. The
next criterion looks at whether the bicycle is in the
path or out of the path of the car. Finally, the last
criterion investigates the relative direction of the
bicycle velocity vector in comparison to that of the
car. Here, the categorization can take one out of five
possible values. The direction of the bicycle velocity
vector relative to the car can be either: same, either
oncoming, stationary, lateral, or receding.
The definitions of the scenarios along with the
total number of events identified for each scenario are
presented in Appendix 1. Out of the 2259 events
identified by the data reduction team, about 70%
(1580) of the trips fall under the first scenario in
which the bicycle was traveling independently of
other traffic with no observed interactions. It is
noteworthy to mention that the predominance of the
first scenario is quite understandable given that the
Virginia Tech campus is very cyclable-friendly, and
bicycle trips can generally be completed on the
sidewalk without having to go on the road. The
remaining trips concern scenarios in which
interactions did occur. The results show that these are
mostly concentrated in four specific scenarios,
namely: scenarios 2, 10, 43 and 44. The probability
density function of the trip durations are presented in
Figure 5.a and Figure 5.b, which illustrate the
duration distribution histograms for the trips with no
interactions (Scenario 1) and the trips with
interactions (remaining scenarios), respectively. The
figures confirm that most of the trips have a duration
between 10 and 20 seconds with an average of 16.1
seconds and a median of 14.0 seconds.
Figure 5: Histogram of the duration distribution for a) Trips
with no interactions; b) Trips with interactions.
Towards Building a Naturalistic Cycling Dataset Capturing Bicycle/Car Interactions
39
5 TRAJECTORY EXTRACTION
With the start and end times of the different trips
known along with identifying information about the
type of interactions occurring with motorists, the
corresponding video sections are isolated and
prepared for the next step, which relates to the
extraction of the trajectories in the video pixel
domain.
There are two approaches that can be used to
achieve the latter. The first approach is quite
straightforward but is only possible for a relatively
low number of trajectories. For each of the
trajectories, a simple script is used to extract the
frames from the video at 0.2 seconds allowing for the
user to manually click on the position of the bicycle
and the vehicles interacting with it. Two moving
perpendicular lines are implemented to assist a data
reductionist to detect the intersection of the front of
the bicycle wheel with the pavement as shown in
Figur 6. In the background, the script saves the
location of the clicks in the (x, y) domain of the video
frames (a 3720×1728 pixel grid); thus collecting the
trajectories for further processing. It is necessary to
note here that if any obstructions interfering with a
precise collection of the bicycle location from the
video frame exist (such as a car, a tree, or a structure),
the bicycle coordinates will not be collected for that
specific timeframe. An interpolation algorithm will
be used in a later stage to get an estimate at those time
steps.
Given that the described process for the extraction
of the bicycle trajectories is quite tedious both in
relation to the time and cost involved, the research
team opted to limit its use, at this time, to the
extraction of bicycle trajectories associated with
scenarios in which interactions with a vehicle
occurred, and for which a significant number of
events exists. In that regard, the research team applied
the aforementioned process to extract the trajectories
falling under scenario 2, 10, 43, and 44. This resulted
in the collection of 619 trajectories.
Before moving on to the description of the next
step, we would like to note that our final objective is
to extend this work to the extraction of the bicycle trip
events that occurred over the entire seven-month
period and for all the 14 locations on campus.
However, achieving that would require to introduce a
certain level of automation to complete the trajectory
extraction process. In fact, only 1.2 out of the
available 49.5 terabytes of available videos were used
so far. Assuming, hypothetically, that a perfect
proportionality exists between the number of bicycle
trips and the size of the video database, the expected
number of trips expected to be found in the entire
video dataset would be in excess of 90,000. Even
more, once the tasks requiring manual labor are
removed, the research community would have access
to a comprehensive automated trajectory extraction
framework that can be applied to similar videos.
In that regard, the research team is currently
working on developing an automated tool for the
extraction of the trajectories that can replace the data
reduction process. Without going into much detail as
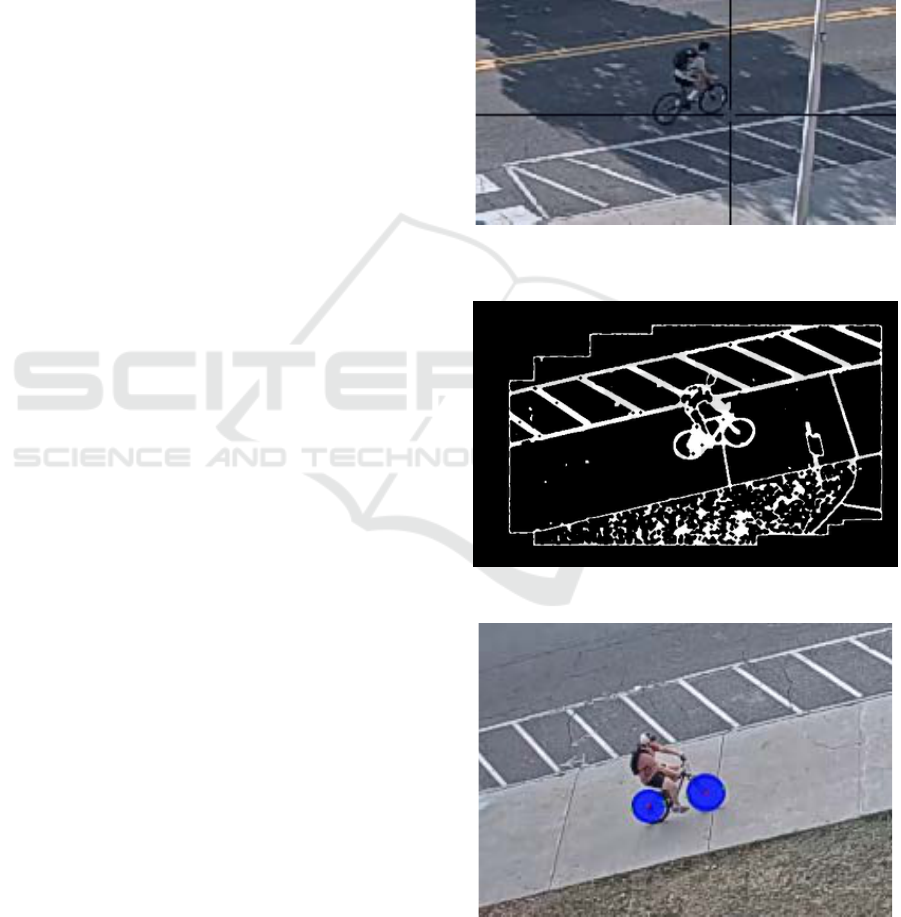
Figure 6: Sample screenshot from the trajectory collection
process.
Figure 7: Image filtering using edge detection techniques.
Figure 8: Detection of bicycle wheel using Hough
Transform.
VEHITS 2023 - 9th International Conference on Vehicle Technology and Intelligent Transport Systems
40

this is still a work in progress, the concept of the
algorithm consists of using the Hough transform for
the detection of bicycle wheels allowing the
determination of their contact point with the road
surface. To achieve that, edge detection techniques
are first used to isolate the bicycle trip on a black and
white background as shown in Figure 7. After that,
Hough transform is used to detect the wheels as
shown in Figure 8. However, the research team is
currently still working on solving the most
challenging part of this process, which deals with the
fine-tuning of the algorithm in relation to the
assignment of the detected points to their
corresponding trajectories and the automatic
exclusion of false positives.
6 INTERSECTION SURVEYING
In order to convert the extracted trajectories into
naturalistic trajectories, a grid map overlay of GPS
coordinates at specific locations, which are easily
identifiable both in the video frames and in the field,
is needed. In fact, the aforementioned map is the
element that would allow the conversion of the pixel-
based trajectories into distance-based trajectories
using the multi-step algorithm described thereafter.
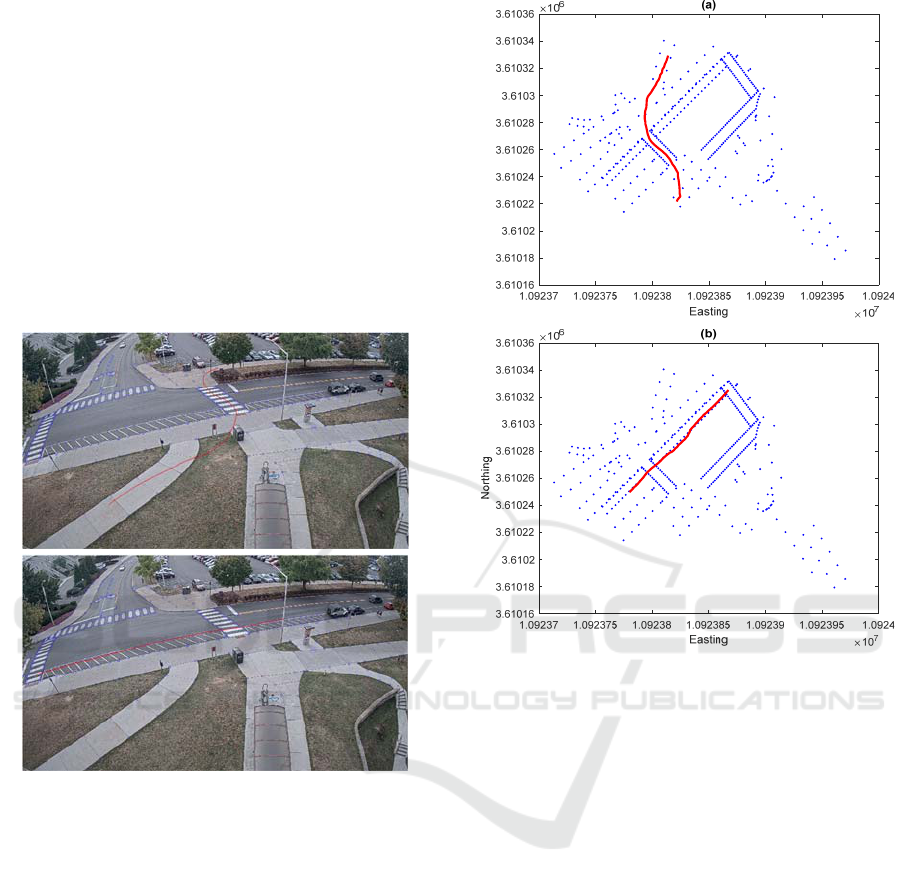
To achieve the stated objective, the research team
started by creating a mesh of approximately 400
points as shown in Figure 9. As the figure shows, the
points are heavily concentrated around the edges of
the sidewalks and the road crossings because they are
the easiest to identify in the videos as well as in the
field. That is quite useful for the next step as both the
sidewalks and the road crossings are the most used by
the bicyclists to complete their trips. Initial attempts
Figure 9: An aerial view of the surveyed area and the
collection points.
to collect the GPS coordinates at the specified
locations were made using accessible tools such as
Google Earth and existing GPS mobile applications.
However, those attempts proved unsuccessful due to
the small distances involved and the relative low
accuracy of those tools when used in this context. As
a result, a surveying campaign using professional
high-precision tools was conducted to acquire the
required coordinates, which are expressed in the
Northing-Easting-Elevation coordinates system.
Since the investigated area is relatively flat, the
elevation data can be ignored without major
repercussions on the results. In what follows, we will
refer to the data collected in this step by the transform
matrix.
7 RESULTS
The final phase in this research deals with the
conversion of the extracted trajectories that are
currently expressed in the video pixel domain to
actual naturalistic trajectories allowing access to the
distances traveled along with the associated speed and
acceleration profiles. That would constitute the final
product of this study and would allow traffic
researchers to validate their theories and models
against the resulting naturalistic bicyclist dataset. The
trajectory transformation process is achieved using
the following multi-step algorithm:
1. A linear interpolation algorithm is used initially
to complement the extracted trajectories with
estimated values at the level of the time steps for
which the determination of the bicycle location
was impossible due to the presence of visual
obstructions.
2. Next, the trajectories are exponentially
smoothed using a smoothing factor of 0.5. The
purpose of the exponential smoothing operation
is to address the noise and the zigzag-like
features that might be present as a result of the
manual trajectory extraction process. At this
level, the trajectories will look similar to the two
sample trajectories presented in Figure 10.
3. For each of the observations composing a
trajectory, one of the closest convex hulls
containing the observation and delimited by
three points from the transform matrix is
identified.
4. Since we have access to the coordinates of the
points defining the convex hull in both
coordinate systems, the coordinates of the
trajectory observation could be approximated in
the Northing-Easting coordinate system using a
triangulation algorithm.
Towards Building a Naturalistic Cycling Dataset Capturing Bicycle/Car Interactions
41
5. Once Step 4 is completed for all the
observations, the speed profile associated with
the obtained trajectory is determined and
smoothed through the application of a third
order Savitzky–Golay filter.
6. In a similar fashion to Step 5, the acceleration
profile is obtained from the smoothed speed
profile and smoothed using a similar Savitzky–
Golay filter.
The speed profile, the distance traveled, and the
coordinates of the trajectory in the Northing-Easting
coordinate system are updated backwards to account
for the effect of the two-layer filtering that was
applied.
Figure 10: Sample trajectories in the pixel domain.
Sample results from this step are presented in
Figure 11 and Figure 12. Figure 11 shows the
resulting trajectories in the Northing-Easting
coordinate system corresponding to the two
trajectories presented in Figure 10. The figure
demonstrates the success of the proposed multi-step
algorithm in conserving the shape and main features
of the extracted trajectory. Meanwhile, Figure 12
illustrates the distance traveled, speed, and
acceleration profiles corresponding to the trajectory
presented in Figure 10.a and Figure 11.a.
Figure 11: Sample naturalistic trajectories after the
triangulation procedure.
Finally, the histograms of the instantaneous
accelerations and speeds from all the 619 trajectories
is investigated to confirm the consistency of the
obtained values with bicycle behavior. The results,
which are plotted in Figure 13, show that the results
are concentrated around low acceleration levels and
speeds that are quite typical for bicyclists.
Furthermore, the range of the observed values can be
confirmed to be physically feasible for a bicycle. A
deeper look at the results is possible by looking at the
histograms corresponding to each of the four
investigated scenarios separately. For example, the
results for Scenario 2 are presented in Figure 14.
Northing
VEHITS 2023 - 9th International Conference on Vehicle Technology and Intelligent Transport Systems
42
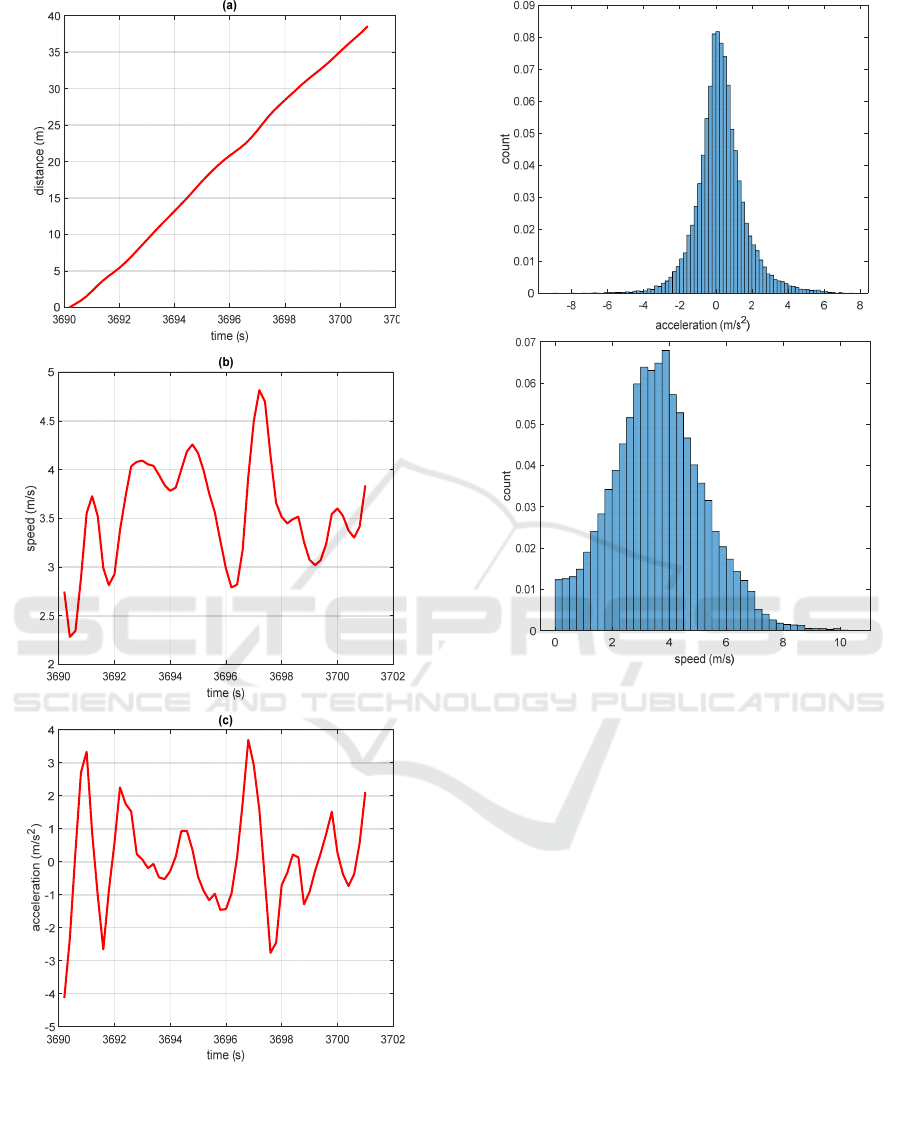
Figure 12: Extraction of the distance traveled, speed, and
acceleration profiles for a naturalistic trajectory a) Distance
traveled; b) Speed profile; c) Acceleration profile.
Figure 13: Histogram of the instantaneous accelerations and
speeds of the aggregated extracted trajectories.
8 CONCLUSIONS AND FUTURE
WORK
In the context of a better understanding of bicyclists’
behavior, this paper described the development of a
comprehensive framework that would allow for the
collection of naturalistic cycling trajectories from
video feeds. Even though the current naturalistic
dataset is composed of only 619 trajectories, it will be
useful to traffic researchers in several mobility
applications such as the validation of studies
investigating bicycle motion behavior like the model
(Alazemi, 2022) developed by the research team.
Furthermore, the collected trajectories will contribute
to a better understanding of bicyclists’ behavior
around cars leading to a better understanding of the
interactions between bicycles and other modes of
transportation. More importantly, the significance of
this work will be further accentuated once the
trajectories of the cars and other entities interacting
with the bicycles is extracted.
Towards Building a Naturalistic Cycling Dataset Capturing Bicycle/Car Interactions
43
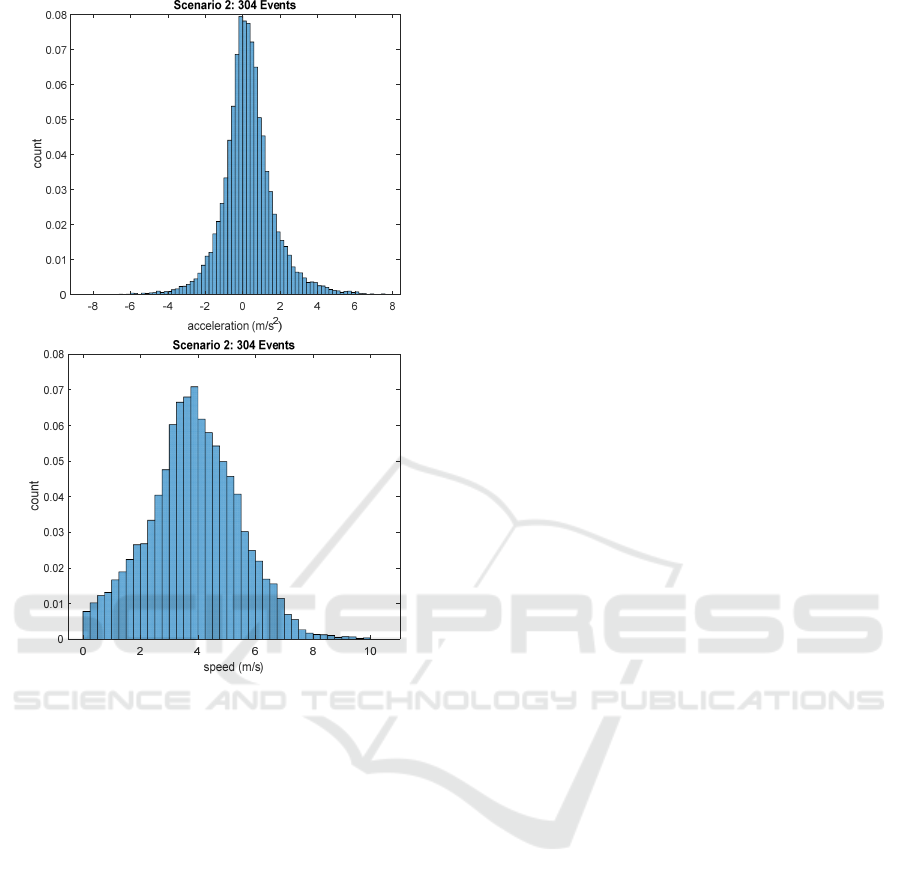
Figure 14: Histogram of the instantaneous accelerations and
speeds of the extracted trajectories corresponding to
Scenario 2.
The research team faced two main challenges
during this study. The first challenge deals with
automating the process of extracting the bicycle
trajectories from the videos through the detection of
bicycle wheels. In fact, the number of trajectories in
the resulting dataset is limited due to the problems
encountered while trying to complete that process.
Once those problems are addressed and the process is
entirely automated, the size of the trajectory database
will increase significantly. More importantly, the
proposed methodology will be completely
transferable for use by other researchers at different
locations. The second challenge relates to the
collection of the transform matrix needed to
transform the video trajectories into actual
trajectories. Due to the small distances involved,
typical tools such as Google Maps and existing GPS
applications cannot be used; instead, a professional
surveying campaign of the observed area is needed.
Overall, the findings of this research seem to be
consistent with actual bicycle behavior, which is
generally characterized by low acceleration levels. As
a future work, the research team plans to continue
extending this dataset and complement it with the
trajectories of the entities interacting with the
bicycles. Once that is achieved, this work will result
in a complete and comprehensive naturalistic dataset
that, not only include data relevant to the bicycle, but
also information about any vehicles or entities that
had an influence on its behavior.
ACKNOWLEDGMENTS
The authors acknowledge the financial support
provided by the University Mobility and Equity
Center (UMEC) and funding from the Ford Motor
Company.
REFERENCES
Alazemi, F. F., Karim; Rakha, Hesham; Mittal, Archak.
(2022). An Entropy-based Dynamics Model for Bicycle
Longitudinal and Lateral Motion Modeling 101th
Annual Meeting Transportation Research Board,
Andresen, E., Chraibi, M., Seyfried, A., & Huber, F.
(2014). Basic Driving Dynamics of Cyclists. In M.
Behrisch, D. Krajzewicz, & M. Weber, Simulation of
Urban Mobility Berlin, Heidelberg.
Brostow, G. J., Fauqueur, J., & Cipolla, R. J. P. R. L.
(2009). Semantic object classes in video: A high-
definition ground truth database. 30(2), 88-97.
Chen, L.-C., Zhu, Y., Papandreou, G., Schroff, F., & Adam,
H. (2018). Encoder-decoder with atrous separable
convolution for semantic image segmentation.
Proceedings of the European Conf. on computer vision
(ECCV)
Fadhloun, K., & Rakha, H. (2020). A novel vehicle dynamics
and human behavior car-following model: model
development and preliminary testing. International
Journal of Transportation Science and Technology, 9(1),
14-28.
Fadhloun, K. R., Hesham; Mittal, Archak. (2021). Bicycle
Longitudinal Motion Modeling. 100th Annual Meeting
Transportation Research Board.
Jia, B., Li, X. G., Jiang, R., & Gao, Z. Y. (2007). Multi-
value cellular automata model for mixed bicycle flow.
The European Physical Journal B, 56(3), 247-252.
https://doi.org/10.1140/epjb/e2007-00116-5
Jiang, H., Ma, Y., Jiang, L., Chen, G., Wang, D. J. P. A. S.
M., & Applications, i. (2018). Evaluation of the
dispersion effect in through movement bicycles at
signalized intersection via cellular automata simulation.
498, 138-147.
Jiang, R., Hu, M.-B., Wu, Q.-S., & Song, W.-G. J. T. s.
(2017). Traffic dynamics of bicycle flow: experiment
and modeling. 51(3), 998-1008.
VEHITS 2023 - 9th International Conference on Vehicle Technology and Intelligent Transport Systems
44

Kurtc, V., & Treiber, M. (2020). Simulating bicycle traffic
by the intelligent-driver model-Reproducing the traffic-
wave characteristics observed in a bicycle-following
experiment. Journal of Traffic and Transportation
Engineering (English Edition). https://doi.org/https://
doi.org/10.1016/j.jtte.2019.03.005
Li, Y., Ni, Y., Sun, J. J. S. M. P., & Theory. (2021). A
modified social force model for high-density through
bicycle flow at mixed-traffic intersections. 108, 102265.
Qu, Z.-w., Cao, N.-b., Chen, Y.-h., Zhao, L.-y., Bai, Q.-w.,
& Luo, R.-q. J. A. i. M. E. (2017). Modeling electric
bike–car mixed flow via social force model. 9(9),
1687814017719641.
Ren, G., Jiang, H., Chen, J., Huang, Z., Lu, L. J. P. A. S.
M., & Applications, i. (2016). Heterogeneous cellular
automata model for straight-through bicycle traffic at
signalized intersection. 451, 70-83.
Treiber, M., Hennecke, A., & Helbing, D. (2000). Congested
traffic states in empirical observations and microscopic
simulations. Physical Review E, 62(2), 1805.
APPENDIX
Scenario
Number
Criteria
Total
Criteria 1 Criteria 2 Criteria 3 Criteria 4
1 No interactions 1580
2 Straigh
t
A
head In path Same 304
3 Straigh
t
A
head Out of path Same 13
4 Straigh
t
A
head In path Oncoming 7
5 Straigh
t
A
head Out of path Oncoming 2
6 Straigh
t
A
head In path Stationar
y
0
7 Straigh
t
A
head Out of path Stationar
y
0
8 Straigh
t
A
head In path Latera
l
8
9 Straigh
t
A
head Out of path Latera
l
1
10 Straigh
t
Behind In path Same 132
11 Straigh
t
Behind Out of path Same 6
12 Straigh
t
Behind In path Receding 1
13 Straigh
t
Behind Out of path Receding 0
14 Straigh
t
Behind In path Stationar
y
0
15 Straigh
t
Behind Out of path Stationar
y
0
16 Straigh
t
Behind In path Latera
l
1
17 Straigh
t
Behind Out of path Latera
l
0
18 Straigh
t
Nex
t
Out of path Same 12
19 Straigh
t
Nex
t
Out of path Receding 0
20 Straigh
t
Nex
t
Out of path Stationar
y
0
21 Straigh
t
Nex
t
Out of path Latera
l
0
22 Turning
A
head In path Same 6
23 Turning
A
head Out of
p
ath Same 0
24 Turning
A
head In path Oncoming 0
25 Turning
A
head Out of path Oncoming 1
26 Turning
A
head In path Stationar
y
0
27 Turning
A
head Out of path Stationar
y
0
28 Turning Behind In path Same 1
29 Turning Behind Out of path Same 0
30 Turning Behind In path Receding 0
31 Turning Behind Out of path Receding 0
32 Turning Behind In path Stationar
y
0
33 Turning Behind Out of path Stationar
y
1
34 Turning Nex
t
Out of path Same 0
35 Turning Nex
t
Out of path Receding 0
36 Turning Nex
t
Out of path Stationar
y
0
37 Stopping
A
head In path Same 0
38 Stopping
A
head Out of path Same 0
39 Stopping
A
head In path Oncoming 0
40 Stopping
A
head Out of path Oncoming 0
41 Stopping
A
head In path Stationar
y
0
42 Stopping
A
head Out of path Stationar
y
0
43 Stopping
A
head In path Latera
l
123
44 Stopping
A
head Out of path Latera
l
60
Total 2259
Towards Building a Naturalistic Cycling Dataset Capturing Bicycle/Car Interactions
45
