
Automated Input Data Management for Discrete Event Simulation
Models of Emergency Departments
Juan David Mogollon
1
, Virginie Goepp
2
, Oscar Avila
1
and Roland de Guio
2
1
Department of Systems and Computing Engineering, School of Engineering, Universidad de Los Andes, Bogota, Colombia
2
I-Cube, INSA Strasbourg, France
Keywords: Emergency Department, Health Information System, Input Data Management, IDM, Discrete Event Simulation.
Abstract: Emergency Department (ED) overcrowding, that relates to congestion due to the high number of patients, has
a negative effect on patient waiting time. The analysis of the flow of patients through Discrete Event
Simulation (DES), that models the operation of a system through a sequence of events, is a relevant approach
to find a solution to such problem. This technique relies on high-quality input data which needs to be
previously managed in a complete process known as Input Data Management (IDM). The objective of this
research is to propose a tool to automate the IDM process required for DES models of ED. To do so, we used
a case with real data in order to contextualize the problem, evaluate required statistical methods, and gather
specific requirements. Based on these results, a prototype was designed and developed by using web and
cloud application development tools.
1 INTRODUCTION
One of the main problems in Emergency Departments
(ED) is over-crowding, which is according to Duguay
and Chetouane (2007), "the situation in which ED
function is impeded primarily because of the
excessive number of patients waiting to be seen,
undergoing assessment and treatment, or waiting for
departure comparing to the physical or staffing
capacity of the ED". Overcrowding is thus recognized
as a global problem, which has reached crisis
proportions in some countries. It has direct
implications for the well-being of patients and staff,
mainly due to waiting times derived from process
deficiencies, the inappropriate placement of physical
and human resources, and budget restrictions. In
addition, it can affect an institution's financial
performance and reputation (Komashie & Mousavi,
2005).
One of the strategies to mitigate the adverse
effects of overcrowding is using Discrete Event
Simulation (DES) to provide analytical methods to
assess and redesign processes and support data-driven
decision-making. In the ED context, DES models aim
to reproduce the flow of patients and their
relationship with the different areas, personnel, and
resources available to solve specific problems.
The success of DES applications depends on the
prior preparation of high-quality input data. Some of
the event data required in DES are represented in
probability distributions. The parameters describing
the underlying distributions are a key input for the
simulation. The process that involves transforming
raw data into a quality-assured representation of all
parameters appropriate for simulation is known as
Input Data Management (IDM) (Skoogh &
Johansson, 2008).
Input data preparation is one of a DES project's
most crucial and time-consuming tasks (Robertson &
Perera, 2002). According to (Skoogh et al., 2012) the
input data management process consumes about 10-
40% of the total time of a DES project. In most cases,
practitioners manually transform raw data from
different sources into appropriate simulation input
(Robertson & Perera, 2002) and separately from the
software used for the simulation. Automating the data
preparation phase can potentially increase efficiency
in DES projects by integrating data resources
(Skoogh et al., 2012). The IDM required to address
the problem of Overcrowding in ED must consider
automating the estimation of the probability
distributions required to simulate patient flow. These
statistics can be grouped into three categories: Arrival
Patterns, Routing Probabilities, and Processing Times
(Ghanes et al., 2015).
Mogollon, J., Goepp, V., Avila, O. and de Guio, R.
Automated Input Data Management for Discrete Event Simulation Models of Emergency Departments.
DOI: 10.5220/0011718600003467
In Proceedings of the 25th International Conference on Enterprise Information Systems (ICEIS 2023) - Volume 2, pages 31-42
ISBN: 978-989-758-648-4; ISSN: 2184-4992
Copyright
c
2023 by SCITEPRESS – Science and Technology Publications, Lda. Under CC license (CC BY-NC-ND 4.0)
31

While reviewing the literature, we found no
commercial IDM automation tool. We identified only
three open-source tools with such capabilities,
namely, GDM-Tool (Skoogh et al., 2011), DESI
(Rodriguez, 2015), and KE Tool (Barlas & Heavey,
2016). Although these tools have features for fitting
some statistical distributions, they do not fit all the
possibilities required for ED operation simulation,
such as Markov chains modeling. Some other gaps we
found when reviewing them include the fact that these
tools do not offer features for sharing data and results,
limiting the opportunities for collaboration by
allowing other researchers to replicate the process to
obtain similar outputs. Moreover, the reviewed tools
do not have features for managing projects,
generating data quality reports, handling large
datasets, or running intensive workloads; only
examples with small volumes of data on personal
computers are presented.
To identify potential current challenges in the data
preprocessing tasks in the case of a DES project
studying ED crowding, we analyzed a sample of the
patient flow data of the ED at the Hautepierre
Hospital located in the city of Strasbourg, France.
This analysis had two main objectives: (i) identify the
statistical methods to generate the required inputs in
a simulation of the patient pathway within an ED and
(ii) determine the preparation and validation
requirements that guarantee data quality. As a result,
we identified limitations regarding the automation of
the required processing.
In this context, the research problem addressed by
our research is: how to automate the IDM process for
DES models to address the overcrowding problem in
ED? To deal with this question, this article presents
the architecture of a cloud-based web application for
IDM, in which we provide the statistical methods
required to estimate the parameters needed to
describe the patient flow in ED and the management
features to handle the IDM tasks. Our approach
focuses on the definition and development of the IDM
software and not on the integration of enterprise data
or the simulation itself, as illustrated in Figure 1.
Figure 1: IDM Approach.
The article is organized as follows: section 2 presents
related work in the domain. Section 3 presents the
IDM requirements and evaluation of required
statistical methods from the analysis of the real case.
Section 4 introduces the IDM solution's architecture.
Finally, section 5 presents conclusions and
recommendations for future work.
2 RELATED WORK
Skoogh and Johanson (2008), defined Input Data
Management (IDM) as "the entire process of
preparing quality assured, and simulation adapted,
representations of all relevant input data parameters
for simulation models. This includes identifying
relevant input parameters, collecting all information
required to represent the parameters as appropriate
simulation input, converting raw data to a quality
assured representation, and documenting data for
future reference and re-use”.
Data collection has multiple inherent difficulties
(Bokrantz et al., 2018). Organizations can have
multiple data sources and systems to collect the data
from. Second, accuracy, reliability, and validity are
the analyst’s responsibility when extracting and
preparing the data for the simulation; those
procedures, in most cases, are made manually, which
makes it prone to errors. In a survey presented in
(Robertson & Perera, 2001), it was inquired about the
most frequent issues in simulation projects,
considering data collection issues: 60% of
respondents indicated they manually input the data to
the model; 40% reported they use connectors to an
external system like spreadsheets, text files or
databases.
In summary, as described in (Furian et al., 2018),
the main challenges in this process are, in the first
place, manual data collection and data entry, which
increases the likelihood of data entry errors arising
from human manipulation of data. The inherent
difficulties of the manual process compromise the
quality and integrity of the data. In addition, multiple
manual files handling to maintain and process data
makes it difficult to track errors and reproduce
procedures. Finally, data preparation requires specific
knowledge of techniques and algorithms, which could
lead to misuse of statistical packages and lead to
unexpected outcomes.
We identified only three of open-source
specialized in IDM for DES, GDM-TOOL (Skoogh
et al., 2011), DESI (Rodriguez, 2015) and KE tool
(Barlas & Heavey, 2016). To the extent of our
knowledge, no survey or study compares them, or use
them in the ED context. We analyzed such tools in the
ICEIS 2023 - 25th International Conference on Enterprise Information Systems
32
following section by using criteria extracted from the
requirements in the case of Hautepierre Hospital.
3 IDM FOR ED
This section focuses on analyzing the IDM tasks
enabling to prepare statistical representations of the
patient flow data of the ED of the Hautepierre
Hospital in Strasbourg (France). In addition, we
evaluate IDM tools that could be used for the
analysis.
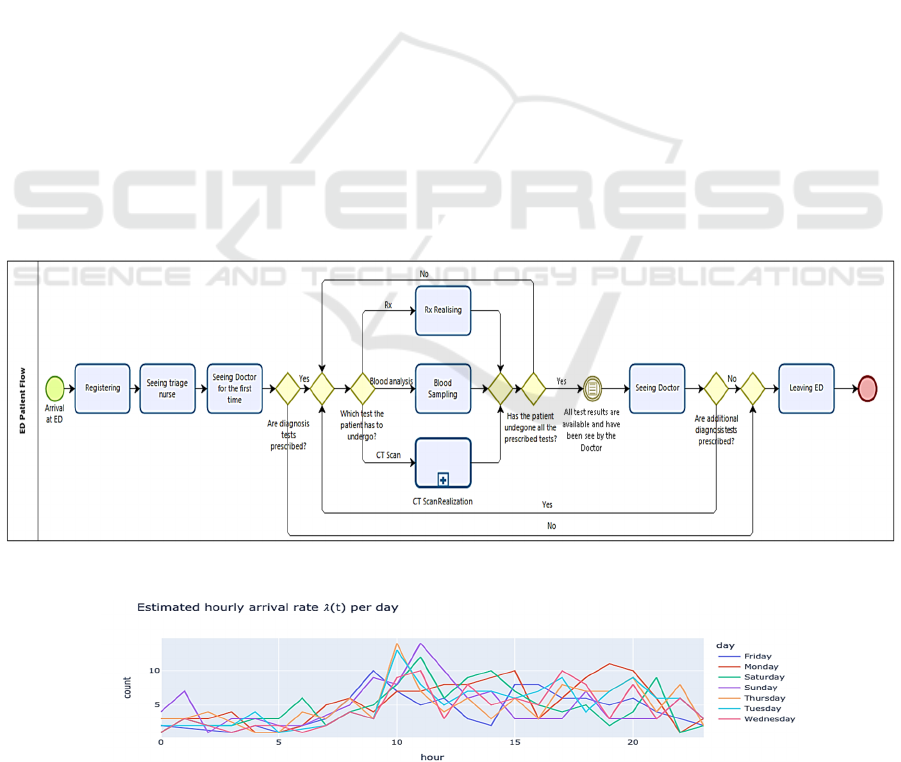
3.1 Emergency Department Description
To analyze the overcrowding problem, it is necessary
to know in advance the configuration the ED, which
depends on the needs, staff, capacities, and areas of
the health institution. We sketch thus the main steps
of the patient flow of the Hautepierre Hospital ED in
Figure 2. In the diagram, the patient flow is
represented linearly as patients perform each of the
activities consecutively. However, it is worth
mentioning that there are iterations between the
stages, as patients may require a procedure to be
repeated or an exam to be performed multiple times.
In addition, patients may undergo many different
paths and not necessarily goes through all the steps of
the process. The number and types of diagnosis tests
(blood analysis, RX or CT Scan) depend on the
consultation and are not known as the outset, that is
why we model the pathway using routing
probabilities.
The data were provided in comma-separated
values (CSV) files extracted from the ED databases.
The files contained anonymized records of patients
and the events during their stay in the ED. The
collected data contains records from June 22nd, 2020,
to June 28th, 2020, of the ED flow of 795 patients.
The records include information on the following
events of the patient flow: arrival, triage, blood
analysis (BA) (Coagulation, Hematology,
Biochemistry), Computer tomography (CT) Scan,
and X-rays (RX). The average throughput time is 5,52
patients/h. We consulted the physicians to check the
consistency of data, as we had to deal with multiple
files from different data sources.
The ED uses a severity index for the assignment
of degrees of emergency to decide the priority and the
order of procedures. It considers three levels of
severity identified by colors: red for immediate care,
orange for cases that can be taken care of within the
hour, and green for not urgent care. According to each
severity level, the patients are assigned to one of three
zones in the ED.
Figure 2: Hautepierre Hospital ED BPM.
Figure 3: Estimate hourly arrival rate.
Automated Input Data Management for Discrete Event Simulation Models of Emergency Departments
33

3.2 Statistical Analysis
3.2.1 Analysis Description
Different types of metrics are required to simulate an
ED, which can be grouped into three categories:
Arrival Patterns, Routing Probabilities, and
Processing Times (Ghanes et al., 2015).
Arrival patterns. The arrival patterns refer to the
measurements made to the patients at the time of
entering the emergency room. The metric used in this
case is the arrival rate per hour/day.
For the modeling we consider 𝑁𝑡 the number of
patients arriving at the emergency room at a particular
time 𝑡. It is assumed that patients arrive randomly and
independently. In that case, it is possible to model the
patient count as a Poisson process of parameter 𝜆.
However, when considering the temporal dependence
of the counts, it can be considered as a Non-
Homogeneous Poisson process with rate 𝜆𝑡. For the
estimation it is assumed that the rate is piecewise
constant on a set of time independent intervals. Given
that 𝑁𝑡 is a Poisson process with rate 𝜆𝑡 the
distribution of the interarrival time follows an
exponential distribution of parameter 𝜆𝑡.
Routing probabilities. For the estimation of
routing probabilities, we consider the sequence of
events observed in the data as a Markov Process
(Baum & Petrie, 1966), in which each state represents
one event in the process, such as triage, or blood test,
among others. The transition probabilities associated
with the Markov Chain are in consequence, the
routing probabilities. For the verification of this
model, the following hypothesis tests on thproperties
of the chain are considered: Markov property, order,
and stationarity of the transition probabilities, and
sample size (Anderson & Goodman, 1957).
Processing times. In the case, three elements can
be distinguished in the processing times. The waiting
times from the prescription of the exams to the
moment they are performed, the time it takes to
complete the exam and the additional waiting time to
get the results. Once the data were adequately
arranged, we iterate over a set of continuous
distributions to identify the one with the best fit for
each variable. To test the goodness of fit, we used the
Kolmogorov- Smirnoff test (Massey, 1951) in which
the null hypothesis evaluates that the data follow
some specific distribution
3.2.2 Results Analysis
Arrival Patterns. Firstly, the non-homogeneous
Poisson process was estimated and the parameter 𝜆
was determined for all the one-hour intervals. Figure
3 shows the behavior of the parameter for all the days
of the week, which can be evidenced by the bands of
greater congestion and the peaks of patient arrivals
during the day. The x-axis indicates the hours of the
day, and the y-axis is the number of patients. The
curves represent the behavior of the intensity
parameter for each day of the week. From these
arrival patterns it is possible to construct the
distribution of arrivals and inter-arrivals per hour,
following the deduction mentioned above.
Routing Probabilities. The chain states are
represented as the nodes of the Figure 4, which
describes the transition matrix that indicates the
probability of moving from one state to another. We
can see that after triage, for example, the probability
that a patient undergoes a blood test is 0.48, while not
going through any stage is 0.44. Patients do not
usually go directly from Triage to RX or MRI CT
Scan; generally, to obtain these tests, a blood test is
performed beforehand, where 70% are referred to one
of these two tests. For Markov property, the Q
statistic is 4535.63 and the p-value is: 1.0. Taking
alpha = 0.05 there is statistical evidence to not reject
H_0, there is no evidence to reject the hypothesis that
the process satisfies the Markov property.
Figure 4: General routing probabilities.
Processing Time. After triage, the subsequent most
frequent examination is a blood test. The collected
samples are used for three evaluations, Biochemistry,
Hematology, and Coagulation. For the Biochemistry
blood analysis, we consider the distinction by severity
index, and plot the histogram and the fitted
distributions as seen in Figure 5.
ICEIS 2023 - 25th International Conference on Enterprise Information Systems
34
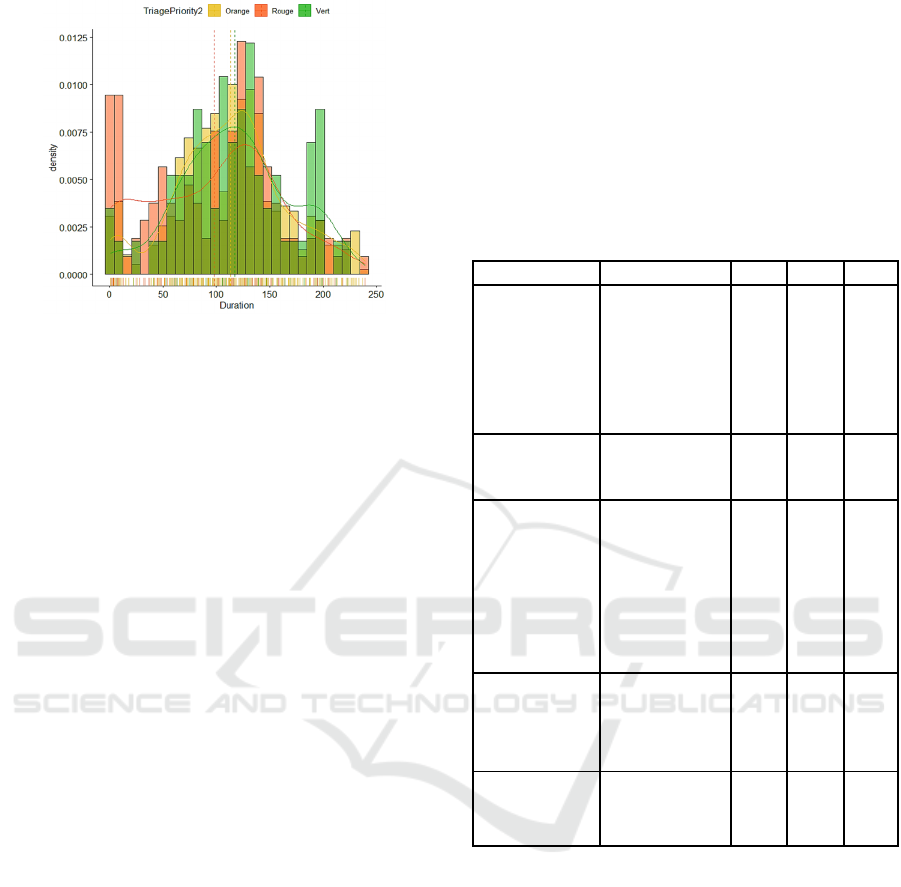
Figure 5: Biochemistry BT duration.
3.3 Requirements
We gathered requirements in terms of user stories
through manual process analysis and interviews with
an expert doctor and two DES researchers.
Functional:
(1) Manage Input Data: As a user, I want to
manage my datasets so I can analyze it on the
platform. Acceptance criteria: Upload resource,
encrypt and version files.
(2) Check Data Quality: As a user, I want to check
the quality of my dataset so I can make sure my
dataset is appropriate for simulation. Acceptance
criteria: Perform data quality checks, generate data
quality reports.
(3) Process Data: As a practitioner user, I want to
process my input data and obtain statistical
representations of my variables in a compatible
format for the simulation software. Acceptance
criteria: Display variables, fit distribution, display
results, export results.
(4) Reproducibility: As a user, I want to replicate
the analysis and results of my projects so I can make
research reproducible. Acceptance criteria: Public
repository, share data, share results.
Non-functional:
(5) Availability: As a user, I want the site to be
available 99.9 percent of the time I try to access it so
that I can trust the application and need another and
do not need another app.
(6) Scalability: As a user, I want the application to
support traffic spikes and several simultaneous
processing requests so that no delays in the results
should happen.
(7) Security: As a user, I want the application to
ensure encryption for all my data so that is no risk
associated with the exposure of confidential
information.
3.3.1 Existing IDM Tools
The analysis of existing IDM tools is made through
criteria extracted from the requirements identified
before. We identified only three tools: GDM-TOOL
DESI (Skoogh et al., 2011), KE tool (Barlas &
Heavey, 2016) and DESI (Rodriguez, 2015). The
specific gap between the tools’ characteristics and the
requirements are presented in Table 1.
Table 1: Evaluation of IDM tools.
Category Criteria GDM KE DESI
Manage input
data
Manage projects No Yes Yes
Load data Yes No No
Encrypt files No No No
Version files No No No
Data storage No No Yes
Data collection Yes No Yes
Check data
quality
Check data
q
ualit
y
No Yes No
Reports No No No
Process data
User interface Yes No Yes
Visualization No Yes Yes
Fit distributions Yes Yes Yes
Fit Markov chain No No No
Hypotesis testing No No No
Display results Yes Yes Yes
Export results Yes Yes Yes
Reproducibility
Public repository No Yes No
Cloud available No No No
Share data No No No
Share results No No No
Non-functional
Availability No No No
Scalability No No No
Security No No No
Manage Input Data: All the tools have data
loading features, GDM-Tool (Skoogh et al., 2011),
and DESI (Rodriguez, 2015), have features for data
collection and use a database for storage. None of the
tools has encryption, and versioning features.
Check Data Quality: The comparison of the tools
in this criterion showed that only KE Tool (Barlas &
Heavey, 2016) has methods for evaluating the input
data. None of the tools has features to generate reports
on the quality of the input data.
Process Data: it was found that all the tools have
features for exporting data, displaying results, and
adjusting statistical distributions. GDM-Tool
(Skoogh et al., 2011), and DESI (Rodriguez, 2015)
have a user interface. KE Tool (Barlas & Heavey,
2016) and DESI (Rodriguez, 2015) show graphs of
Automated Input Data Management for Discrete Event Simulation Models of Emergency Departments
35
the obtained distributions. Although the KE Tool
(Barlas & Heavey, 2016) does not have a user
interface, it is possible to generate graphs from the
code in the development environment. None of the
tools adjust specific distributions such as Markov
Chain or evaluate the hypothesis of their properties.
Reproducibility: KE Tool (Barlas & Heavey,
2016), is available in a public repository. However,
none of the tools is available in the cloud, and they do
not have features for sharing data and results
obtained.
Non-Functional: The evaluated applications are
desktop apps, where availability, security, and
scalability are not concerned.
4 ARCHITECTURE
We present our architectural decisions through
different diagrams (reference, context, deployment,
application layers, deployment in AWS) to provide a
top-level view of a software’s structure representing
the principal design and understanding of the
problem. We propose adopting cloud infrastructure
instead of on-premises infrastructure by considering
three characteristics of the former model:
manageability, scalability, and cost. In the first place,
there is an intrinsic responsibility for managing the
entire hardware and software stack on the on-
premises setting, which implies the ownership and
administration of servers, databases, networks, and
containers, among others. The cloud services take
away the burden of managing the required
infrastructure, the provisioning, and maintenance of
software (Narasayya & Chaudhuri, 2021). In a cloud
environment, provisioning instances to meet the
desired response time is easily configurable. In an on-
premises setup, scalable architecture is possible but is
limited to implemented resources and budget. In
addition, in cloud setup, there can be a reduction in
the total cost of ownership (TCO) mainly regarding
capital expenditure (Capex) (Qian et al., 2009).
The software architecture described in the
following subsections will adopt a fully decoupled
microservice pattern to cover two main non-
functional concerns: availability and scalability. Each
element can be scaled independently in a cost and
time-effective manner in this architecture, which is
essential when handling several simultaneous
processing requests and large datasets. In addition, it
is also more manageable to maintain due to its
relatively smaller size.
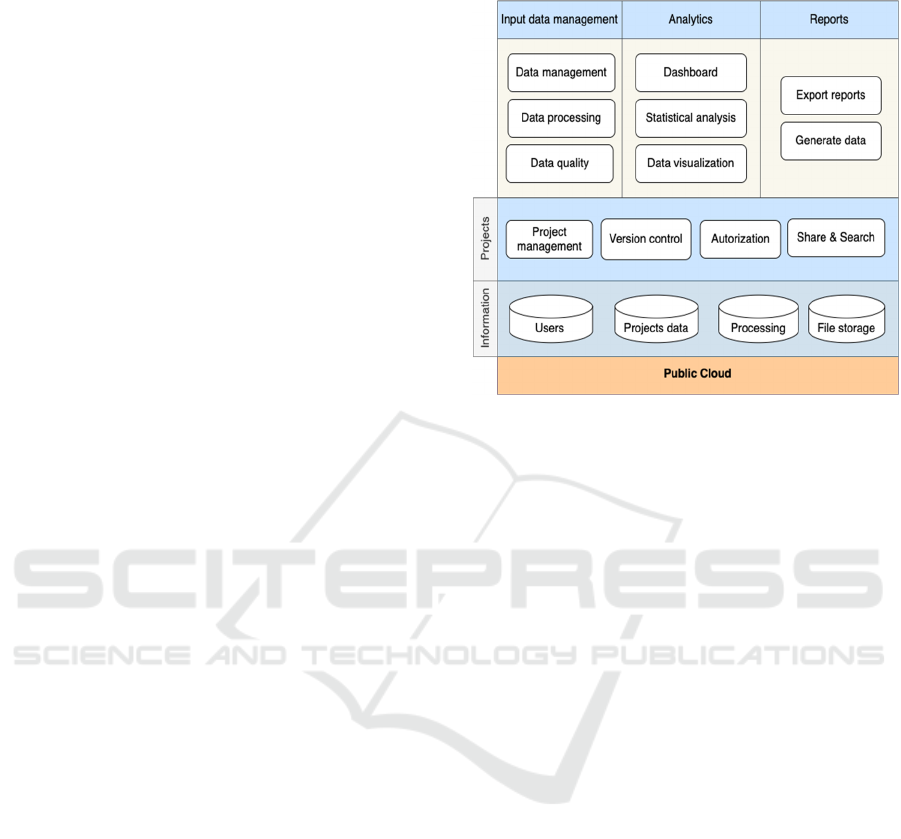
4.1 Software Architecture
Figure 6: Software architecture.
This section describes each area of the software
architecture that we propose in Figure 6, namely,
IDM, analytics, reports, projects, and information.
Input Data Management
: Data management:
The system should provide a mean to ingest high
volumes of data, persist it and store it securely.
Data quality: The service must outline data quality
issues and provide visualizations and reports to the
user. Data processing: The platform must process
all the data according to the user configuration and
apply convenient transformation for analytical
purposes.
Analytics
: Dashboards allow the user to quickly
gain insights into the critical metrics and
information relevant to him. It also provides
means for identifying potential issues that require
imminent
action. Statistical analysis: It provides
summary statistics of variables, fits statistical
distributions, estimates parameters, and test goodness
of fit hypothesis. Data visualization: Visualization
techniques provide the user with a clear representation
of information to get quick data insights.
Reports: Export report: It enables the user to have
a portable version of the results of the data quality
inspection, data processing, and the statistical analysis
in html format. Generate data: The platform has to
provide the user a mechanism to generate synthetic
data that mimic the system’s original data according
to the statistical distributions of the processes
.
ICEIS 2023 - 25th International Conference on Enterprise Information Systems
36
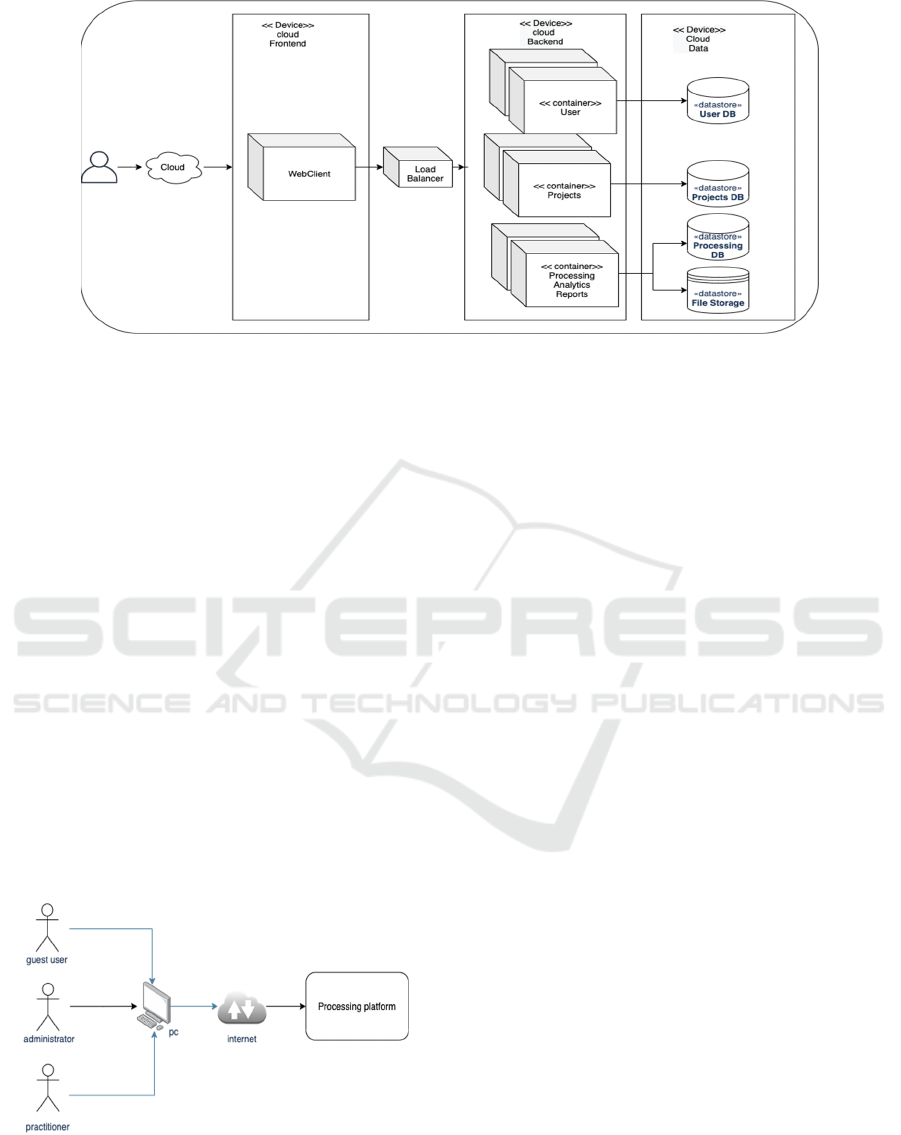
Figure 8: Deployment diagram.
Project
: Project management: Projects allow
the user to organize and centralize the resources,
and arrange data
, analysis, and reports. Version
control: it keeps track of versions of the projects and
their resources in an organized manner.
Authorization: It allows the administrator to manage
roles and permissions over the project’s context. It
provides a good way to secure files. Share and search:
Provide mechanisms for indexing and cataloging data
sources and analysis objects in order to facilitate the
searching and sharing of files.
Information: Users: The database dedicated to
centralizing the user’s data, roles, and authorizations.
Projects data: A dedicated database for project data
management. Processing: All the data allocated in
memory during the processing. File storage: The
excepted contents of the system are the original data
sources, transformed data, metadata, parameters,
results, reports.
4.2 Context of the Application
Figure 7: Context diagram.
The intended users are researchers and practitioners
involved in the DES field. It considers three types of
users: administrators, practitioners, and guest users as
seen in Figure 7. The administrator and practitioners
can login, create
projects, manage input data, version
resources, share resources, analyse data, generate
reports, generate data quality reports. Practitioners
require an invitation from an administrator for
creating an account. Guest do not need an account but
require an invitation from
an administrator to see a
project and generate reports.
4.3 Deployment of the Application
Figure 8 shows the system structure, the current
understanding of the artifacts and how they will be
deployed. First, the user accesses the application
through a web client hosted in the cloud, specifically
in a front-end component of the application. A load
balancer act as a firewall and manage application
loads, then a there is a back-end component based on
three microservices: User, Projects, and Processing,
analytics, and reports. All of them have a dedicated
database, and the last one has also an object storage.
4.4 Prototype
The application prototype was built using two
lightweight software development frameworks,
FastAPI (backend) and React.js (frontend). These are
appropriate for this type of application as it is a small
application with simple logic.
Microservices. The application has three
microservices containerized using Docker, which
hosts a REST-API created using the FastAPI python
framework that exposes the service methods. Each of
these microservices can access the storage services on
one side to the Postgres database hosted in AWS
RDS.
Automated Input Data Management for Discrete Event Simulation Models of Emergency Departments
37

Elements of the User Interface (UI). It includes
basic elements, such as input controls, navigation and
information components and containers, to offer a
simple interactive experience in which IDM is
presented through a series of steps that do not require
further configuration by the user to obtain the data
reports (see Figure 9).
Figure 9: Data processing steps.
The first step is the creation of a project, in which the
user must enter a name and description of the project
and a label to reference. Then the user can load the
files required to be processed following the template
provided for this purpose. Once the file is loaded, if it
corresponds to the structure required, the
corresponding validations on the data will be
executed. The next step is the data processing where
the statistics are estimated. The last step corresponds
to the menu where the user can share private links to
the resources or download the reports. Regarding the
data processing functionality, estimated parameters
of the arrival process, the inter-arrival, the routing
probabilities, waiting and processing times
distributions are generated online under demand. The
results are presented in a dashboard containing three
pages, one for each analysis category.
Figure 10 shows an example of the dashboard
with the properties of the Markov chain. It shows the
results of evaluating the properties of the Markov
chain and the transition matrix associated with the
process. Two buttons allow the user to go to the other
sections for navigation within the dashboard.
Clicking on the routing probabilities option displays
the dashboard with three main elements. First, some
information cards are shown with the results of the
hypothesis tests that verify the properties of the
Markov chain, as are the Markov property, order, and
stationarity. The processing microservices perform
the calculations, and the results are presented to the
user in cards as seen in Figure 10. The third page of
the dashboard presents a drop-down list from which
it is possible to choose the activities that are used as
the starting point of an activity, process or waiting
time. Then a graph is displayed with the histogram of
the data, the kernel density, and the fitted density.
4.5 Deployment in AWS
The web application proposed in this article uses
some of the tools available in Amazon Web Services,
which follow the usual deployment patterns for the
proposed architecture. Route53 is used to register the
website domain and to redirect traffic. In addition, we
use Elastic Load Balancing (ELB), the service
managed by Amazon, for load balancing between
applications, in order to distribute the application
traffic, determine the scaling of resources on demand,
and keep hidden the IPs of the microservices where
the user information is hosted. To manage the
containers where the microservices of the application
are hosted, Elastic Container Registry is used to
register and store the images of the containers, which
facilitates the deployment using Fargate. The
processing microservice has access to the data hosted
in a RDS database instance, which can scale
horizontally under demand. For Front-End content
delivery we use CloudFront, the low-latency, highly
available and secure content delivery network service
that does not depend on a particular region. The
Simple Storage Service (S3) is used to store the files
that users import into the application, as well as the
reports that are generated on data quality and statistics
processed by the application.
Figure 10: Dashboard elements: Markov chain properties and routing probabilities.
ICEIS 2023 - 25th International Conference on Enterprise Information Systems
38
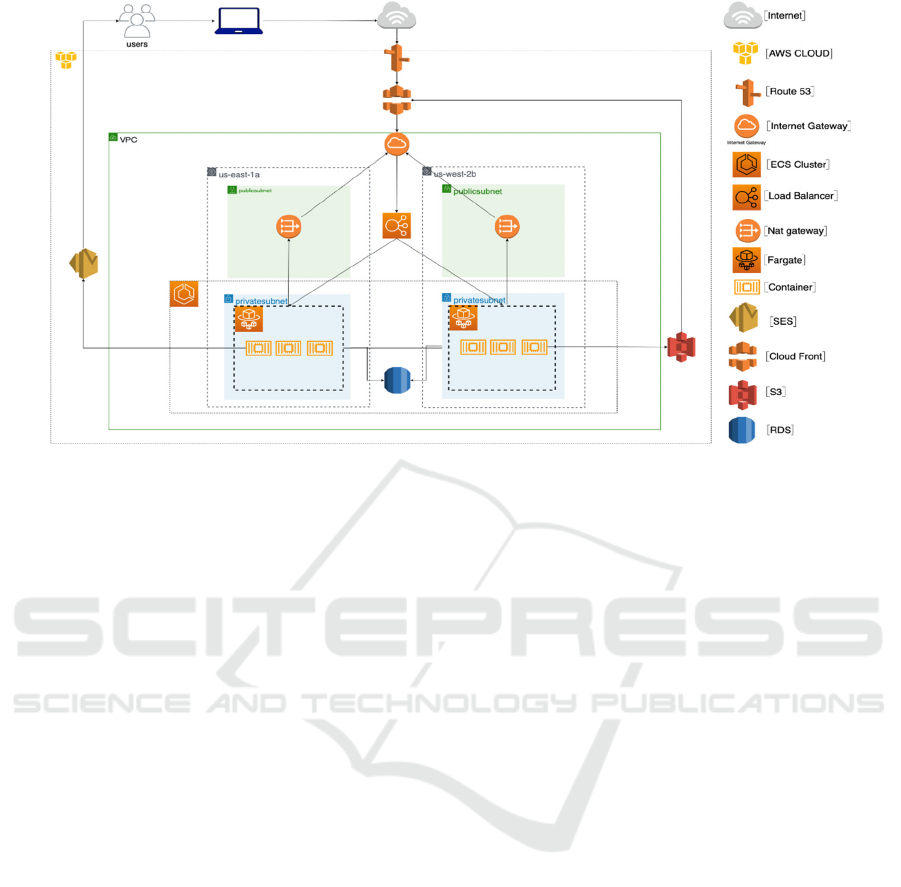
Figure 11: Deployment diagram in AWS.
Several security measures were considered to secure
and protect user data. First of all, the application uses
Virtual Private Cloud (VPC) to group the computing
resources and database of the project securely. The
output to the Internet of the VPC resources is through
internet Gateway only. Also, the object storage S3
encrypts all original user data. On the other hand, the
load balancer acts as a firewall so that the APIs that
expose the microservices cannot be accessed directly.
In addition, the proposed architecture considers the
use of public and private subnets so that the response
data of the microservices does not go directly to the
Internet but through a Nat-Gateway that routes the
response. Last but not least, the credentials, API keys,
and
database access data were stored encrypted in
AWS Secrets Manager. Furthermore, to promote
service availability, it was planned to deploy the
application in two availability zones: us-east-1a and
us-west-2b. Moreover, to ensure that the application
responds to intensive workloads, an autoscaling
group was defined to increase the number of
processing instances if needed.
Regarding the client-side design, all requests
made from the client side are handled by FastAPI.
Within the application, design React handles two
types of users: administrators who are in charge of
creating projects and guests. For the verification and
authorization of administrators, both client-side and
server-side, an access token creation system, JWT,
was used. React is responsible for the user interface
and for making the corresponding HTTP requests to
the application server.
For the server-side design, the model presented in
Figure 11 shows all the elements involved on the
server-side. The boxes group together: the AWS
cloud represented by the AWS cloud logo, the Virtual
Private Cloud (VPC), the availability regions
identified by the texts "us-east-1a", "us-east-1b". The
green background distinguishes the private subnets
by the blue background, and finally, the Elastic
Container Service (ECS) cluster is distinguished by
the ECS logo.
Users access the application via internet through
the website whose domain is registered with Route53.
Once accessed, the site content is delivered by Cloud
Front, which queries the static Front- End files stored
in S3. In AWS, the application has a VPC to isolate
the compute resources, storage, and subnets securely.
The point of contact of the VPC with the Internet is
the Internet Gateway. Requests received through this
point are directed to the load balancer responsible for
redirecting the request to the containers hosted in
Fargate. The containers host the application’s
microservices and access the RDS database, S3 object
storage, and SES mail delivery services.
The microservices are hosted on a private subnet,
which means they cannot be accessed directly and
cannot deliver request responses directly to the
Internet. It is necessary to use the Nat gateway
available on the public subnet. The proposed
architecture complies with several elements to secure
servers and user data, such as using a VPC, private
and public subnets, a load balancer that serves as a
firewall and encrypting the data in S3 in the RDS.
Likewise, the multi-region deployment favors the
Automated Input Data Management for Discrete Event Simulation Models of Emergency Departments
39

availability of the application. In terms of scalability,
the ECS cluster configuration has an auto-scaling
policy to increase the number of instances required
for processing in case of traffic spikes.
4.6 Validation
The application’s validation consisted of verifying
requirements with end-users. Table 2 shows the result
of reviewing the requirements, the microservices, and
the AWS components used to satisfy each
requirement. Validation involved expert input from
two simulation specialists and hands-on involvement
from two students working with real data. End-user
feedback was gathered through periodic validation
sessions during prototype development. As we can
see in Table 2, all requirements were satisfied through
the application. In addition, the end-users transferred
knowledge about ED processes and data, proposed
and evaluated data analysis strategies, and requested
features for visual components, navigation, and data
results.
Table 2: Mapping of requirements and architecture’s areas
and components.
Feature Container AWS Service
Registry Users Fargate
Login Users Cognito, SES
Delete account Users Fargate
Create project Projects Fargate
Invite User Projects Fargate
Search project Projects Fargate, RDS
Delete project Projects Fargate
Manage data Processing Fargate
Download Data Processing Fargate, S3
Data quality Processing Fargate
Dashboard Processing Fargate. CloudFront
Process Data Processing Fargate, RDS, S3
Security
Subnets, Load
Balancer, Autoscaling
Grou
p
Scalability
Load Balancer
Autoscaling
Availability Multi AZ
Functional Test. Benchmark against KE-Tool.
One of the tests performed to validate the reliability
of the results was to process and obtain the probability
distributions using another IDM tool. The test
consisted only of estimating the probability
distributions of the data, as the other characteristics of
the applications are not directly comparable. We
compared the results of the statistical distributions
generated by the application against those generated
using the KE tool, the only tool we found in a public
repository. The comparison was performed in terms
of the KL divergence, the observed values were close
to zero so we can affirm that there is no divergence,
which means that the information distributions found
in both programs are similar.
Non-Functional Requirements: As mentioned
earlier, we considered non-functional scalability,
availability, and security requirements. The proposed
architecture facilitates storing and processing files
and scaling on-demand. The application achieves this
through the use and configuration of amazon’s
processing and storage services appropriate for this
application, such as the object storage service and the
configuration of the auto-scaling groups. On the other
hand, optimized libraries were used for distributed
data processing, thus reducing processing times. The
availability and security of the application is achieved
by implementing AWS services, such as RDS multi-
AZ, availability zones, VPC, subnets, and load
balancer. The availability is assured using two
availability zones, and the security requirements are
covered with object storage encryption.
Load Test. To assess the non-functional
scalability requirement, we tested the processing
microservice's ability to handle a certain number of
HTTP requests per minute. We assume the system is
completely degraded when a failure rate greater than
99% occurs. The web service https://loader.io/ was
used to send the requests to the necessary endpoints.
The auto-scaling configuration enabled up to 5 ECS
tasks. We observed the system completely degrade
when receiving 1500 requests in 15 seconds. And also
if more than 6000 requests are received in two
seconds. We found evidence of using the maximum
number of enabled instances, thus satisfying the
requirement.
5 DISCUSSION
This section discusses the advances that the proposed
application brings concerning the previous
propositions in the literature as well as our
ICEIS 2023 - 25th International Conference on Enterprise Information Systems
40

contributions to meet the needs identified from data
analyzed.
Qualitative features comparison. The proposed
solution has storage services such as databases for
microservices. It uses s3 object storage to store all
user information. The results obtained can be
reproduced on-demand and facilitate the sharing of
the original files, unlike DESI (Rodriguez, 2015),
which has a temporary storage of the processed
records. Additionally, the prototype integrates a
feature for checking data quality that performs unit
tests on the input data, unlike the KE Tool (Barlas &
Heavey, 2016) that performs unit tests only on the
methods of the classes that perform the processing.
Unlike KE Tool (Barlas & Heavey, 2016) and
DESI (Rodriguez, 2015), the prototype has a more
robust user interface with navigation, information,
and visualization elements, that facilitates
visualization of distributions, particularly the
Markov Chain analysis results. Decisions are
presented using the usual agile architecture diagrams
such as context, deployment, components, classes,
and soon unlike KE Tool (Barlas & Heavey, 2016),
which illustrates a single high-level diagram of the
system elements
The way in which the components fulfill the
requirements is described below.
Manage Projects: The project microservice has
methods for creating projects. Once a project has
been created, the user can invite other users to view
the content of the dashboards through a private link,
which is generated in the project microservice. When
a user wants to invite another user to the application,
a record of the guest’s email address is saved in the
database, then an email invitation to the project is
sent to the user.
Fit Distribution: In the dashboard, in the section
of the adjustment of probability distributions, once
the user selects a particular activity, the microservice
is responsible for identifying the best distribution.
Check Data Quality: Rules were generated to
validate the data at a stage before processing. It is
worth mentioning that these rules do not limit the
user to continue with the statistics generation process
but serve to alert the user to avoid compromising the
results of the estimations due to errors in the data.
User Interface: The processing microservice has
a dashboard developed in Dash and Plotly that has
three pages where all the statistics generated are
displayed. This microservice is a python module in
which each page of the dashboard is an independent
module, which facilitates the maintenance and
editing of the visual components. The data is
presented in graphs and tables, making it easy for the
user to quickly learn about the data distributions.
Markov Chains Validation: We implemented
features for fitting Markov Chains and performing
hypothesis testing to verify Markov chain properties.
6 CONCLUSION
By reviewing the literature and examining the real
data, we defined the basic requirements that an IDM
solution for DES should fulfil such as: managing the
input data, verifying the quality of the data,
processing and presenting process statistics in
dashboards. We also analyzed probability
distributions to be implemented in such application by
using a real case. The proposed solution introduces
therefore a cloud architecture that satisfies the
requirements based on a microservices pattern that
will enable high performance, availability, scalability,
and security.
The novelty of this paper is the integration of
Markov chain modeling to IDM, the proposed cloud
architecture, the design, development and testing of
the software, and the implementation with real data in
the context of ED. The built application has elements
that had not been previously used in similar tools,
such as cloud computing services, containers, unit
testing on data and interactive visualization.
Additionally, the application implements
straightforward and intuitive navigation tools in order
to benefit user experience.
As future work, the results obtained in the
evaluation of the properties of Markov chains rise to
the question on how to approach the preparation of
data for simulation models that consider routing
probabilities for the problem of overcrowding in ED.
Last, it would be desirable to adjust the code so that
the processing is generic for data of similar data
sources where IDM is required, such as
manufacturing.
REFERENCES
Anderson, T. W., & Goodman, L. A. (1957). Statistical
inference about Markov chains. The annals of
mathematical statistics, 89-110.
Baum, L. E., & Petrie, T. (1966). Statistical inference for
probabilistic functions of finite state Markov
chains. The Annals of Mathematical Statistics, 37(6),
1554–1563.
Barlas, P., & Heavey, C. (2016). KE tool: an open source
software for automated input data in discrete event
Automated Input Data Management for Discrete Event Simulation Models of Emergency Departments
41

simulation projects. In 2016 Winter Simulation
Conference (WSC) (pp. 472-483). IEEE.
Bokrantz, J., Skoogh, A., Lämkull, D., Hanna, A., & Perera,
T. (2018). Data quality problems in discrete event
simulation of manufacturing operations. Simulation,
94(11), 1009-1025.
Duguay, C., & Chetouane, F. (2007). Modeling and
improving emergency department systems using
discrete event simulation. Simulation, 83(4), 311-320.
Furian, N., Neubacher, D., O’Sullivan, M., Walker, C., &
Pizzera, C. (2018). GEDMod–Towards a generic
toolkit for emergency department modeling. Simulation
Modelling Practice and Theory, 87, 239-273.
Ghanes, K., Jouini, O., Jemai, Z., Wargon, M., Hellmann,
R., Thomas, V., & Koole, G. (2015). A comprehensive
simulation modeling of an emergency department: A
case study for simulation optimization of staffing
levels. In Proceedings of the Winter Simulation
Conference 2015 (pp. 1421-1432). IEEE.
Komashie, A., & Mousavi, A. (2005). Modeling emergency
departments using discrete event simulation techniques.
In Proceedings of the Winter Simulation Conference,
2005. (pp. 5-pp). IEEE.
Massey, F. J. (1951). The Kolmogorov-Smirnov Test for
Goodness of Fit. Journal of the American Statistical
Association, 46(253), 68–78.
Narasayya, V., & Chaudhuri, S. (2021). Cloud Data
Services: Workloads, Architectures and Multi-
Tenancy. Foundations and Trends in Databases 10(1),
pp 1-107.
Qian, L., Luo, Z., Du, Y., & Guo, L. (2009). Cloud
Computing: An Overview. Cloud Computing, First
International Conference, CloudCom. 626-631.
Robertson, N. H., & Perera, T. (2001). Feasibility for
automatic data collection. In Proceeding of the 2001
Winter Simulation Conference (Cat. No. 01CH37304)
(Vol. 2, pp. 984-990). IEEE.
Robertson, N., & Perera, T. (2002). Automated data
collection for simulation?. Simulation Practice and
Theory, 9(6-8), 349-364.
Rodriguez, C. (2015). Evaluation of the DESI interface for
discrete event simulation input data management
automation. International Journal of Modelling and
Simulation, 35(1), 14-19.
Skoogh, A., & Johansson, B. (2008). A methodology for
input data management in discrete event simulation
projects. In 2008 Winter Simulation Conference (pp.
1727-1735). IEEE.
Skoogh, A., Michaloski, J., & Bengtsson, N. (2011).
Towards continuously updated simulation models:
combining automated raw data collection and
automated data processing. In Proceedings of the 2010
Winter Simulation Conference (pp. 1678-1689). IEEE.
Skoogh, A., Johansson, B., & Stahre, J. (2012). Automated
input data management: evaluation of a concept for
reduced time consumption in discrete event simulation.
Simulation, 88(11), 1279-1293.
ICEIS 2023 - 25th International Conference on Enterprise Information Systems
42
