
An Experimental Evaluation of Relations Between Architectural and
Runtime Metrics in Microservices Systems
Niels Knoll
a
and Robin Lichtenth
¨
aler
b
Distributed Systems Group, University of Bamberg, Germany
Keywords:
Microservice Architecture, Architecture Metrics, Model Driven Generation.
Abstract:
The decisions made about the architecture of a microservices system at design time influence the runtime
behavior of the resulting system and can be hard to change later. But predicting or evaluating how excatly
architecture decisions impact runtime behavior is difficult and in practice mostly based on previous experi-
ence. Architectural metrics that are measurable at design time and have a traceable impact on runtime metrics
could support architectural decision making to improve quality and prevent costly redevelopments. To investi-
gate traceable relations between architectural metrics and runtime metrics, this paper presents a model-driven
generation system for microservice architectures. The system can be used to benchmark different architecture
alternatives of a Java-based application without manually changing application code. Using this system, we
performed experiments to examine relations between architectural metrics and throughput as a runtime metric.
1 INTRODUCTION
The microservices architectural style has become
popular, as it aims to address issues of monolithic ap-
plications becoming complex and difficult to evolve
over time (Richardson, 2018, ch.1). When using
the microservices architectural style, an application is
split into smaller, manageable, and autonomous ser-
vices that cooperate by passing messages over well
defined APIs (Richardson, 2018, ch.3). With in-
dividual services becoming more manageable, how-
ever, structuring and connecting multiple services
is an often mentioned challenge for microservices-
based architectures (Francesco et al., 2019; Bushong
et al., 2021). Therefore, the topic of architect-
ing microservices-based applications has gained in-
terest, also in academic literature, where paradigms,
patterns, and best practices have been investigated
(Francesco et al., 2019; Bushong et al., 2021).
A common approach for the analysis of microser-
vices architectures is to focus on quality aspects as
defined in the ISO 25010 standard (ISO/IEC, 2014;
Haoues et al., 2017) which has also been reviewed
by Li et al. (Li et al., 2021). To also quantitatively
evaluate specific quality aspects, metrics are typically
needed. Most prevalent are metrics measured at run-
a
https://orcid.org/0000-0002-3967-0242
b
https://orcid.org/0000-0002-9608-619X
time, such as the average response time a request
takes, the computing resources a system consumes or
the overall throughput of requests it can achieve.
But runtime metrics are not available for architec-
tural evaluations at design time. An alternative are ar-
chitectural metrics (Zimmermann, 2015), measurable
at design time based on an architectural description
of a system. With a known relation between certain
architectural metrics and runtime metrics, developers
could use this information when deciding about the
architecture of a system they are creating to prevent
costly and time consuming changes afterwards. With
a relation, we mean a correlation between an archi-
tectural metric and a runtime metric, such that when
an architectural metric is varying for different archi-
tectural alternatives, the impact on a related runtime
metric can be predicted for these alternatives, because
the runtime metric is varying in a correlated way.
Our overall aim, thus, is to find generalizable rela-
tions between architecture and runtime metrics of mi-
croservices applications. Architectures of actual ap-
plications are difficult to change quickly and inves-
tigating ranges of values for different metrics would
be effortful. We therefore propose an experimental
approach based on a model-driven generation sys-
tem that allows for various architecture variations and
their benchmarking. This is summarized in the fol-
lowing research question:
RQ: Which architectural metrics for microser-
Knoll, N. and Lichtenthäler, R.
An Experimental Evaluation of Relations Between Architectural and Runtime Metrics in Microservices Systems.
DOI: 10.5220/0011728600003488
In Proceedings of the 13th International Conference on Cloud Computing and Services Science (CLOSER 2023), pages 147-154
ISBN: 978-989-758-650-7; ISSN: 2184-5042
Copyright
c
2023 by SCITEPRESS – Science and Technology Publications, Lda. Under CC license (CC BY-NC-ND 4.0)
147

vices applications have a demonstrable relation to
runtime behavior and are useful for architectural eval-
uations?
We present our methodology for answering it in
section 2, review metrics to consider in section 3,
and describe our system for creating applications with
varying architectural metrics in section 4. With it,
we experimentally investigate relations between run-
time and architectural metrics in section 5, discuss our
findings in section 6, and conclude our work in 7.
2 METHODOLOGY
2.1 Selection of Metrics to Consider
First, a literature search was conducted to find exist-
ing metrics that are promising candidates for architec-
tural evaluations. For the search string we combined
the keywords microservice, architecture, and metric
/ measure. From the results we selected four pri-
mary sources for architectural metrics: (Apel et al.,
2019), (Engel et al., 2018), (Rud et al., 2006) and
(Bogner et al., 2017). Those are also the main sources
considered by a more recent work (Panichella et al.,
2021) with a related research topic. Research on
architectural metrics for microservices has not con-
solidated yet, resulting in various metrics presented
which, however, often describe a similar underlying
principle. We therefore grouped the identified metrics
based on principles they describe in section 3.2
A challenge is the strict separation between ar-
chitectural and runtime metrics, often not done thor-
oughly in literature. We consider metrics that can
only be determined by observing a running system as
runtime metrics, all others are architectural ones.
2.2 Experimentation System
To experimentally find relations between architectural
and runtime metrics, a suitable microservices appli-
cation is needed. Requirements for such an applica-
tion are that (1) its architecture can be adapted quickly
and easily with the possibility to capture architectural
metrics automatically, (2) it enables the investigation
of the metrics selected in the step before, and (3) the
overall workload it processes stays the same so that
results between multiple runs are comparable and dif-
ferences can be attributed solely to architectural dif-
ferences. This enables experiments during which an
architecture can be adapted iteratively while measur-
ing the effects on runtime behavior.
In line with the proposition of Francesco et al.
(Francesco et al., 2019) to use generated applications
for experimentation on microservices architectures,
we chose a model-driven approach where the desired
application is generated from a describing model file.
An application consisting of n services with differ-
ent communication interfaces is described and all re-
quired artifacts are then generated out of this model.
The architecture can then be changed rapidly without
rewriting application code. The idea is similar to re-
search by D
¨
ullmann and van Hoorn who developed a
model-driven system for benchmarking in resilience
engineering (D
¨
ullmann and Van Hoorn, 2017). The
generated application transports mock data over the
network and CPU-intensive aspects are simulated
by executing a repeating prime-factorization. This
should not reduce the reliability of the found results
when examining the high-level architecture and re-
sulting performance. Instead, it keeps the workload
constant across changing architectures, so that obser-
vations can be attributed to the architectural metrics
rather than other potentially introduced changes.
How we used the system for the experiments is de-
scribed in 4 and the source code is available online
1
.
3 METRICS
3.1 Runtime Metrics
By using runtime metrics for measuring quality as-
pects of applications, objectivity can be achieved.
This is because they can abstract from software in-
ternals and measure the actually observable behavior.
Based on the requirements for an application, also ex-
pected levels for such runtime metrics can be defined
and continuously checked. Quality aspects can cover
several dimensions and because of their importance,
they have been documented in the ISO 25010 stan-
dard (ISO/IEC, 2014; Haoues et al., 2017). While
this standard belongs to a whole family of standards
called ”Software product Quality Requirements and
Evaluation (SQuaRE)” (Ravanello et al., 2014, p.2)
that deal with multiple aspects like quality manage-
ment, requirements, evaluation and more (Ravanello
et al., 2014, p.2), in this paper only the product quality
is examined which is related to the architectural and
technical aspects of an application.
The quality aspects from the standard can be used
to structure runtime metrics according to which qual-
ity aspects they allow to measure. The survey pa-
per ”A Taxonomy of Quality Metrics for Cloud Ser-
vices” by Guerron et al. (Guerron et al., 2020) pro-
vides a good overview of the research of software
1
https://github.com/sintexx/microFactory
CLOSER 2023 - 13th International Conference on Cloud Computing and Services Science
148

quality metrics in the context of cloud native applica-
tions. The microservices paradigm has a tight relation
with the design of so-called ”cloud-native applica-
tions” so these categories and metrics are a good start-
ing point. The seven categories identified by them
are: Reliability, Usability, Compatibility, Portability,
Security, Performance efficiency and Functional Suit-
ability (Guerron et al., 2020) and correspond to the
ISO 25010 aspects while leaving out Maintainability.
From this collection of runtime metrics our work
solely focuses on the Performance efficiency aspect,
because metrics like Resource utilization and Capac-
ity are related to the architecture decisions of the ob-
served application and can be measured in experi-
ments with a short running time.
3.2 Architectural Metrics
From existing literature, we selected and consolidated
the following metrics for further investigation. As
part of this consolidation we define the concept of
a handling that has been used, but not explicitly de-
fined in literature yet. We define a handling as the
combination of all actions and communications that
are needed to complete a task triggered by an external
request. This is used for the following descriptions.
Number of Produced Endpoints. A count of the
number of endpoints that each service provides from
Apel et al. (Apel et al., 2019, p.6). Endpoints can
be the URLs of a REST API or consumers of a
stream. Engel et al. describe the same concept as
(A)synchronous interfaces (Engel et al., 2018, p.89
f.). The type of interaction is ignored for this metric.
Number of Consumed Endpoints. A count of the
number of endpoints a service consumes from other
services to fulfill its functionality (Apel et al., 2019,
p.6), called (A)synchronous dependencies by Engel et
al. (Engel et al., 2018, p.90). Apel et al. additionally
define Number of Synchronous Service Dependencies
and Number of Asynchronous Service Dependencies
as dedicated metrics to differentiate between the type
of dependency (Apel et al., 2019, p.6). Absolute De-
pendence of the Service by Rud et al. also counts the
number of dependencies but on the service level and
not a per-interface basis (Rud et al., 2006, p.8). All of
these metrics are defined slightly differently, but con-
vey the same idea: How many dependencies does the
service require to fulfill its functionality?
Max Length of Affected Service Chain per Han-
dling. In a microservices-based application, most
operations or handlings require the cooperation of
multiple services to reach the shared goal. This re-
sults in a dependency chain, where the initial service
that gets called has to retrieve information from the
following one and so on. The Max Length of Af-
fected Service Chain per Handling metric by Apel et
al. identifies the longest of these chains and counts the
number of participating services (Apel et al., 2019,
p.6). Engel et al. have a similar metric called Longest
synchronous call trace with the same calculation prin-
ciple while ignoring hops that are across an asyn-
chronous interface (Engel et al., 2018, p.90 f.). Es-
pecially long synchronous chains can lead to slow
response times because of the added call overheads.
Asynchronous interfaces within the chain have a less
severe effect because the services on both sides of the
interface get decoupled.
Max Affected Services per Handling. Counts the
outgoing degree of dependencies from the service for
each handling and takes the maximum number (Apel
et al., 2019, p.6). While the previous metric described
the maximum depth, this one talks about the maximal
width considering only the direct dependencies.
Absolute Importance of the Service. This metric
described by Rud (Rud et al., 2006, p.8) is the in-
verse to (A)synchronous dependencies. It counts the
services that are dependent on the observed service.
Rud et al. further limit this to dependencies that are
crossing node borders, arguing that communication
that does not leave the node does not produce network
traffic (Rud et al., 2006, p.8). But for this work, the
metric is calculated independent of the deployment
because the distribution of services across nodes is not
known in advance and can also change when using a
container orchestration system. Individual services in
a microservices-based application should stay small,
so if this metric gets too large in relation to other ser-
vices it could indicate that the measured service con-
tains too much functionality and should be split up.
A second metric is thus called Relative Importance of
the Service and puts the absolute importance of the
service in relation to the other services in the applica-
tion.
Absolute Criticality of the Service. Defined as the
product of absolute importance and absolute depen-
dence of a service by Rud et al. (Rud et al., 2006, p.9).
Rud et al. reason that a service is critical if it has many
dependencies and is also required by many other ser-
vices. It should receive special attention and could
become a bottleneck in the application, for through-
put and failures alike.
An Experimental Evaluation of Relations Between Architectural and Runtime Metrics in Microservices Systems
149
4 EXPERIMENTATION
APPROACH
4.1 Model-Driven Application
Generation
4.1.1 Generation Approach
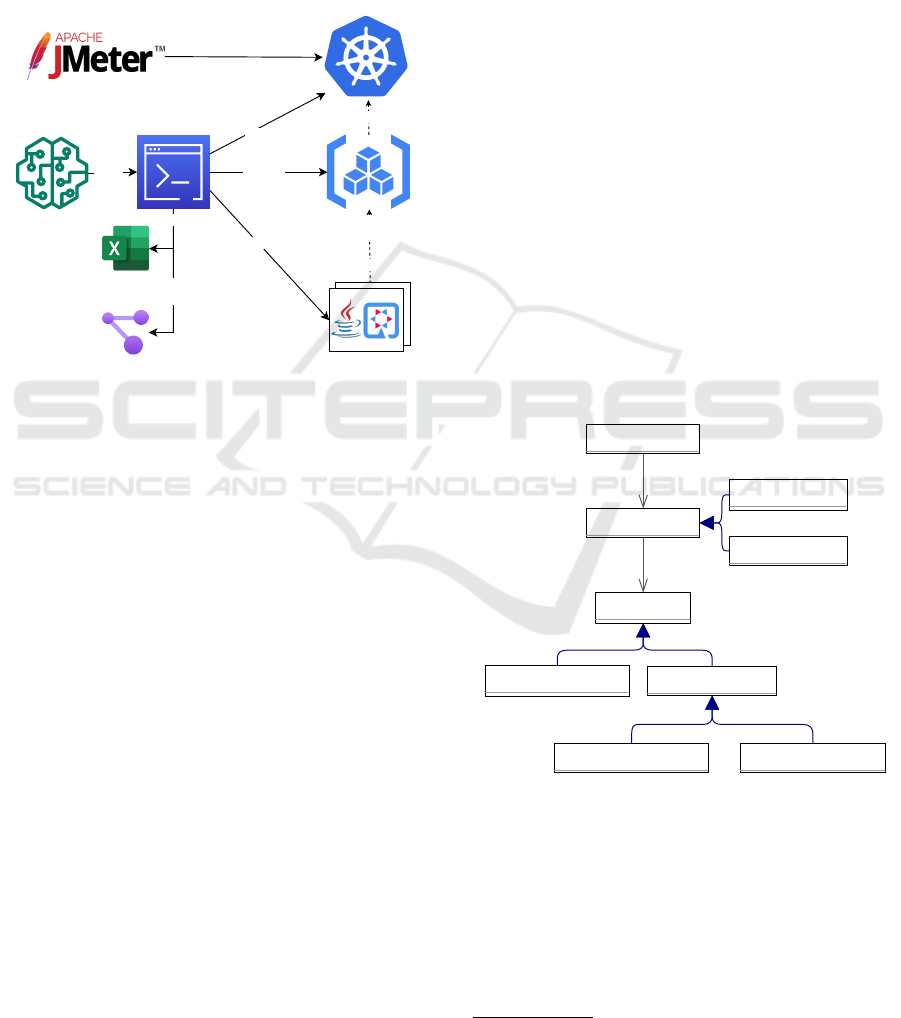
Generate
Generate
MicroFactory
(CLI program)
Build
Import
Model
(JSON file)
Architectural-Metrics
(Excel file)
Visualization
(Architecture graph as SVG file)
Container Images
(in local Registry)
Kubernetes Cluster
Run
Additionally written test requests
Test Requests
Application Code
(Quarkus projects)
Generate
Deploy
Figure 1: Experimentation approach overview.
In this section, we present our approach for generating
microservices-based applications based on a model
that can express many aspects relevant to microser-
vices. An application is described by such a model
and together with a set of rules, the actual code is cre-
ated automatically.
The high-level architecture of the approach can be
seen in Figure 1. At the core is a program with a CLI
(Command-Line Interface) called MicroFactory. This
program takes as a parameter the model file of the ap-
plication that should be created and parses it. Based
on that information all relevant architectural metrics
are calculated and written to an Excel file, for later
evaluation. Additionally, multiple SVG-Files are cre-
ated that visualize the different components of the ap-
plication and how they are interacting. But as its main
job, the system generates the source code of the dif-
ferent services of the application in the form of Java
projects based on Quarkus as an application frame-
work. After the code is generated it also gets pack-
aged into container images ready for a deployment.
To enable database interactions, an additional con-
tainer image for a PostgreSQL database is prepared
and linked to the services, as well as a RabbitMQ bro-
ker for AMQP-based asynchronous interactions.
The deployment for an experiment is then also au-
tomatically done by MicroFactory. From there, tools
like JMeter
2
can be used to simulate user requests to
the application and measure its behavior.
4.1.2 Model
The model’s scope for representing microservices-
based applications was developed over multiple iter-
ations. It has to be complex enough to represent a
realistic application, that can still be generated with
a reasonable amount of rules and required dependen-
cies by the MicroFactory software. The current ver-
sion is simple enough so that a model can be written in
a single text file without being overwhelming and so-
phisticated enough so that most architectural metrics
that are described in Section 3.2 can be expressed. As
the syntax for describing models we chose JSON.
A model can describe an application that consists
of Services and each service can have multiple Inter-
faces that each contain multiple steps of Logic which
describe what happens when the interface is called.
A logic step can be an interaction with a Database
or a Call to another service. Synchronous calls are
made using HTTP and asynchronous calls are made
using AMQP. Each interface itself can thus be either
AMQP or HTTP and further also defines its input and
output type.
AmqpInterface
AmqpServiceCall
DatabaseAccess
HttpInterface
Interface
Logic
ServiceCall
*
Service
1
*
logic
1
interfaces
HttpServiceCall
Figure 2: UML Model of the configuration.
When the MicroFactory program reads a model
file, its content is mapped to Java classes in memory,
which are then used for all further steps. Because the
structure of these classes follows the semantics of the
presented model, a UML diagram of these classes is
shown in Figure 2 to clarify the kind of services and
dependencies that can be expressed using the model.
2
https://jmeter.apache.org/ Accessed: 02.08.2022
CLOSER 2023 - 13th International Conference on Cloud Computing and Services Science
150
4.2 Experimental Setup
For the experiments we performed, the created ser-
vices were deployed to a K3s
3
Kubernetes cluster cre-
ated on two small virtual Linux machines. K3s also
includes Traefik
4
that is configured to take care of the
ingress into the cluster from the public internet using
the static IP-Addresses of the cluster’s main machine.
For the deployments of the services, a CPU limit
of 33% per pod was set in the Kubernetes deployment.
This limit is enforced for two reasons. First, if the
services get scheduled randomly on the underlying
hardware, big differences can arise between multiple
runs. The scheduling of many calculation-intensive
services on the same node will lead to a performance
degeneration that is not based on changes in the archi-
tecture but the random distribution of pods over the
nodes. The CPU limit prevents a service from using
more than 33% of the available resources of its host
machine. Second, the limit also simulates the fact that
nodes (VMs or bare-metal machines) have an upper
limit of performance based on the fastest processor
that is currently available and microservices should
account for that by distributing their workload using
horizontal scaling. Furthermore, per service we de-
ployed only one instance without horizontal autoscal-
ing to limit the number of factors influencing the ex-
periments. The implications of this with respect to
our results are considered in the discussion.
To collect the CPU and Memory utilization per
Pod, a custom script is triggered together with the
JMeter requests that queries these information from
the Kubernetes-API and logs them into a CSV-File.
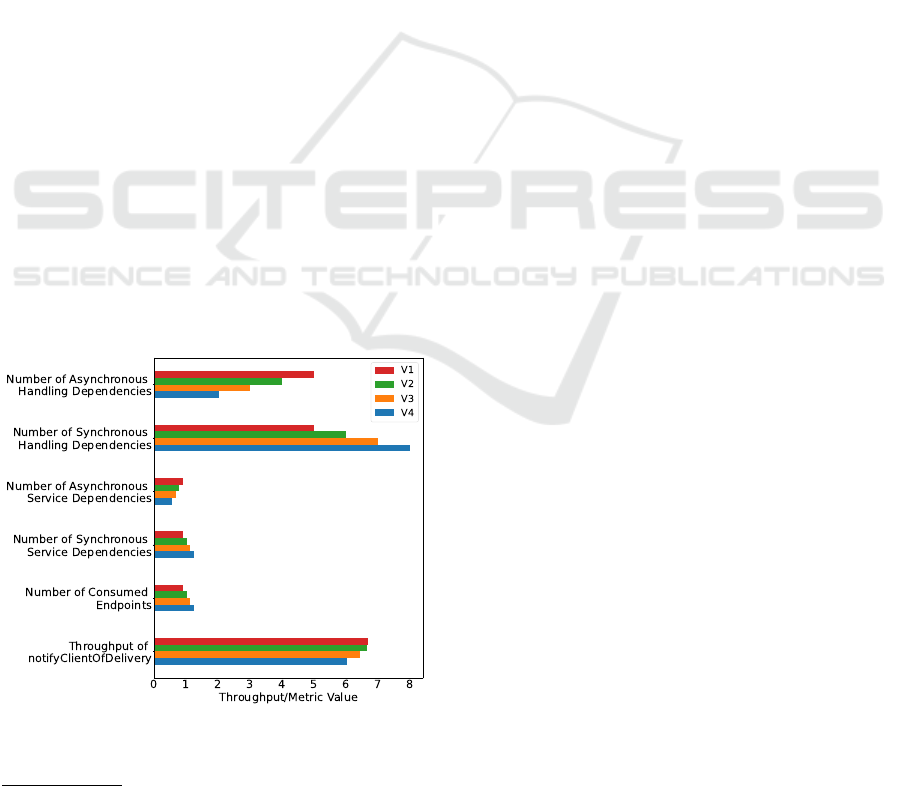
Figure 3: Varying the number of sync/async interfaces.
3
https://k3s.io/ Accessed: 25.07.2022
4
https://traefik.io/ Accessed: 25.07.2022
5 RESULTS
Based on the generation system and the setup de-
scribed in the previous section, multiple experiments
are performed. To get clean results with as few un-
desired influences as possible only a single endpoint
or handling of the microservices-based application
is evaluated at a time. For each experiment a sin-
gle aspect of the architecture is modified progres-
sively more and more over multiple versions. Please
note that the figures in this section, except figure 5,
combine the architectural metrics and the measured
throughput in one plot.
5.1 Type of Interfaces
For the first metric, we examine the effect of the
two different interface types synchronous and asyn-
chronous. The first version starts with as many asyn-
chronous interfaces over the AMQP broker as possi-
ble. These interfaces are then changed to synchronous
HTTP interfaces step by step. After the desired ver-
sion of the architecture is deployed, JMeter is trigger-
ing an Endpoint called placeOrder which belongs to
the handling in focus and whose output can be mea-
sured with the notifyClientOfDelivery-Query.
In Figure 3 the throughput per second of the han-
dling is shown together with the architectural metrics
for the four different versions of the architecture. In
the plot, the evolution of the architecture from version
one to version four can be seen. The Number of Syn-
chronous Handling Dependencies is increasing, while
the Number of Asynchronous Handling Dependencies
is decreasing between each version. The same behav-
ior can be observed in the averaged Number of Syn-
chronous Service Dependencies and Number of Asyn-
chronous Service Dependencies. The first two metrics
are handling specific, while the other two are simply
averaged over all services that participate in the han-
dling after they were calculated on a per-service ba-
sis. For that reason, the degree of change is varying
slightly, but they show the same trend because they
convey the same information about the application.
Figure 3 shows, that these four metrics are able to
condense the information about the architecture with
respect to the type of interface down to single scalar
values. Hence it is shown for a practical example
that the two metrics as they are described by Apel
et al.(Apel et al., 2019) and Engel et al.(Engel et al.,
2018) are working as expected.
The throughput of the handling is decreasing be-
tween the four different evolutions of the architecture
as expected. Using asynchronous interfaces allows
for buffering of intermediary results between the dif-
An Experimental Evaluation of Relations Between Architectural and Runtime Metrics in Microservices Systems
151
ferent services and has a decoupling effect, which is
increasing the overall throughput of the application.
Thus the change in the architecture has the expected
effect, that can be observed in the sample application
that was created. The experiment also shows a re-
lation of the runtime metric of throughput to all of
the four architectural metrics described in the previ-
ous paragraph.
5.2 Number of Services
One of the core decisions that have to be made
when creating a microservices-based application is
the number of services and how functionality is dis-
tributed. Development models and guidelines try to
support the decision process of how the domain model
should be distributed over services, for example the
techniques of Decompose by business capability and
Decompose by subdomain as described by Richard-
son (Richardson, 2018, ch.2). All of these techniques
and metrics can support the developer, but there is not
a single approach that guarantees finding the optimal
result for the current domain.
In this section three architectures are compared, to
examine the effect of a varying number of services on
the performance of the resulting application. The ar-
chitectures gradually reduce the number of services in
the application, by combining them together. The cre-
ated generation system automatically checks that the
overall workload with respect to database operations
and calculations stays constant between iterations to
keep the different versions comparable. The expec-
tation is, that the throughput of the application will
slightly increase when reducing the number of ser-
vices, because communication between services takes
time for network transfers and the marshaling and un-
marshaling of data (Richardson, 2018, ch.3). In a
real application, that overhead for communication is
known and accepted, because it is necessary for other
advantages of a microservices-based application.
The results in Figure 4, however, show, that the
throughput of the application gets smaller, the fewer
services there are. This is contrary to the initial idea
of reduced network overhead leading to a slightly in-
creased throughput. An explanation for this behavior
is the workload of the individual services. Each ser-
vice has to execute different database operations and
the simulated workload (prime factorization). Addi-
tionally, each pod is limited to 33% of the Host-CPU
to simulate limited hardware nodes and reduce the ef-
fect of different scheduling. The result is that individ-
ual services are busier and can become bottlenecks,
leading to the observed reduction in throughput. This
explanation is further supported by the fact that a dis-
tribution of functionality over separate services is also
considered a form of scaling, called Y-axis scaling or
functional decomposition (Richardson, 2018, ch.1).
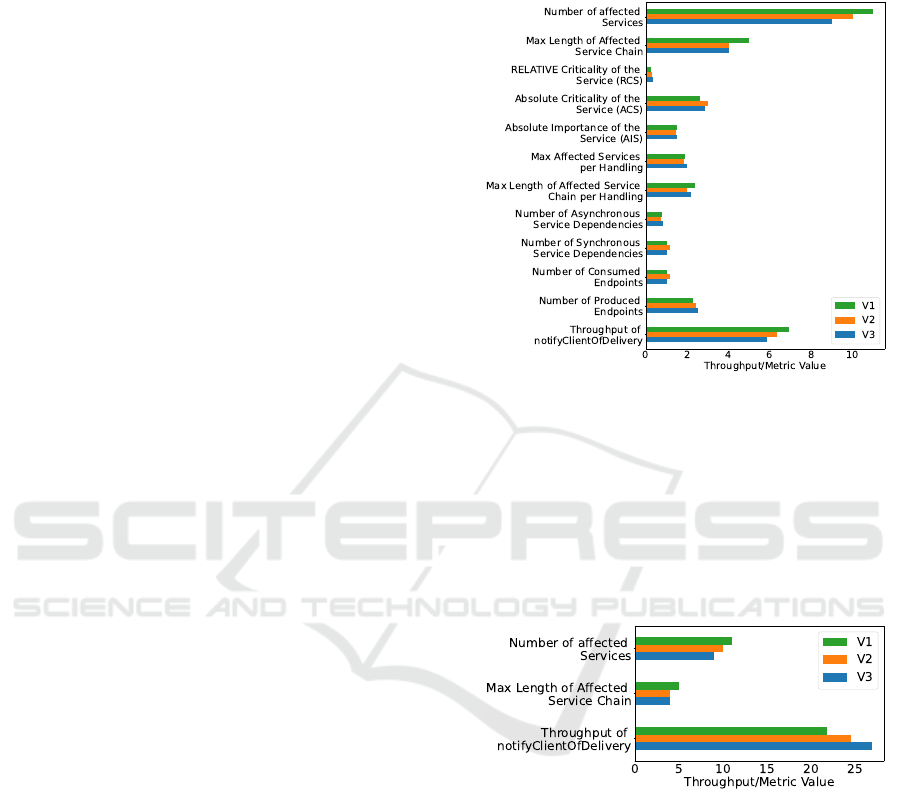
Figure 4: Varying the number of services (with workload).
To further investigate this behavior, we repeated
the experiment, but removed the simulated workload
completely. The results of this additional experiment
can be seen in Figure 5. Now there is an increase
in the throughput when the number of services de-
creases. This follows the expected behavior that fewer
services result in reduced network overhead and thus
an increase in the throughput.
Figure 5: Varying the number of services (no workload).
The results confirm that a reduction in services
will lead to a slightly higher throughput, but only
if the scale-out effect of services that are distributed
over multiple nodes is not influenced by the reduc-
tion. This effect is not only dependent on the architec-
ture but also the nature of the underlying hardware. In
an edge scenario where services are running on many
low-powered devices, the missing scale-out will af-
fect the performance much more than on a cluster
with few but high-powered machines. Additionally,
the decision on the number of services is also strongly
influenced by the underlying domain model that is
implemented. Because of these different aspects, no
definitive statement can be made about the relations
CLOSER 2023 - 13th International Conference on Cloud Computing and Services Science
152
between the number of services and the throughput of
the system that generalizes to different applications.
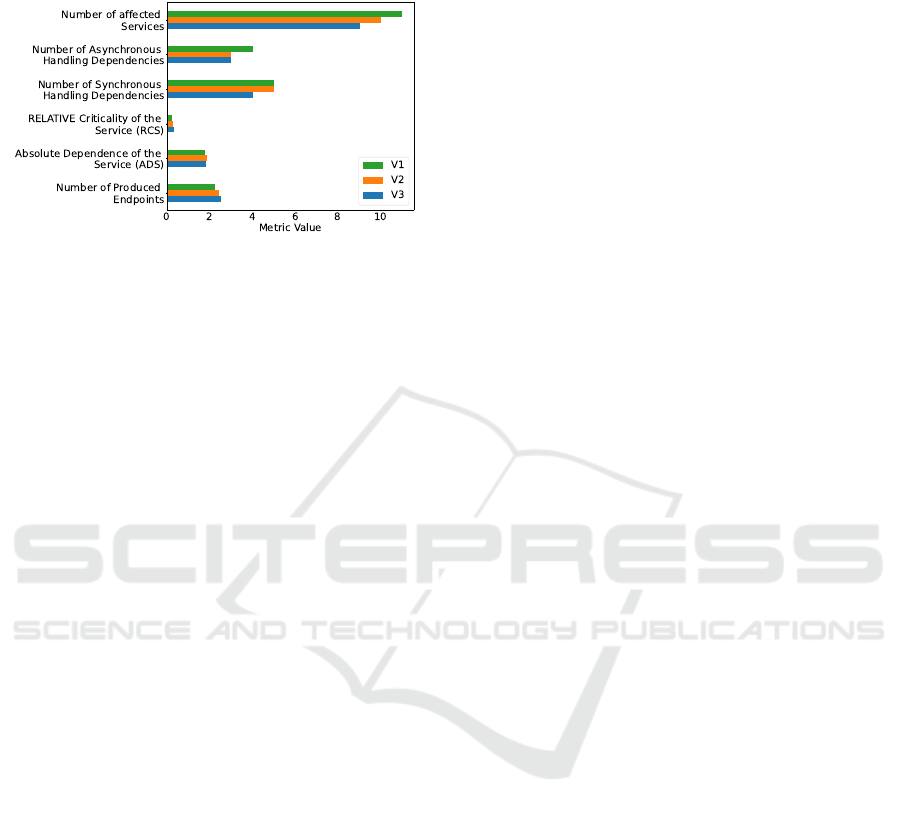
Figure 6: Effect of service count on other metrics.
Another interesting aspect is the behavior of other
architectural metrics when the number of services in
an application changes. When the number of services
in an application changes, while the functionality as
a whole stays the same, other metrics of the archi-
tecture will also be influenced. This can be seen in
Figure 6. As the number of services is decreasing,
so does the number of dependencies, synchronous
and asynchronous alike. Because functionality gets
concentrated in fewer services, the amount of cross-
communication gets reduced, which can be seen in the
metrics describing the number of handling dependen-
cies. At the same time, the Number of Produced End-
points is increasing. This metric is averaged across
all services of the handling. When the number of
services in the application is decreasing, the average
number of endpoints each provides increases as can
be seen in the plot 6. Some endpoints for inter-service
communication are disappearing when services get
merged, but overall the metric still increases because
the ones for external communication are still required.
Each of the remaining services contains more func-
tionality and thus provides more endpoints. If the
number of endpoints for a service gets too large, it
can indicate that the service is too big and should be
split-up or in this case not combined in the first place.
This also ties in with the two metrics about Criticality
of the Service and Relative Dependence of the Service.
Both of these are slightly increasing as more services
get combined. A service that with more functional-
ity also has a higher criticality, because more services
depend on it. And it also requires more dependen-
cies to be able to perform its additional tasks. If such
a service fails, a large portion of an application can
be affected. Additionally, the service can become too
complex and hard to maintain. Based on the example
application it was shown that the metrics displayed in
Figure 6 are able to communicate the effects different
numbers of services can have on the application.
6 DISCUSSION
In literature on software engineering, numerous archi-
tecture and runtime metrics can be found. They can
be valuable assets for managing modern applications.
But their capabilities and limitations have to be under-
stood well to be sure that they are reliably describing
the desired aspect of the observed application.
To investigate architectural metrics specifically for
microservices-based applications, we therefore con-
ducted experiments to measure impacts of changing
architectural metrics on runtime performance metrics,
specifically throughput. In the context of actual appli-
cations this can be hard to investigate, because such
applications never focus solely on a single architec-
tural paradigm, but are usually a series of compro-
mises to achieve the desired goal of the relevant do-
main. Additionally, if different versions of an ap-
plication are compared, they do not contain singular
changes but multiple different modifications that all
influence its observable behavior. Thus, we created a
synthetic generation system which allows for an easy
permutation of architectures based on which compo-
nents can then just be regenerated. It can therefore
be used to examine architectural metrics in a tightly
controlled context. How to transfer the gained re-
sults and actually evaluate microservices-based archi-
tectures based on metrics which were found useful,
however, is not part of the approach presented here.
With our experimental approach we can discuss
our initially posed research question regarding the
two types of experiments presented in the results sec-
tion. For different types of interfaces used in an ap-
plication, we can demonstrate that a higher Number
of Asynchronous Handling Dependencies leads to a
better performance in terms of throughput. The re-
sults of our second experiment in 5.2, however, were
less clear: On the one hand reducing the Number of
affected Services can lead to a decrease in through-
put if individual services then become a bottleneck,
but can also lead to an increase in throughput if the
reduction of communication overhead is more signif-
icant. Also, it has the be noted that a service becom-
ing a bottleneck could be avoided by horizontal scal-
ing which we did not consider in our experiments.
The second experiment also showed that care must
be taken when focusing on a single architectural met-
ric, because reducing the number of services impacts
the previously investigated metric Number of Asyn-
chronous Handling Dependencies. Therefore, we can
state that the investigated architectural metrics do al-
low for an evaluation of potential impacts on runtime
behavior, but it is advisable to consider multiple ar-
chitectural metrics in combination. In addition, the
An Experimental Evaluation of Relations Between Architectural and Runtime Metrics in Microservices Systems
153

deployment environment needs to be considered. This
was difficult in our setup, because it would require a
flexibly configurable deployment infrastructure, that
was not available in our case.
The complexity of microservices-based applica-
tions, also demonstrated by the need to consider the
actual deployment of an application, represents a gen-
eral challenge. By limiting the experiments to singu-
lar architectural changes, introducing CPU limits to
the Kubernetes pods, and focusing on a single han-
dling at a time, influences of other parts of the appli-
cation can be minimized, but not entirely excluded.
For further experiments, these effects would have to
be further reduced or controlled for. Extending an ex-
perimental system in this way is an interesting pos-
sibility for future work. Because the experiments in
this paper focused only on throughput, future work
could also examine additional runtime metrics. An-
other category in the literature survey section that is
also promising is Reliability. Especially the fault tol-
erance of a microservices-based application is highly
dependent on its architecture and should thus be worth
to explore. The presented generation system could be
extended for this by adding the possibility to config-
ure failover strategies for communication links or run-
ning services in a replicated way. Architectural met-
rics about failover and replication could then be put in
relation to the reliability of the application.
7 CONCLUSION
To satisfy runtime quality requirements of applica-
tions, it is often necessary to make trade-offs within
the design of an application. If the architecture of
the application does not fit the requirements during
its runtime costly redevelopments might be neces-
sary. With known relations between architectural
metrics of microservices-based applications and run-
time metrics, design time evaluations would be pos-
sible. Based on a model-driven generation system
we performed multiple experiments to investigate ex-
pected relations between the two types of metrics for
a microservices-based application. These results are
able to strengthen our understanding of relations be-
tween architectural and runtime metrics. Thus, they
can be used in a more informed way in scenarios
where architectural decisions have to be made.
REFERENCES
Apel, S., Hertrampf, F., and Sp
¨
athe, S. (2019). Towards a
metrics-based software quality rating for a microser-
vice architecture. In I4CS, pages 205–220. Springer.
Bogner, J., Wagner, S., and Zimmermann, A. (2017). Au-
tomatically measuring the maintainability of service-
and microservice-based systems: a literature review.
In Joint Conference of 27th IWSM and MENSURA,
pages 107–115.
Bushong, V., Abdelfattah, A., Maruf, A., Das, D., Lehman,
A., Jaroszewski, E., Coffey, M.,
ˇ
Cern
´
y, T., Frajt
´
ak, K.,
Tisnovsky, P., and Bures, M. (2021). On Microser-
vice Analysis and Architecture Evolution: A System-
atic Mapping Study. Applied Sciences, 11:7856.
D
¨
ullmann, T. F. and Van Hoorn, A. (2017). Model-driven
generation of microservice architectures for bench-
marking performance and resilience engineering ap-
proaches. In 8th ACM/SPEC ICPE companion, pages
171–172.
Engel, T., Langermeier, M., Bauer, B., and Hofmann, A.
(2018). Evaluation of microservice architectures: a
metric and tool-based approach. In International Con-
ference on Advanced Information Systems Engineer-
ing, pages 74–89. Springer.
Francesco, P. D., Lago, P., and Malavolta, I. (2019). Ar-
chitecting with microservices: A systematic mapping
study. Journal of Systems and Software, 150:77–97.
Guerron, X., Abrah
˜
ao, S., Insfran, E., Fern
´
andez-Diego,
M., and Gonz
´
alez-Ladr
´
on-De-Guevara, F. (2020). A
taxonomy of quality metrics for cloud services. IEEE
Access, 8:131461–131498.
Haoues, M., Sellami, A., Ben-Abdallah, H., and Cheikhi, L.
(2017). A guideline for software architecture selection
based on iso 25010 quality related characteristics. In-
ternational Journal of System Assurance Engineering
and Management, 8(2):886–909.
ISO/IEC (2014). ISO/IEC 25000 Systems and software
engineering – Systems and software Quality Require-
ments and Evaluation (SQuaRE). Online. 27 pages.
Li, S., Zhang, H., Jia, Z., Zhong, C., Zhang, C., Shan, Z.,
Shen, J., and Babar, M. A. (2021). Understanding and
addressing quality attributes of microservices archi-
tecture: A systematic literature review. Information
and Software Technology, 131:106449.
Panichella, S., Rahman, M. I., and Taibi, D. (2021). Struc-
tural coupling for microservices. 11th CLOSER.
Ravanello, A., Desharnais, J.-M., Villalpando, L. E. B.,
April, A., and Gherbi, A. (2014). Performance mea-
surement for cloud computing applications using iso
25010 standard characteristics. In Joint Conference of
IWSM and MENSURA, pages 41–49. IEEE.
Richardson, C. (2018). Microservices Patterns: With exam-
ples in Java. Manning.
Rud, D., Schmietendorf, A., and Dumke, R. R. (2006).
Product metrics for service-oriented infrastructures.
IWSM/MetriKon, pages 161–174.
Zimmermann, O. (2015). Metrics for architectural synthe-
sis and evaluation – requirements and compilation by
viewpoint. an industrial experience report. In 2015
IEEE/ACM 2nd International Workshop on Software
Architecture and Metrics. IEEE.
CLOSER 2023 - 13th International Conference on Cloud Computing and Services Science
154
