
Generating LADs that Make Sense
Madjid Sadallah
a
and Jean-Marie Gilliot
b
IMT Atlantique, Lab-STICC UMR CNRS 6285, F-29238 Brest, France
Keywords:
Learning Analytics Dashboard, Codesign, Generative Design, Dashboard Generation.
Abstract:
Learning Analytics Dashboards (LADs) deliver rich and actionable representations of learning data to support
meaningful and insightful decisions that ultimately leverage the learning process. Yet, because of their limited
adoption and the complex nature of learning data, their design is still a major area of inquiry. In this paper,
we propose to expand LAD codesign approaches. We first investigate how the user makes sense of the data
delivered by LADs and how to support this sensemaking process at design. Second, we propose a generative
tool, supporting sensemaking and decision making process, that extends end-users participation during the
prototyping phase and empowers LAD designers. We also present an evaluation of the tool, including usability
and user experience, demonstrating its effectiveness in supporting the design and prototyping of LADs.
1 INTRODUCTION
Learning analytics dashboards (LADs) are visualiza-
tion tools that report on student learning in educa-
tional contexts as a result of a learning analytics (LA)
process (Schwendimann et al., 2017). By incorporat-
ing visual and interactive features, they amplify hu-
man natural abilities to detect patterns, establish con-
nections and make inferences. Being the most visi-
ble face of LA, their successful design is critical to
the adoption of LA solutions by the educational com-
munity. Despite numerous reviews showing an in-
creasing interest in LADs (see, e.g., (Schwendimann
et al., 2017)), large-scale diffusion to their stakehold-
ers remains limited. This lack of adoption can be at-
tributed to issues related to (1) their poor design, re-
sulting in a failure to incorporate pedagogical under-
pinnings (Jivet et al., 2018), (2) a poor alignment with
users’ needs and expectations (Chatti et al., 2020),
and (3) failure to measure the appropriateness of em-
bedded visualizations to users’ visual literacy levels
(Schwendimann et al., 2017).
LADs can make an impact only if they suc-
cessfully influence a thought process or a decision
(Meyer et al., 2010). Yet, their design as instruments
of communication is challenging (Echeverria et al.,
2018) and calls for theories from several fields, rang-
ing from data visualization and human cognition to
human-computer interaction (Yoo et al., 2015; Al-
a
https://orcid.org/0000-0001-9118-0235
b
https://orcid.org/0000-0003-4569-3552
hadad, 2018). We argue that their design should fo-
cus on supporting sensemaking and decision-making,
and enhancing awareness and reflection as a means
to drive shifts in cognitive, behavioral and emotional
skills (Jivet et al., 2018). From a practical stand-
point, creating effective LADs is complex not only
in terms of design, but also of implementation. Cap-
turing LAD design and delivering it for end-users are
a highly demanding, time-consuming and challenging
task requiring expertise in data analysis and visualiza-
tion (Deng et al., 2022). Our objective is to propose
a complete design and delivery methodology capable
of creating meaningful LADs at affordable costs.
To fulfill our objective, we advocate for a code-
sign approach to ensure design responses that are
well-aligned with users’ requirements and expecta-
tions (Holstein et al., 2017). We also focus at the
design stage on creating LADs that are centered on
sensemaking to best support decision making. More-
over, literature reports that effective co-design of LA
systems with stakeholders requires generative design
tools and techniques to overcome potential barriers
(Holstein et al., 2019). Thus, to support the produc-
tion of co-designed LADs, we follow a generative ap-
proach for providing functional prototypes without re-
quiring a significant development effort.
In this paper, we aim to address two research ques-
tions: How can the decision-making process be re-
flected on a learning dashboard? (RQ1) and How to
support the designer in the prototyping phase to de-
sign LADs that make explicit the associated decision-
making processes? (RQ2). We propose a generative
Sadallah, M. and Gilliot, J.
Generating LADs that Make Sense.
DOI: 10.5220/0011839800003470
In Proceedings of the 15th International Conference on Computer Supported Education (CSEDU 2023) - Volume 1, pages 35-46
ISBN: 978-989-758-641-5; ISSN: 2184-5026
Copyright
c
2023 by SCITEPRESS – Science and Technology Publications, Lda. Under CC license (CC BY-NC-ND 4.0)
35

co-design approach and tool to address the research
questions. Our approach and tool integrate generative
design and participatory design to identify the desires,
needs, values, and constraints of LAD designers and
stakeholders, and to generate prototypes that support
the decision-making process. The remainder of this
paper begins with a review of relevant research (Sec-
tion 2). Section 3 presents a framework of interaction
for sensemaking in LADs, and details our proposed
generative co-design approach. Section 4 describes
LADStudio, a tool we built to illustrate the implemen-
tation of our proposals; it also reports on the studies
carried out to evaluate the usability and the user expe-
rience of the tool before concluding (Section 5).
2 BACKGROUND AND RELATED
WORK
2.1 Factors of Effective LAD Design
Because LAD design spans several fields, any design
process needs to account for several factors, some-
times of different nature (Yoo et al., 2015; Alhadad,
2018). To translate data into a form that effectively
leverages the human visual system, it is crucial to se-
lect visual representations that are consistent with the
available data and relevant to the task at hand. The use
of appropriate visualizations has the potential to am-
plify cognition and facilitate insights, decisions, and
actions that may otherwise be difficult or impossible
to achieve (Van Wijk, 2005). Conversely, failure to
associate effective visualizations with data can lead
to unnecessary exploration, inaccurate or false knowl-
edge, wasted time or lack of use due to frustration and
confusion (Yalc¸in et al., 2016).
The process of stimulating and enabling human
reasoning using interactive visualization tools is still
an under-explored field (Meyer et al., 2010). LAD
design choices are often based on assumptions about
how users will make sense of the information and
their capacity to reach a shared understanding of the
analytics presented (Clow, 2012). Beyond these as-
sumptions and expectations, the process of making
sense of a LAD and the factors that impact the user’s
sensemaking remains largely unknown (Jivet et al.,
2020). Research needs to focus on design principles
that are able to guide and justify design choices (Bod-
ily and Verbert, 2017; Echeverria et al., 2018).
2.2 LAD Codesign
The success of any innovation in LA depends largely
on the degree of stakeholder involvement during the
design phase (Holstein et al., 2017). Therefore, code-
sign (or participatory design), derived from user-
centered design, has recently become a subject of
a growing trend. In LA, it is defined as an ap-
proach where learners, educators, institutions, re-
searchers, developers and designers are all included
across different stages of the design process, from
exploration to actual implementation (Prieto-Alvarez
et al., 2018). Examples of successful use for co-
design of dashboards are reported in the literature
(Sarmiento and Wise, 2022). Yet, the LA community
still lacks tools specific to the needs of its stakeholders
to effectively communicate and understand the design
components (Alvarez et al., 2020). In addition, most
research on participatory approaches has focused on
the ideation phase. In this paper, we aim at extending
discussion through the prototype phase, by providing
tools for the designer that facilitate user requirements
translation, supporting sensemaking features and pro-
viding relevant guidelines.
2.3 Sensemaking and Decision Support
From a metacognitive perspective, LADs play a cru-
cial role in supporting the process of sensemaking, an
information integration process that that involves in-
terpreting and processing information, allowing indi-
viduals to construct meaning and derive insights that
inform future actions and decisions (Pirolli and Card,
2005). To describe and analyze sensemaking with
LADs, proposed models break the process down into
phases that go from perceiving the dashboard to tak-
ing and implementing pedagogical actions and deci-
sions. Nevertheless, these models remain evasive on
how these cognitive activities are related to and cor-
related with the user’s experience with the LAD.
To account for LAD-based sensemaking, the
data/framework (D/F) theory (Klein et al., 2006) de-
fines a model that most clearly delineates the under-
lying cognitive processes. It flows from the realm
of naturalistic decision-making (Beach et al., 2014),
which reflects the reality of most decision-making us-
ing LADs. According to the D/F model, two types of
entities interact during sensemaking: data and frame.
The data is the information that a person receives or
seeks, and the frame is the mental structure that orga-
nizes, interprets and explains the data. Also, the frame
extends beyond the data, using background knowl-
edge and expectations to fill in gaps, and eventually
creates gaps into which the data can fit. The D/F
model identifies the different types of framing activ-
ities: (1) elaborating the current frame by adding it
data and new relationships; (2) questioning data that
is incompatible with the current interpretation; (3)
CSEDU 2023 - 15th International Conference on Computer Supported Education
36

preserving the interpretation regardless of the incom-
patibility, by relativizing the significance or justify-
ing the ignoring the incompatibility; (4) comparing
multiple interpretations that can explain the same set
of data; (5) reframing by looking for a solution that
explains inconsistent data, possibly by reconsidering
and reinterpreting rejected data; and (7) seeking a new
interpretation of conflicting data, using for instance
key data elements as anchors.
Sensemaking is a prerequisite for many essential
human tasks, especially decision-making (Zhang and
Soergel, 2014). The naturalistic approach for explor-
ing human decisions focuses on the early process of
building ‘’situation awareness” (SA) using sensemak-
ing strategies through which a course of action is de-
veloped (Beach et al., 2014). Three levels of SA are
defined in (Endsley, 1995): perception of the elements
in the environment within a volume of time and space,
comprehension of their meaning, and projection of
their status in the near future. This process leads to
decision making and then to actions. The stages of
knowledge represented by the levels of SA are only
attainable through sensemaking (Klein et al., 2006).
2.4 Dashboards Generation
The systematic literature review presented in
(V
´
azquez-Ingelmo et al., 2019) identified three main
approaches regarding generating tailored dashboards,
namely customization, personalization, and adap-
tation. Customization solutions are driven by the
explicit user requirements and actively involve the
user by requiring him to perform explicit tailoring
actions (Mayer and Weinreich, 2017). Personalized
solutions infer an appropriate configuration from
implicit data on users, tasks or objectives and goals.
Some authors (e.g., (Kintz et al., 2017)) use the
business process and goals model, adding user
roles to the process for further tailoring. Adaptive
dashboards are able to adjust and adapt themselves
in real time according to environmental changes. For
instance, the solution described in (Belo et al., 2014)
restructures itself given user-profiles and behaviors
extracted from the dashboards’ analytical sessions.
A major drawback of all these solution approaches
is the fact that, although the end user is the primary
source and target of the generation process, the design
does not explicitly follow a user-centered approach.
Existing solutions are focused on data properties, us-
age context description, and user profiles. These di-
mensions are crucial for the design and generation
processes. Yet, human factors related to intended
dashboard use and decision-making are not explicitly
integrated to dashboard design and generation.
3 THEORETICAL FRAMEWORK
In this section, we introduce a framework that explic-
itly outlines the user-centered design dimensions, in-
cluding sensemaking. We also show how this frame-
work guides our codesign approach to create LADs
that are aligned with users needs and expectations.
3.1 LAD Design Space
A design space provides a comprehensive guide for
a class of applications emphasizing the freedom to
choose from different options and to explore alterna-
tives in the target domain (Schulz et al., 2011). Ac-
cording to (Shaw, 2012), it identifies and organizes
the decisions to be made, together with the alterna-
tives for those decisions. In dashboard design, several
authors have sought to characterize the design space.
Combining insights from previous works (e.g., (Yig-
itbasioglu and Velcu, 2012; Schulz et al., 2011)), we
propose to describe the LADs design space through
four dimensions: Goal, Usage Context, and Data, rep-
resentation & Interaction (Gilliot and Sadallah, 2023).
These dimensions were established based on existing
literature and are intended to be adequate and suf-
ficient for characterizing the LAD design space and
evaluating the effectiveness of LADs in supporting
awareness, sensemaking and decision making.
Goal. The goals can be classified based on the
competence they aimed to affect in learners: meta-
cognitive, cognitive, behavioral, emotional and self-
regulation (Jivet et al., 2017). In (Sedrakyan et al.,
2019), the authors analyzed students objectives in
terms of targeted intervention and suggested focus-
ing on the following aspects of the learning process:
(i) cognitive, (ii) outcome oriented (e.g., achievement
level), (iii) process-oriented, (iv) behavioral, (v) meta-
cognitive. The social presence being a key element
of any educational experience (Garrison et al., 2003),
we add to this list (vi) the social aspect, that relates to
group-work or learner relations.
Usage Context. This dimension describes the
learning context (classroom, online, or outside the
classroom), and the scope or target of the dashboard (a
learner, a group of learners, the entire class, or at the
school, department, academy, or intermediate level).
It also precises the focus of the analytics (the people,
their activity, their results, the context, the content, the
exchanges). More generally, a LAD can be designed
to be used or shared by several stakeholders with dif-
ferent perspectives, objectives and expectations.
Generating LADs that Make Sense
37
Data, Representations & Interaction. This di-
mension defines the data and their properties, asso-
ciates visual representations with the data, and adds
interaction features to them. While data and repre-
sentations provide insights for sensemaking, specify-
ing interactions helps to better sustain the underlying
process.
3.2 Interaction for Sensemaking
Interaction is the means by which humans explore vi-
sual representations to generate insight. It is an es-
sential glue that tightly binds analysis, visualization
and the human analyst (Endert et al., 2014). To ex-
plore how users engage in sensemaking supported by
LADs, we propose to investigate the interaction be-
yond its technical aspects, to examine it in terms of
the discourse that occurs between users and LADs.
This perspective is compliant with the view of interac-
tion within the distributed cognition theory (Hutchins,
1995). According to this theory, cognition is inher-
ently distributed, and results from the propagation of
representations of information between the user and
the environment. It is a property that emerges and
builds up over time as an individual interacts with his
environment: it develops through perception and in-
teraction (Liu et al., 2008). This perspective is use-
ful for observing and reflecting on the cognitive pro-
cesses involved by examining the exchange of repre-
sentations during their transmission between the user
and the environment.
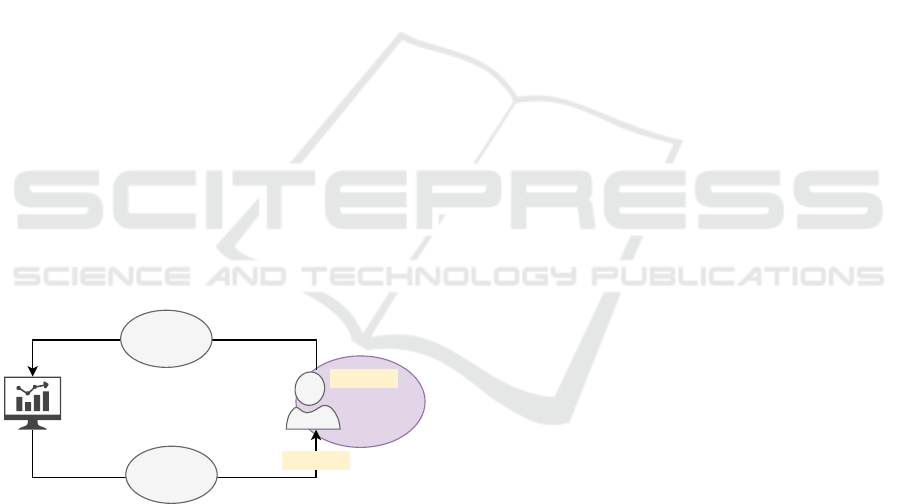
Sensemaking
Frame
Interaction
Presentation
LAD
User
Data
Figure 1: Loop of Interaction-Sensemaking with LADs.
Derived from this conceptualization of LADs
as cognitive tools, we propose the Interaction-
Sensemaking loop (depicted in Figure 1) to account
for representation propagation through interaction.
According to this model, the user makes sense of
the data rendered by a LAD through interaction ex-
ploration. His interactions may lead to an update
of the LAD configuration and thus of the associated
representations. The insight gained by the user can
push him to make some pedagogical decision, which
can impact his environment. Framing occurs in the
user’s mind as data derived from his interactions is
integrated with his internal knowledge to evolve his
current frame. This process is iterative: depending
on the resulting frame, the user may need to inter-
act again with the LAD. The interaction-sensemaking
process is cyclic, and provides both a means of inter-
preting data from the environment and a trigger and
catalyst for action to be taken accordingly. It thus
brings the involved parts of LAD-based sensemaking
and decision-making into a meaningful structure.
3.3 A Generative Codesign Approach
We propose a methodology for conceiving LADs that
draws on two complementary approaches: generative
design and participatory design. The approach is also
interactive insofar as, throughout the process, a given
design space is explored and a target design is eval-
uated on the basis of human judgment (Khan et al.,
2019). Generative design approaches allow designers
to use automated tools to generate valid design solu-
tions for a given problem, specified by defining a set
of goals and constraints (Keshavarzi et al., 2020).
3.3.1 Modeling Stakeholders
As part of a codesign approach, we advocate mak-
ing explicit the definition of representative roles of
the stakeholders involved in the development and use
of LADs. We can distinguish several stakeholders:
end-users, designers, developers, pedagogical team,
administrators, etc. The latter can be combined un-
der two key roles: user and designer. The user role
refers to all the stakeholders from which the require-
ment expression originates and those who will be po-
tential end-users. The designer role refers to the users
whose role is to design and implement the dashboard
specification. This role includes refining the user’s
specification, defining the indicators and associated
visualizations, conceiving the user interface, and im-
plementing the final LAD. The aim of the proposed
approach is therefore to allow the user and the de-
signer to fully describe the desired result, to generate
candidates and to refine them
3.3.2 Process of Generative Design
Generative design is a process in which the human is
given tools to describe his needs and intent, explore
the design space, generate a set of target solutions
and then select and refine the most appropriate one
based on his own judgment. Following this approach
consists in designing an LAD progressively, in sev-
eral steps, by involving the different actors involved
in the design process: user and designer. The user
is also involved in describing the usage and evaluat-
CSEDU 2023 - 15th International Conference on Computer Supported Education
38

ing the result, while the designer manages the whole
generation process, translating the usage description,
exploring different options, directing the generation
and evaluating the result with the end user (Figure 2).
User
Goal
L
A
D
S
p
e
c
i
c
a
t
i
o
n
U
s
a
g
e
d
e
s
c
r
i
p
t
i
o
n
LA
D
G
e
n
era
t
io
n
R
e
s
u
l
t
E
v
a
l
u
a
t
i
o
n
Designer
Figure 2: LAD Generative design approach.
Goal Definition. Defining the LAD goal is a core
aspect of the design process. This characterizes the
dashboard and its use, provides access to existing
implementations and allows for future capitalization
based on objectives. Therefore, this step is assumed
to provide a static input into the design loop rather
than being part of it.
Usage Description. This task is conducted by the
designer in collaboration with the end user. It lays the
foundation for the final LAD by making explicit the
users’ needs and expectations, and defining sharing
options with other users, time of use, and observation
time on which the decision is based.
LAD Specification. The requirement capture and
understanding of the usage context are crucial in
building a LAD that aligns with the user’s expec-
tations. This process is done through a progressive
and iterative approach, which involves setting up the
data sources, representations, and interactions that ul-
timately result in the desired dashboard composition.
• Data Identification. Based on the LAD specifi-
cation, the designer needs to identify the indica-
tors that are necessary to create effective dash-
board components. This involves having exper-
tise in data analytics and understanding the best
practices of defining metrics that meet the user’s
expressed needs.
• Definition of Visualization Components. Hav-
ing identified the relevant indicators, the designer
must then determine the appropriate visualiza-
tions and define the interaction options that en-
able the user to understand the data. This requires
a high level of visual literacy from the designer.
• Supporting End-User Sensemaking. The designer
must structure the LAD components in a way that
guides the user through the sensemaking process,
providing different levels of awareness. For each
level, he can define one or more relevant views.
These views must be structured in a way that en-
ables the user to interact within each view, and to
navigate to other views in search of new insights,
using the specified interaction options.
• Fine-Tuning for Better Fit with Design Principles.
To ensure the LAD design follows established de-
sign guidelines and principles, the designer must
bring his domain expertise and understanding of
the cognitive process involved in using the dash-
board. This step of the specification is crucial to
the success of the design.
LAD Generation. From the specification produced
in the previous step, the designer generates a testable
dashboard prototype using available tools. To make
this process more efficient, the designer can rely on
automatic generators that interpret the specifications,
which eliminates the need for technical work. This
approach offers a high level of stakeholder involve-
ment, allowing them to view and provide feedback
on the prototype, and enables the designer to easily
modify and refine the design. Additionally, automatic
generators facilitate the identification of errors and in-
consistencies in the design, which can be addressed
before moving to the other phases.
Result Evaluation. This stage is initiated after the
generation of a proof (i.e., a ready-to-use dashboard),
as testing with high-fidelity prototypes provides more
valuable feedback from the end-users. Through a se-
ries of user testing sessions, the designer validates the
dashboard design with the user and solicits feedback
for future iterations. This iterative process may lead
to revisions of the original design specification and
the incorporation of new features or improvements to
better align with users’ needs and preferences.
4 A TOOL FOR LAD
GENERATION
4.1 Rationale and Overview
As a proof of concept of the proposed approach,
we developed LADStudio for dashboard specification
Generating LADs that Make Sense
39
and assisted generation. It allows designers to build,
with end-users, and implement potentially complex
dashboards by providing only the highest level of in-
formation. The development of LADStudio takes part
within a global project, PaDLAD
1
, where the aim
is to propose models and tools for LAD codesign
for awareness, sensemaking and decision-support. A
card-based codesign toolkit is proposed to collect par-
ticipants’ needs in terms of cognitive support and re-
lated interfaces (Sadallah et al., 2022). Using the
toolkit, the designer collects user requirements and
uses LADStudio as a tool to discuss, evaluate and re-
fine the design with them. Specifications as entry of
LADStudio are thus obtained from an ideation pro-
cess, as described in (Prieto-Alvarez et al., 2018).
LADStudio is dedicated to the next step identified,
namely prototyping.
LADStudio is designed following a three-tier ar-
chitecture in which presentation, application process-
ing, and management are logically separated pro-
cesses. We implemented it using modern technolo-
gies, the dashboard rendering is tested using an in-
stance of the Grafana
2
, an open source analytics and
interactive visualization tool.
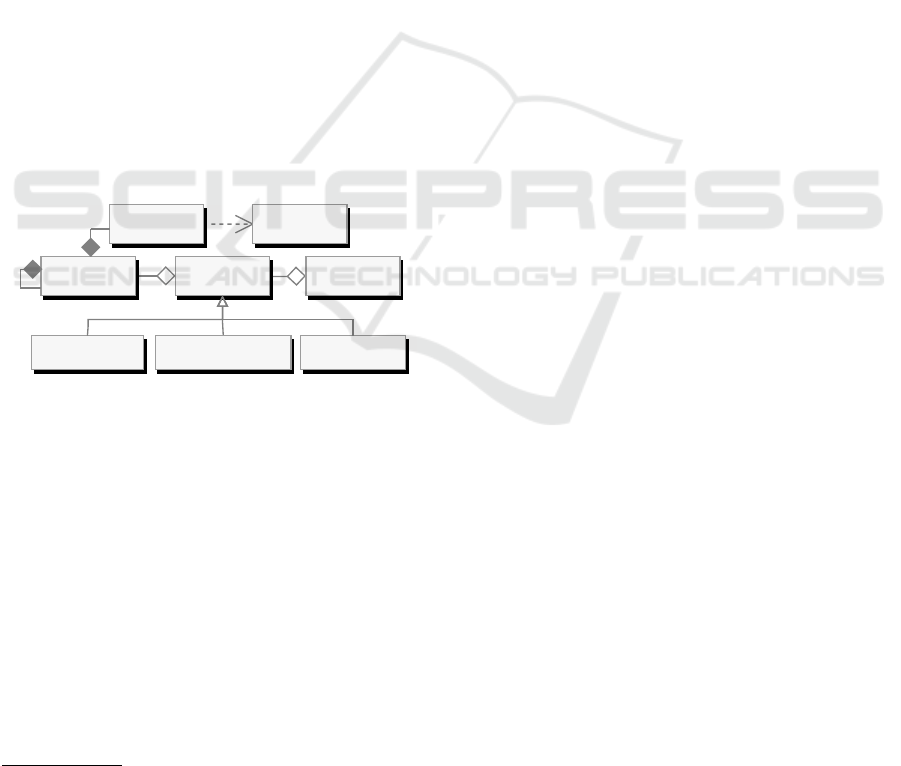
4.2 Component-Based Model
Indicator
Panel View Dashboard
Monitoring View Comprehension View Projection View
IndicatorVisualization
Figure 3: Dashboard component-based structure.
We follow a component-based approach for model-
ing the structure of LADs. The structure (and logical
view) of a dashboard is thus constructed using a hier-
archy of nested components. Such an approach eases
the design of LADs by providing common, shareable
and reusable components. New components can be
created from scratch, by editing existing ones or from
lower-level components. LADs components can be
of different types (Figure 3): (1) Indicators are data
components that describe a high-level measure of in-
terest; (2) Visualizations are rendering components
with visual manifestation; (3) Panels are the building
blocks of the dashboard. They are containers of visual
that define structuring relations between components.
1
Participatory Design of Learning Analytics Dash-
boards project (https://padlad.github.io/)
2
https://grafana.com/grafana/
We define two types of panels:(a) basic panels define
mapping functions between the indicators and the vi-
sualizations; (b) composite panel set out compositions
of basic panels; (4) Views are high-level components
intended to support levels of awareness. They pro-
vide the structural elements and define the interactiv-
ity needed to develop an understanding of the environ-
ment. We distinguish three types of views, according
to the targeted level of situation awareness: (a) Per-
ception views represent LAD configurations that al-
low the user to monitor his environment ; (b) Compre-
hension views represent LAD configurations aimed at
providing the user with the necessary insight to ana-
lyze and understand a given situation; and (c) Projec-
tion views allow preparing the user to take action on
the situations discovered and analyzed in the previous
levels.
4.3 Interaction Model
As described in the Interaction-Sensemaking loop
(Section 3.2), interaction plays a crucial role in users’
engagement with the LAD, allowing them to develop
their understanding through the framing functions
proposed by the D/F model. To identify the types of
interaction that would support sensemaking, we drew
upon the Visual Information-Seeking Mantra (Shnei-
derman, 2003), a taxonomy of the essential elements
of interacting with graphically presented information.
Based on this taxonomy, we identified six types of in-
teraction that are particularly relevant for LADs: (1)
Overview, which provides a global view of the avail-
able data; (2) Zoom, which allows users to select and
investigate a part of the data in more detail; (3) Filter-
Search, which helps users to find and focus on spe-
cific items of interest by reducing the amount of data
or visual objects displayed; (4) Details, which allows
users to obtain more precise information about the
data or a part of it to gain a better insight; (5) Relate-
Associate-Compare, which enables users to view rela-
tionships between data points; and (6) Change view,
which allows users to change their point of interest.
The combination of these interactions with the D/F
model framing functions provides a powerful frame-
work for supporting sensemaking in LADs.
The user’s interaction with a specific component
(panel or view) triggers background processes that
update the LAD. This can result in the display of
new data that the user can integrate with his internal
knowledge through framing, to construct, change or
consolidate his current mental framework. By com-
bining user interactions with the framing functions
of the D/F model, our approach provides a powerful
framework for supporting sensemaking in LADs.
CSEDU 2023 - 15th International Conference on Computer Supported Education
40

4.4 Library of LAD Components
In order to promote the reuse and sharing of compo-
nents, the library provides a way to define and store
components that can be used for the composition of
dashboards. The library contains five types of com-
ponents: (1) indicator templates; (2) visualizations;
(3) panels; (4) composite panels; and (5) views. A
user can extend this library by defining new compo-
nents from scratch or by using and reusing the exist-
ing ones. He can also modify existing components
and, for some reason (e.g., redundancy), delete some
others. Each component is associated with interac-
tions that support the sensemaking process.
4.5 LAD Specification Wizard
This component of the tool allows a step-by-step
specification of a dashboard (Figure 4). Five sequen-
tial screens compose a specification scenario:
1. Target Use and usage description. The first step
of the process is the gathering of the information
needed to characterize the dashboard, the type of
learning environment it is intended to serve, the
role of the user, and the sharing preferences;
2. Goal Setting. A predefined list of goals and their
descriptions is provided. The designer can also
introduce another goal if the list provided does not
cover the desired LAD purpose;
3. Monitoring and Perception Views. These are
screens that allow the user to monitor his environ-
ment, in relation to his goal. He can use existing
views stored within the library, or define new ones
by selecting or adding appropriate panels, defin-
ing data sources and setting interaction options;
4. Analysis and Comprehension Views. These views
allow the finer analysis of a specific aspect. Their
purpose is to allow the user to attain the compre-
hension and the projection levels of awareness re-
garding the aspect of interest. The user can define
new views or reuse existing ones; and
5. Dashboard Generation and Export. Once the
specification is completed, the user can generate
a working prototype.
A specification can be re-edited, defining a cycli-
cal process of editing and testing. In addition, the
components (indicators, visualizations, panels, and
views) produced during the dashboard specification
are automatically saved, which simplifies the feeding
of the LADStudio library for component reuse.
4.6 LAD Prototype Generation
By advocating a generative design approach, we ac-
knowledge the need to prevent too much technical ex-
posure to the user. Therefore, we designed LADStu-
dio so as it generates running prototypes from LADs
specifications without requiring technical skills. The
user has the possibility to adjust the generated dash-
board, to personalize it and to adapt it to his prefer-
ences and needs.
To render the LAD, the designer may generate a
functional prototype and build it into the embedded
Grafana instance or a remote installation (See exam-
ple of Figure 5). He can also download the JSon de-
scription file.
4.7 User Evaluation
For evaluating LADStudio, we organized a design
workshop to experiment with the proposed tool. The
objective was to evaluate the usability and user expe-
rience of the tool. We report on a qualitative study
to present the results of feedback on the use of the
LADStudio tool and to collect the impressions and
opinions of the participants.
4.7.1 Participants and Procedure
Considering the difficulty of finding experts in LAD
design and development, we turned to communities
with a background in educational tool design and de-
velopment: interface design researchers, university
teachers who have used educational dashboards, and
software developers. We thus used in this study a non-
probability and expert sampling, a subtype of purpo-
sive sampling. The inclusion criterion was experience
in the use and the design of educational tools, and the
exclusion criterion was unwillingness to participate in
the study. Of those who received email invitations
to take part in the study, thirteen (13) persons agreed
to participate. The socio-demographics and general
background of the participants were collected as part
of the study (see Table 1 for key demographics).
The evaluation procedure is organized as follows.
A presentation and demonstration session is held for
all participants, explaining the context and objectives
of the project, and describing the LADStudio tool.
The participants were then invited to experiment with
the tool independently, and then to attend a collec-
tive codesign workshop. Finally, they were asked
to individually complete a questionnaire and answer
open-ended questions aimed at gathering their opin-
ions. The study took about two hours to complete.
Generating LADs that Make Sense
41
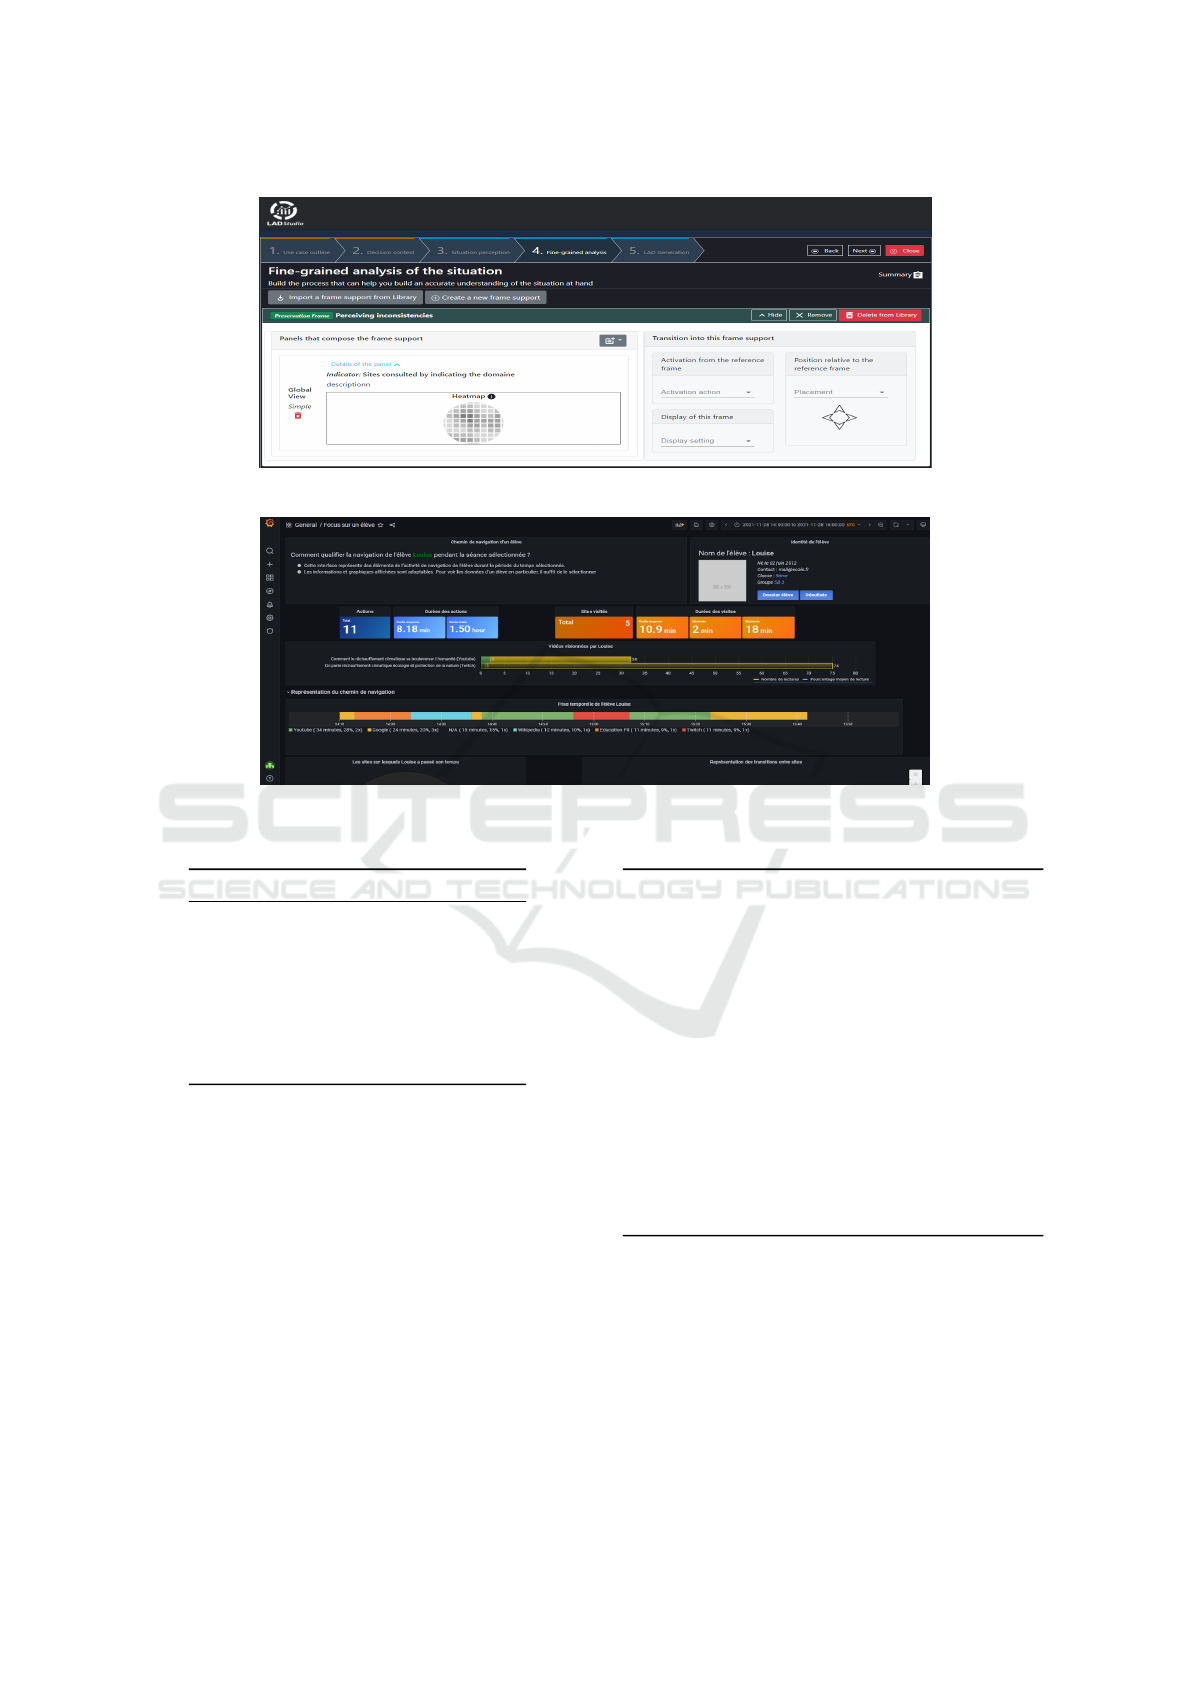
Figure 4: Dashboard specification.
Figure 5: A generated LAD prototype.
Table 1: Participants’ demographic data (N=13).
Variable Category n (%)
Gender Male 8 (61.54)
Female 5 (38.46)
Age 25–35 3 (23.08)
36–45 7 (58.84)
46–55 3 (23.08)
Staff University Teacher 4 (30.77)
Researcher 6 (46.15)
Software developer 3 (23.08)
4.7.2 Instruments
As the LADStudio tool design is still exploratory, we
followed a qualitative approach using standardized
questionnaires. The tool usability was assessed by
completing a System Usability Scale (SUS) question-
naire (Brooke, 1996), a well-researched and widely
used questionnaire for perceived usability evaluation.
According to (Tullis and Stetson, 2004), SUS pro-
vides a reliable usability measure even with a rela-
tively small sample size. Based upon the general tem-
plate of SUS, we designed a questionnaire containing
the ten statements presented in Table 2.
User Experience (UX) evaluation provides an
overview of the level of comfort to a person’s satisfac-
Table 2: SUS questionnaire items.
Q1 I think I would like to be able to use LADStu-
dio frequently
Q2 I found LADStudio unnecessarily complex
Q3 I thought LADStudio was easy to use
Q4 I think that I would need support to be able to
use LADStudio
Q5 I found the various components of LADStudio
were well integrated
Q6 I thought there was too much inconsistency in
LADStudio
Q7 I would imagine that most people would learn
to use LADStudio fairly quickly
Q8 I found LADStudio very cumbersome to use
Q9 I felt very confident using the LADStudio tool
Q10 I needed to learn a lot before I could use the
LADStudio tool
tion with a system, and determines areas of improve-
ment. We used the User Experience Questionnaire
(UEQ), a valid tool that serves as a means of com-
prehensively assessing the UX of interactive products
(Laugwitz et al., 2008), applicable to small groups
(Schrepp et al., 2014). The questionnaire groups a to-
tal of 26 items into six scale (Santoso et al., 2016): (1)
attractiveness describes the general impression that
CSEDU 2023 - 15th International Conference on Computer Supported Education
42

users had of the tool; (2) efficiency qualifies the pos-
sibility to use the tool quickly and efficiently; (3) per-
spicuity describes how easy it is to understand how to
use the tool and to get familiar with it (4) dependabil-
ity qualifies the user’s feeling of being in control of
his interaction and confident with the tool; (5) stim-
ulation describes whether using the tool is exciting
and motivating; and (6) novelty describes the extent
to which the tool’s design is innovative and creative,
and attracts the user’s attention.
4.7.3 Results
Usability. The results of the usability study are
summarized in Table 3. To analyze them, we followed
the procedure proposed by the author of the instru-
ment (Brooke, 1996) to compute the SUS score based
on the equation shown in Formula 1.
SUS =
1
n
n
∑
i=1
norm.
n
∑
j=1
q
i j
− 1, q
i j
mod 2 > 0
5 − q
i j
, otherwise
(1)
where n=number of subjects (questionnaires), m = 10
(number of questions), q
i j
=individual score per ques-
tion per participant, norm = 2.5
Table 3: Results of the SUS questionnaire (N=13).
Positive statements Negative statements
A N D A N D
Q1 9 2 2 Q2 0 1 12
Q3 10 2 1 Q4 7 3 3
Q5 11 1 1 Q6 0 0 13
Q7 2 4 7 Q8 1 0 12
Q9 10 3 0 Q10 3 6 4
A: Agree or Strongly agree; N: Neither agree
nor disagree; D: Disagree or Strongly disagree
A SUS score ranges from 0 to 100, where a score
of 0 implies that a user found a system absolutely
useless while a score of 100 reflects that a user did
find a system to be optimally useful. A score above
68 would be considered above average. The results
of the assessment of the participants obtained a total
value of the SUS score of 925 with the resulting aver-
age value of 71.15, a standard deviation of 6.15, and a
median of 72.5. In (Bangor et al., 2009), SUS scores
are mapped to a scale of adjectives in order to attach a
more descriptive meaning to the SUS score assigned
to a system. Using this grade ranking as shown in Fig-
ure 6, the SUS score on the tool of 71.15 means that
the level of user Acceptability Range is Acceptable,
the Grade Scale level is category C, and user Adjec-
tive Rating level is Good category. This indicates a
satisfactory and an acceptable level of usability of the
tool according to the participants.
User Experience. We computed the UEQ results
after scaling participants’ responses from −3 (neg-
ative extreme) to +3 (positive extreme) on a Likert
scale. Scores ranging from −0.8 to 0.8 reflect a neu-
tral evaluation of the corresponding dimension, while
scores above 0.8 indicate a positive evaluation and
those below 0.8 imply a negative evaluation.
Table 4: Results of the User Experience study (N=13).
Dimension Mean Variance Rating
Attractiveness 2.04 0.13 Excellent
Perspicuity 1.13 0.73 Below average
Efficiency 2.27 0.12 Excellent
Dependability 1.64 0.17 Good
Stimulation 2.25 0.18 Excellent
Novelty 2.48 0.17 Excellent
As shown on Table 4 and represented on Figure
7, the overall rating is sufficiently high. The high-
est mean score was for novelty, with a mean of 2.48
(SD = 0.17), followed by efficiency (mean = 2.27, SD
= 0.90) and stimulation (mean = 2.25, SD = 0.18).
These scores were at an excellent level. Dependability
has a good score (mean = 1.64, SD = 0.17). The less
positive result was on perspicuity dimension (mean
= 1.13, SD = 0.73), meaning that participants found
some difficulties in understanding the use of the tool.
Participants’ Feedback. The participants in the
study acknowledged the innovativeness of the pro-
posed approach and tool aimed at addressing two
main challenges faced in creating effective LADs:
lack of end-user involvement and the technical com-
plexity of constructing LADs from scratch. Their
evaluations of the user experience with the tool em-
phasized its usefulness and potential for producing
meaningful LADs. Despite some initial difficulty in
using the tool without understanding its background
and rationale, the participants felt that with prac-
tice, they could effectively use it to improve their
memory level. The participants also highlighted the
tool’s focus on supporting the sensemaking process
in dashboard design. However, incorporating theo-
retical concepts related to decision and sensemaking
into the tool presented challenges in its initial appro-
priation. The participants indicated a need for ex-
pert design support, and recognized that a lack of data
and visual literacy was a hindrance in fully adopting
LADs. This was reflected in their difficulty in asso-
ciating the visual representation with the data. Given
these insights, we believe that further improvements
are needed to better inform and guide the designer in
constructing the various components of the LAD.
Generating LADs that Make Sense
43
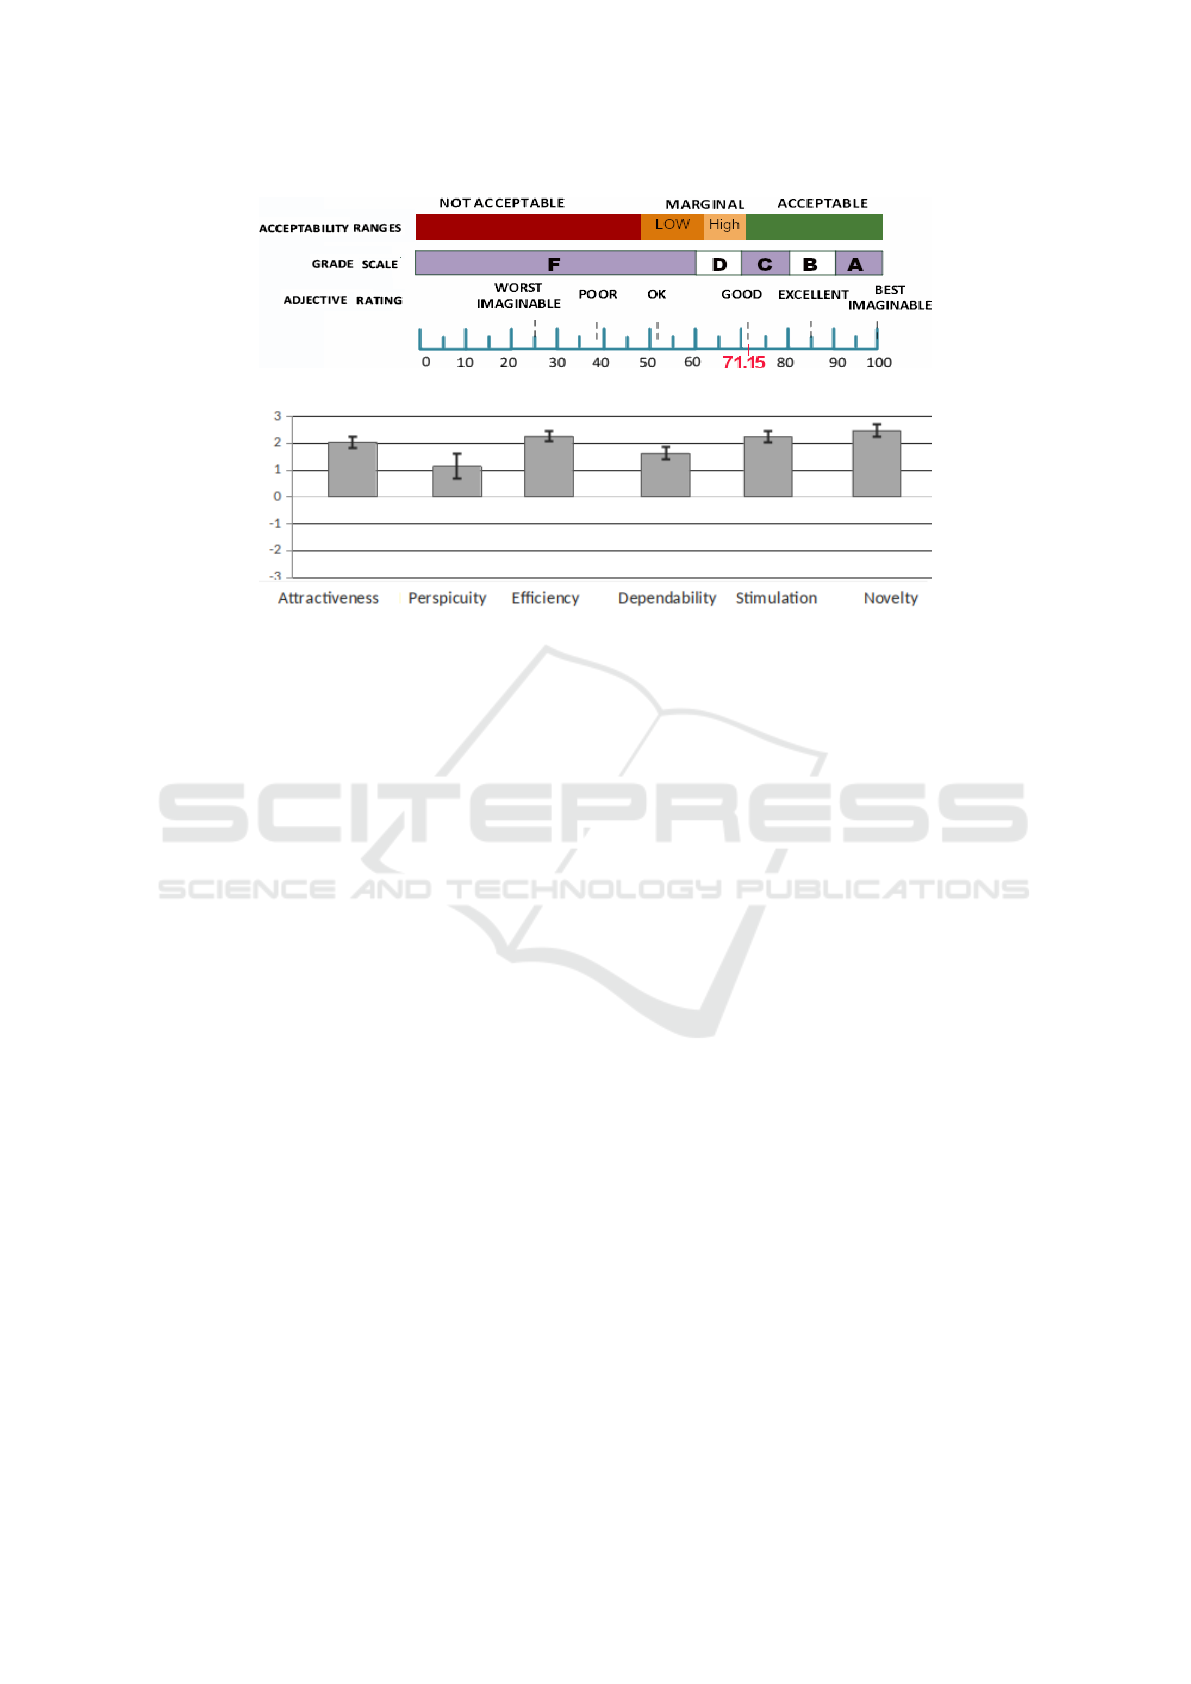
Figure 6: Grade rankings for SUS scores (Bangor et al., 2009). In red, the SUS score of LADStudio.
Figure 7: UEQ results of the LADStudio evaluation.
4.7.4 Discussion
The purpose of this study was to assess the usability
and user experience of LADStudio, two critical as-
pects of system quality. The results of the SUS study
indicated that LADStudio has good usability, with a
global mean score of 71.15 and a high level of accept-
ability. The UEQ results revealed that the user expe-
rience of LADStudio is satisfactory, as evidenced by
the sufficient average scores of each aspect studied.
The novelty, efficiency, and stimulation scores were
at an exceptional level, indicating that the participants
found LADStudio highly creative, efficient, and stim-
ulating. On the other hand, the perspicuity score was
only moderate, which can be attributed to the rela-
tively limited time participants spent on the tool com-
pared to the amount of information available to them.
We acknowledge that widespread adoption of such a
tool would require significant efforts in dissemination
and training for both designers and potential users.
The study has certain limitations, primarily due to
the limited sample size of only 13 participants. This
restricts the generalizability of the results and only
provides preliminary insights into the effectiveness of
the tool. However, it is noteworthy that previous re-
search has demonstrated the reliability of using SUS
as a measure of perceived usability, even with rela-
tively small sample sizes (Tullis and Stetson, 2004).
Also, UEQ is found applicable even with a limited
group of participants (Schrepp et al., 2014). How-
ever, we believe that, in order to consolidate our re-
sults and ensure their validity, a more extensive inves-
tigation is required. In particular, a larger sample size
is needed to mitigate the self-selection bias that is in-
herent in qualitative research methods, as those who
responded to our survey and invitations may have a
vested interest in LADs. Additionally, it is well estab-
lished that qualitative research can also be subject to
group think and the influence of dominant personali-
ties, further highlighting the need for a more compre-
hensive study. Moreover, the current study focused
solely on the quality of the tool used for LAD gener-
ation and did not assess the quality of the generated
LADs themselves. Therefore, it is essential to con-
duct a larger-scale study to fully understand the po-
tential and limitations of the LADs generated.
5 CONCLUSION
LADs are instruments of exploration, analysis and
decision-support that allow users to gain insight and
take well-informed actions. This paper sought to con-
tribute to addressing their limited adoption by their
stakeholders by focusing their design. We first pro-
posed to improve the LAD design space, specifically
by integrating elements related to the sensemaking
dimension. This allowed us to answer our first re-
search question RQ1 (How can the decision-making
process be reflected on a learning dashboard?). We
then defined a design methodology that enables stake-
holders to be involved in the design of such LADs,
and provides designers with means to rapidly obtain
functional prototypes that comply with the specifica-
tions and requirements of end-users. This provided
us with the possibility to answer the research question
RQ2 (How to support the designer in the prototyping
phase to design LADs that make explicit the associ-
CSEDU 2023 - 15th International Conference on Computer Supported Education
44

ated decision-making processes?). The proposed ap-
proach combines generative and participatory design,
leveraging the strengths and mitigating the limitations
of both methodologies. By doing so, we were able
to create a framework that supports a high level of
stakeholder involvement while balancing it with the
computational power and efficiency of the generative
design process. This framework allows for a more
comprehensive and adaptable solution that can be cus-
tomized to fit the needs of different stakeholders.
To demonstrate the feasibility of our approach, we
implemented LADStudio, a tool that enables design-
ers to generate functional prototypes based on spec-
ifications developed through the co-design process.
This tool is built within the proposed design space
and instrumented with features to support the end-
user sensemaking and decision-making process. The
evaluation results showed that innovative proposals
and LA adoption are possible with stakeholders, when
using supportive and assistive design strategies. Our
approach and tool have been streamlined to facilitate
generative development of functional prototypes, en-
abling further exchanges focused on design adoption
issues. We believe that this step is essential to ensure
that LAD design leads to actual use. In conclusion,
we believe that collecting LAD proposals from users
and practitioners using LADStudio can reveal addi-
tional needs and lead to the identification of new us-
ages. We are committed to capitalizing on and sharing
these findings with the learning community to further
advance the design and adoption of LADs.
REFERENCES
Alhadad, S. S. (2018). Visualizing data to support judge-
ment, inference, and decision making in learning an-
alytics: Insights from cognitive psychology and vi-
sualization science. Journal of Learning Analytics,
5(2):60–85.
Alvarez, C. P., Martinez-Maldonado, R., and Shum, S. B.
(2020). La-deck: A card-based learning analytics co-
design tool. In Proceedings of the tenth international
conference on learning analytics & knowledge, pages
63–72.
Bangor, A., Kortum, P., and Miller, J. (2009). Determining
what individual sus scores mean: Adding an adjective
rating scale. Journal of usability studies, 4(3):114–
123.
Beach, L. R., Chi, M., Klein, G., Smith, P., and Vicente,
K. (2014). Naturalistic decision making and related
research lines. In Naturalistic decision making, pages
49–56. Psychology Press.
Belo, O., Rodrigues, P., Barros, R., and Correia, H.
(2014). Restructuring dynamically analytical dash-
boards based on usage profiles. In International
Symposium on Methodologies for Intelligent Systems,
pages 445–455. Springer.
Bodily, R. and Verbert, K. (2017). Review of research on
student-facing learning analytics dashboards and ed-
ucational recommender systems. IEEE Transactions
on Learning Technologies, 10(4):405–418.
Brooke, J. (1996). A quick and dirty usability scale. In Jor-
dan, P., Thomas, B., Weerdmeester, B. A., and A. I.,
M., editors, Usability evaluation in industry, volume
189, pages 194–101. Taylor & Francis.
Chatti, M. A., Muslim, A., Guliani, M., and Guesmi, M.
(2020). The lava model: Learning analytics meets
visual analytics. In Adoption of Data Analytics in
Higher Education Learning and Teaching, pages 71–
93. Springer.
Clow, D. (2012). The learning analytics cycle: closing the
loop effectively. In Proceedings of the 2nd interna-
tional conference on learning analytics and knowl-
edge, pages 134–138.
Deng, D., Wu, A., Qu, H., and Wu, Y. (2022). Dashbot:
Insight-driven dashboard generation based on deep re-
inforcement learning. IEEE Transactions on Visual-
ization and Computer Graphics.
Echeverria, V., Martinez-Maldonado, R., Granda, R.,
Chiluiza, K., Conati, C., and Shum, S. B. (2018).
Driving data storytelling from learning design. In Pro-
ceedings of the 8th international conference on learn-
ing analytics and knowledge, pages 131–140.
Endert, A., Hossain, M. S., Ramakrishnan, N., North, C.,
Fiaux, P., and Andrews, C. (2014). The human is the
loop: new directions for visual analytics. Journal of
intelligent information systems, 43(3):411–435.
Endsley, M. (1995). Toward a theory of situation awareness
in dynamic systems: Situation awareness. Human fac-
tors, 37(1):32–64.
Garrison, D. R., Anderson, T., and Archer, W. (2003). A
theory of critical inquiry in online distance education.
Handbook of distance education, 1(4):113–127.
Gilliot, J.-M. and Sadallah, M. (2023). A framework
for codesigning effective lads supporting sensemaking
and decision making. Submitted for publication.
Holstein, K., McLaren, B. M., and Aleven, V. (2017). In-
telligent tutors as teachers’ aides: exploring teacher
needs for real-time analytics in blended classrooms.
In Proceedings of the 7th international learning ana-
lytics & knowledge conference, pages 257–266.
Holstein, K., McLaren, B. M., and Aleven, V. (2019).
Co-designing a real-time classroom orchestration tool
to support teacher–ai complementarity. Journal of
Learning Analytics, 6(2).
Hutchins, E. (1995). Cognition in the Wild. Number 1995.
MIT press.
Jivet, I., Scheffel, M., Drachsler, H., and Specht, M. (2017).
Awareness is not enough: Pitfalls of learning analytics
dashboards in the educational practice. In European
conference on technology enhanced learning, pages
82–96. Springer.
Jivet, I., Scheffel, M., Schmitz, M., Robbers, S., Specht, M.,
and Drachsler, H. (2020). From students with love:
An empirical study on learner goals, self-regulated
Generating LADs that Make Sense
45

learning and sense-making of learning analytics in
higher education. The Internet and Higher Education,
47:100758.
Jivet, I., Scheffel, M., Specht, M., and Drachsler, H.
(2018). License to evaluate: Preparing learning an-
alytics dashboards for educational practice. In Pro-
ceedings of the 8th international conference on learn-
ing analytics and knowledge, pages 31–40.
Keshavarzi, M., Bidgoli, A., and Kellner, H. (2020).
V-dream: Immersive exploration of generative de-
sign solution space. In International Conference on
Human-Computer Interaction, pages 477–494.
Khan, S., Gunpinar, E., and Sener, B. (2019). Geny-
acht: An interactive generative design system for
computer-aided yacht hull design. Ocean Engineer-
ing, 191:106462.
Kintz, M., Kochanowski, M., and Koetter, F. (2017). Cre-
ating user-specific business process monitoring dash-
boards with a model-driven approach. In MODEL-
SWARD, pages 353–361.
Klein, G., Moon, B., and Hoffman, R. R. (2006). Mak-
ing sense of sensemaking 1: Alternative perspectives.
IEEE intelligent systems, 21(4):70–73.
Laugwitz, B., Held, T., and Schrepp, M. (2008). Construc-
tion and evaluation of a user experience questionnaire.
In Symposium of the Austrian HCI and usability engi-
neering group, pages 63–76. Springer.
Liu, Z., Nersessian, N., and Stasko, J. (2008). Distributed
cognition as a theoretical framework for information
visualization. IEEE transactions on visualization and
computer graphics, 14(6):1173–1180.
Mayer, B. and Weinreich, R. (2017). A dashboard for
microservice monitoring and management. In 2017
IEEE International Conference on Software Architec-
ture Workshops (ICSAW), pages 66–69. IEEE.
Meyer, J., Thomas, J., Diehl, S., Fisher, B., and Keim, D. A.
(2010). From visualization to visually enabled rea-
soning. In Dagstuhl Follow-Ups, volume 1. Schloss
Dagstuhl-Leibniz-Zentrum fuer Informatik.
Pirolli, P. and Card, S. (2005). The sensemaking process
and leverage points for analyst technology as identi-
fied through cognitive task analysis. In Proceedings
of international conference on intelligence analysis,
volume 5, pages 2–4. McLean, VA, USA.
Prieto-Alvarez, C. G., Martinez-Maldonado, R., and An-
derson, T. D. (2018). Co-designing learning analyt-
ics tools with learners. In Learning Analytics in the
Classroom, pages 93–110. Routledge.
Sadallah, M., Gilliot, J.-M., Iksal, S., Quelennec, K., Ver-
meulen, M., Neyssensas, L., Aubert, O., and Venant,
R. (2022). Designing lads that promote sensemak-
ing: A participatory tool. In Educating for a New Fu-
ture: Making Sense of Technology-Enhanced Learn-
ing Adoption: Proceedings of the 17th European Con-
ference on Technology Enhanced Learning, EC-TEL
2022, volume 13450 of Lecture Notes in Computer
Science, pages 587–593. Springer.
Santoso, H. B., Schrepp, M., Isal, R., Utomo, A. Y., and
Priyogi, B. (2016). Measuring user experience of the
student-centered e-learning environment. Journal of
Educators Online, 13(1):58–79.
Sarmiento, J. P. and Wise, A. F. (2022). Participatory and
co-design of learning analytics: An initial review of
the literature. In Proceedings of the 12th International
Learning Analytics and Knowledge Conference, pages
535–541.
Schrepp, M., Hinderks, A., and Thomaschewski, J. (2014).
Applying the user experience questionnaire (ueq) in
different evaluation scenarios. In International Con-
ference of Design, User Experience, and Usability,
pages 383–392. Springer.
Schulz, H.-J., Hadlak, S., and Schumann, H. (2011). The
design space of implicit hierarchy visualization: A
survey. IEEE Transactions on Visualization and Com-
puter Graphics, 17(4):393–411.
Schwendimann, B. A., Rodr
´
ıguez-Triana, M. J., Vozniuk,
A., Prieto, L. P., Boroujeni, M. S., Holzer, A., Gillet,
D., and Dillenbourg, P. (2017). Perceiving learning
at a glance: A systematic literature review of learning
dashboard research. IEEE Transactions on Learning
Technologies, 10(1):30–41.
Sedrakyan, G., Mannens, E., and Verbert, K. (2019). Guid-
ing the choice of learning dashboard visualizations:
Linking dashboard design and data visualization con-
cepts. Journal of Computer Languages, 50:19–38.
Shaw, M. (2012). The role of design spaces. IEEE software,
29(1):46–50.
Shneiderman, B. (2003). The eyes have it: A task by data
type taxonomy for information visualizations. In The
craft of information visualization, pages 364–371. El-
sevier.
Tullis, T. S. and Stetson, J. N. (2004). A comparison of
questionnaires for assessing website usability. In Us-
ability Professionals Association 2004 Conference.
Van Wijk, J. J. (2005). The value of visualization. In VIS
05. IEEE Visualization, 2005., pages 79–86. IEEE.
V
´
azquez-Ingelmo, A., Garcia-Penalvo, F. J., and Theron,
R. (2019). Information dashboards and tailoring
capabilities-a systematic literature review. IEEE Ac-
cess, 7:109673–109688.
Yalc¸in, M. A., Elmqvist, N., and Bederson, B. B. (2016).
Cognitive stages in visual data exploration. In Pro-
ceedings of the 6th Workshop on Beyond Time and Er-
rors on Novel Evaluation Methods for Visualization,
pages 86–95.
Yigitbasioglu, O. M. and Velcu, O. (2012). A review
of dashboards in performance management: Implica-
tions for design and research. International Journal of
Accounting Information Systems, 13(1):41–59.
Yoo, Y., Lee, H., Jo, I.-H., and Park, Y. (2015). Educa-
tional dashboards for smart learning: Review of case
studies. In Emerging Issues in Smart Learning, pages
145–155. Springer.
Zhang, P. and Soergel, D. (2014). Towards a comprehen-
sive model of the cognitive process and mechanisms
of individual sensemaking. Journal of the Association
for Information Science and Technology, 65(9):1733–
1756.
CSEDU 2023 - 15th International Conference on Computer Supported Education
46
