
Exploring Potential Causal Models for Climate-Society-Conflict
Interaction
Weisi Guo
1,2 a
, Schyler Sun
1 b
and Alan Wilson
2 c
1
Cranfield University, Bedford, U.K.
2
Alan Turing Institute, London, U.K.
Keywords:
Conflict, Climate Change, Causal Models.
Abstract:
Climate change affects human liveability and may increase the likelihood of armed violence. However, the
precise repercussions on social cohesion and conflict are difficult to model, and several socio-economic mech-
anisms exist between local climate changes and conflict, and are often hidden to us. Nonetheless, we offer an
exploratory data analysis in this paper at a global scale, on the relationship between diverse climate indicators
and conflict. Here we investigate potential basic causal models between climate change and conflict, including
the causal direction, causal lag, and causal strength. We use historical climate and extreme environmental
event data from the past 50 years across the world to identify geographic region-specific causal indicators.
The initial broad findings are: (1) rainfall is a reasonably general indicator of conflict, (2) there are fragile
regions which exhibit a strong causal link between extreme climate variations and conflict (predominantly in
Africa and South Asia), and 3. there exists a common time lag of the causality between the climate variations
and the conflict in many regions, which is worth further study.
1 INTRODUCTION
Among the most worrying of the mooted impacts of
climate change is an increased risk in armed conflict.
As people compete for diminishing resources, such as
arable land and water (Homer-Dixon, 2010), forced
migration and labour changes can introduce politi-
cal tensions and create conflict in fragile states. Re-
search over the past decade has established that cli-
mate variability and extreme change may influence
the risk of violent conflict (including political vio-
lence, terrorism, civil and inter-state wars) (Burke
et al., 2009; Hsiang et al., 2011). Authors in (Hsiang
and Burke, 2014) examined 50 quantitative empirical
studies and found a remarkable convergence in find-
ings and strong support for a causal association be-
tween climatological changes and conflict at all scales
and across all major regions of the world. How-
ever, under various hypothesis, different methodolo-
gies and datasets applied, the results in different re-
gions are divergent or even contradictory (Mach et al.,
2019; Buhaug, 2010; Slettebak, 2012). Although the
a
https://orcid.org/0000-0003-3524-3953
b
https://orcid.org/0000-0001-8465-8448
c
https://orcid.org/0000-0002-7495-6617
relationship between climate and conflict has been
empirically tested in a wide variety of studies, the lit-
erature has yet to converge on a commonly accepted
set of causal mechanisms (Salehyan, 2014). For ex-
ample, some states may experience an irreversible
labour transformation from agricultural economy to
urban organised crime, whereas others may see mi-
gratory sources of violence.
1.1 Review of Causal Analysis in
Complex Systems
Causal analysis in complex systems with no existing
explicit mathematical models is challenging. On the
one hand, an end-to-end data analysis between cli-
mate change and conflict might exhibit certain results,
but one cannot be certain they are reasonable and re-
late to known socioeconomic mechanisms. We of-
fer a brief review of existing data-driven causal infer-
ence approaches and then go on to explain our dual
approach of verifying data analysis with a toy causal
model.
Guo, W., Sun, S. and Wilson, A.
Exploring Potential Causal Models for Climate-Society-Conflict Interaction.
DOI: 10.5220/0011968400003485
In Proceedings of the 8th International Conference on Complexity, Future Information Systems and Risk (COMPLEXIS 2023), pages 69-76
ISBN: 978-989-758-644-6; ISSN: 2184-5034
Copyright
c
2023 by SCITEPRESS – Science and Technology Publications, Lda. Under CC license (CC BY-NC-ND 4.0)
69

1.1.1 Stationary to Nonlinear State Space
Approaches
Granger causality test is the first proposed station-
ary approach to detect causality based on statis-
tical hypothesis test. Two time series are given
and under Granger’s theory, the causality (the al-
ternative hypothesis) is defined as that time series
[..., X(t − 1), X(t)] provide significant information
about [Y (t),Y (t + 1), ...] (Granger, 1969). It is valid
in stationary linear systems rather than dynamic sys-
tems. The predictability improvement (PI) causal-
ity test is proposed in response to this issue, where
(Krakovska, 2017; Krakovska and Hanzely, 2016;
Krakovska et al., 2018) reconstruct the time series in
multi-dimensional state spaces, which try to convert
the non-linear dynamic system into a linear manifold,
where the Granger causality test can then be applied.
Conditional mutual information (CMI)
(Hlavackova-Schindler et al., 2007) is based on
transfer entropy. Discrete random variables (X,Y, Z)
with support sets (X, Y, Z) are given, and the CMI
I(X,Y |Z) estimates the directed information flow
from a variable X to another variable Y under the
condition of Z. Different from PI hypothesis test, the
CMI approach can yield the value of predictability
improvement. CMI does not depend on any assump-
tions in its formulation compared to other directed
information flow measures like Granger causality,
which makes this method capable of assessing both
linear and non-linear interactions. In time series
causality detection application, with a causation lag
τ, I(X(n),Y (n +τ)|Y (n)) is normally used to evaluate
the causality with directionality (Li and Ouyang,
2010; Wen et al., 2019).
In (Sugihara et al., 2012; Tsonis et al., 2018), Con-
vergent Cross Map (CCM) is proposed to detect the
causal relationships in nonlinear dynamical systems.
The key idea of CCM lies on the fundamental princi-
ple of Takens’s theorem, which states that in a time se-
ries dynamical system with multi-variables, any sin-
gle series of one variable of the system can be re-
covered by the historical series of another variable by
high dimensional state space reconstruction. In prac-
tical terms of CCM, two time series X ,Y is given,
and the causality is defined as the extent to which
the time series [X(t −Eτ), ..., X(t −2τ), X(t −τ)] can
be encoded into time series Y (t). The parameter τ
here is the time step for the reconstruction while E is
the dimension of the reconstruction. CCM has been
successfully applied in various climate change fields,
such as the soil moisture-precipitation interaction in
environment (Wang et al., 2018), the sensitivity of the
carbon cycle to tropical temperature variations (Wang
et al., 2014) and the relationship between temperature
and green-house gases (Nes et al., 2015) in climate
research.
1.1.2 Neural Approaches
Long Short-Term Memory (LSTM) is an artificial re-
current neural network (RNN) architecture, which is
capable of learning order dependence in series. The
training process in LSTM can be considered as an
adaptive non-linear regression from the input series to
the output series. Owing to the non-linear expressive
power of the neurons and the characteristics of RNN,
LSTM has the following advantages (Krakovska and
Jakubik, 2020): (a) able to store information for an
arbitrary duration; (b) resistant to noise (i.e., fluctu-
ations of the inputs that are random or irrelevant for
regression); (c) trainable in a reasonable time. In our
practice, two time series X,Y is given, we set X (t)
and Y (t) as the inputs while Y (t + 1) as the output.
Then, we can evaluate the causality of X (t) by vali-
dating the regression error in LSTM. Other variations
of this include the Neural Point Process (NPP), where
a given time-series process is established (e.g., point
process), and the neural network models a non-linear
function that maps diverse variables to the intensity
of the PP. This has been quite successful in our recent
modeling of climate conflict interactions (Sun et al.,
2022).
1.1.3 Summary & Innovation
In summary, methods such as PI gives the non-linear
Granger causality between two series through hypoth-
esis testing at the most basic binary level, whereas
CMI model the causality strength using the mutual in-
formation between two series, and CCM reconstructs
one series into another and evaluates the causality us-
ing the correlation between reconstructed series and
raw series. Neural method such as LSTM and neu-
ral point process (NPP) does an adaptive nonlinear
regression from one series to another and assess the
causality by prediction error. These methods increas-
ingly contribute towards AI algorithms in understand-
ing complex climate social interactions and predicting
conflict (Guo et al., 2018). However, without an un-
derlying multi-staged causal model, we have no way
of knowing how reasonable these approaches are. Cli-
mate change can cause multi-staged social transfor-
mations (e.g., agricultural, supply chain, labour mar-
kets, migration....etc.) with different dynamical pro-
cesses and lag times.
As such, this paper first introduces a basic causal
toy model to verify first that these approaches can or
cannot evaluate artificial data successfully. We then
evaluate the real end-to-end data to draw disaggre-
COMPLEXIS 2023 - 8th International Conference on Complexity, Future Information Systems and Risk
70

Figure 1: Example data of weather and natural disasters.
gated and general conclusions.
2 DATA & CAUSAL MODEL
2.1 Data
In this paper, temperature and rainfall data
are used to represent the general climate
conditions. We used the ERA5 dataset
(https://www.ecmwf.int/en/forecasts/datasets/reanaly-
sis-datasets/era5), which records the global temper-
ature and rainfall gridded in 0.5 degree resolution
(grid size is 56-79 sqkm depending on latitude),
and monthly in scope, spanning 1970-present. For
natural disaster events (including tsunami, drought,
tornado and etc.) we use the Emergency Events
Database (EM-DAT, https://www.emdat.be), which
records these events around the world with the dates
and locations, spans 1900-present. In this paper,
data from Global Terrorism Database (GTD) are
selected as the indicator of conflict, which dominate
the majority of violent events. GTD is the most
comprehensive database of terrorist attacks in the
world, which contains over 200k terrorist attacks
with the dates and locations, spans 1970-2018.
In our experiments, in order to keep data’s at-
tributes consistency in causality tests, the data are pre-
processed as follow:
• Data series spans 1970-2018 are selected,
• Data series are unified into monthly resolution,
• For natural disasters and terrorist attacks, we
quantify it in terms of its counting times per
month
• Data series for the following 12 regions are se-
lected: (i) Northern Africa (AfricaN), (ii) South-
ern Africa (AfricaS), (iii) Central America (Amer-
Figure 2: Our assumptions of the overall causal mecha-
nisms between climate change, social transformation, and
conflict. End-to-end causal data analysis (top) between Z
and Y will be validated by artificial data generated by a
causal toy model (bottom).
Figure 3: Rossler toy model and underlying equations and
parameters.
icaC), (iv) Northern America (AmericaN), (v)
Southern America (AmericaS), (vi) Central Asia
(AsiaC), (vii) Eastern Asia (AsiaE), (viii) South-
ern Asia (AsiaS), (ix) Southeastern Asia (Asi-
aSE), (x) Eastern Europe (EuropeE), (xi) Western
Europe (EuropeW) and (xii) Oceania.
Example of data is shown in Fig.1.
2.2 Toy Causal Model
We develop a toy causal model as the simplest step
one can take to test if causal detection would work.
Fig.2 shows the assumptions we used. We assume
the climate system (i.e. RainFall (x
1
), Temperature
(x
2
) and Natural Disaster (x
3
)) is an autonomous sys-
tem which has linear and nonlinear internal causal-
ity to each other, while there is a unidirectional lin-
ear causal link from climate system to the agriculture
(y
1
). The agriculture has a bidirectional linear causal
link with the socio-economic (y
2
) while also a uni-
directional linear causal link from conflict (y
3
) to it.
Exploring Potential Causal Models for Climate-Society-Conflict Interaction
71
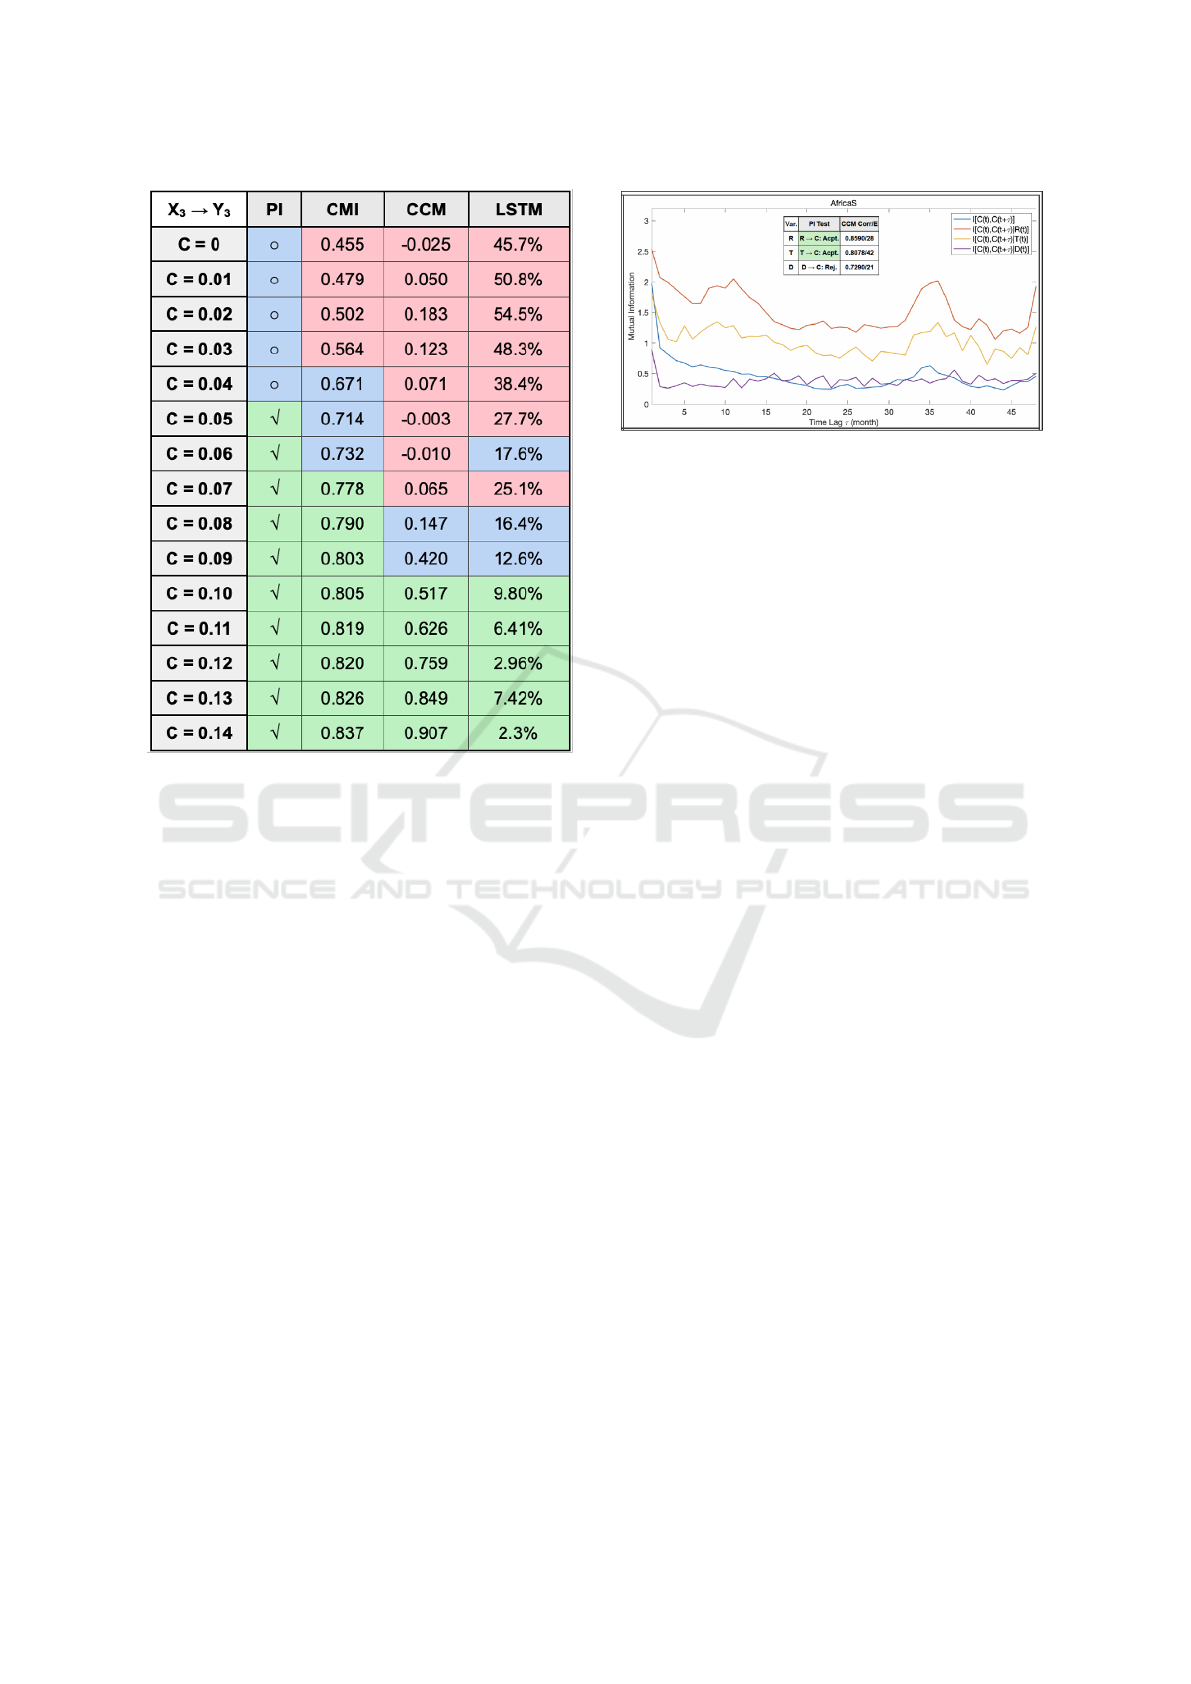
Figure 4: Causal analysis verification in the toy model:
green is acceptance, blue is borderline, and red is rejection
of null hypothesis.
Then, our key assumption is that the agriculture has
a nonlinear causal link to the conflict. Based on our
assumptions, we establish a toy model using two uni-
directional coupled Rossler systems (Fig.3) with an
adjustable coupling strength parameter C. The initial
conditions can be arbitrary, in our experiments, we
set the initial conditions of ω
1
= 1.015, ω
2
= 0.985
and x
0
= y
0
= [1, 1, 0]. With our initial conditions,
two systems would be synchronized when the cou-
pling strength C is about 0.14. An example of the
Rossler model is in Fig.3.
2.3 Validation Using Toy Model
Firstly, we test classical causal methods (i.e., PI,
CCM and CMI) on the aforementioned theoretical toy
model, in order to verify the validity of these meth-
ods in detecting our assumed causality mechanism be-
tween climate and conflict. Fig.4. gives the causality
results in our theoretical toy model with the coupling
strength from 0 to 0.14 before the synchronization.
The values in PI give the hypothesis test results on
whether X
3
cause the Y
3
; The outcome in the CMI
model give the amount of mutual information given
by X
3
to Y
3
; The values in CCM give the correlation
between the reconstructed Y
3
using X
3
and Y
3
itself;
Figure 5: Sub-Sahara causal results of PI, CCM, and CMI
by region. The abbreviations are: Var = variable, Acpt. =
Acceptance, Rej. = Rejection, Corr = Correlation, RTS =
Reconstruction Time Steps, C = Conflict, R = Rainfall, T =
Temperature, D = Natural Disaster, R ⇒ C = R cause C.
The values in LSTM give the regression error in per-
centage.
The result shows that all methods can detect the
causality link before the synchronization of two sys-
tems. However, it can be observed that PI method
has the most sensitivity to the causality among all our
proposed methods, while CCM and LSTM require the
longest lags to reliably detect causality. Another no-
table thing is that LSTM is not consistent in perfor-
mance. PI, CMI and CCM always give better result
when the coupling strength goes up while LSTM does
not. Due to it is unexplainable, the result come from
LSTM is more blackbox than the others and we will
analyze the LSTM result separately.
3 GLOBAL RESULTS
3.1 Overall Causality Results by Region
The raw quantitative overall causality results of PI,
CCM and CMI by region are shown in Fig.6, with a
specific highlighted example of Sub-Sahara in Fig.5.
In each sub-figure, we show the CMI results for dif-
ferent cause in different time lags with the coloured
lines, and the PI and CCM results in the table at-
tached on. For CCM, we have two values in the grid,
the first value is the correlation value between the re-
constructed conflict data and raw conflict data, while
the second one is the corresponding reconstruction di-
mension.
In order to have more intuitive interpretation and
analysis, we convert these results into qualitative rep-
resentations with the following rules:
(1) For PI hypothesis test, we use
√
(coloured
in green) to represent the accepted positive causal-
ity from the variables series towards terrorism series,
◦ (coloured in blue) to represent no causality, and
COMPLEXIS 2023 - 8th International Conference on Complexity, Future Information Systems and Risk
72

Figure 6: Overall causal results of PI, CCM, and CMI by region. The abbreviations are: Var = variable, Acpt. = Acceptance,
Rej. = Rejection, Corr = Correlation, RTS = Reconstruction Time Steps, C = Conflict, R = Rainfall, T = Temperature, D =
Natural Disaster, R ⇒ C = R cause C.
× (coloured in red) to represent reversed anti-nature
causality from terrorism series towards climate series
(2) For correlation degree in CCM, we define ρ > 0.7
as strong correlated (coloured in green), 0.4 < ρ ≤0.7
as moderate correlated (coloured in blue), and 0.2 <
ρ ≤ 0.4 as weak correlated (coloured in red), ρ ≤ 0.2
as none correlated (3) For causality mechanism com-
plexity degree in CCM, we define E < 13 as low com-
plexity, 13 < E ≤ 24 as moderate complexity, E > 24
as high complexity (4) There are no absolute stan-
dards for CMI which makes the inter-comparison of
CMI between different regions’ datasets meaningless,
thus we use the CMI mean difference over MI of ter-
rorism series:
E(CMI −MI) =
E
I[C(t),C(t +τ) −MI|Var(t)] −I[C(t),C(t +τ)]
,
(1)
to demonstrate the assistance of climate series causal-
ity in one region and internally compare this causal-
ity. The larger the difference between CMI and MI
appears, the more causality effect the corresponding
condition has. We set the self-mutual information as
the baseline and calculate the addition mutual infor-
mation given by the condition. We coloured the value
larger than 0.5 in green, 0-0.5 in blue and negative
value in red for clearer demonstrating results.
Fig.7 shows the processed qualitative interpreta-
tion of the causality results both in region domain and
methods domain according to our rules. We are going
to analyse these results in both domains:
3.1.1 Region Domain
It can be observed that the regions of AfricaN,
AfricaS, AsiaS and AsiaSE give the strongest causal-
ity evidence of climate series affects terrorism series
from the results of all these three methods. However,
although the result for other regions is ambiguous, it
does not necessarily mean that the causality does not
exist in these regions, it is also possible that our meth-
ods cannot detect the causality completely.
Another notable issue is the inconsistency in re-
sults from different methods. The representative ex-
amples are AmericaC and AsiaC, causality of natural
disaster series results given from PI, CCM and CMI
are conflicting with each other. The reason for this
would be that the real mechanism in these regions is
beyond our assumptions.
3.1.2 Method Domain
PI: With PI hypothesis test, terrorism series in each
region shows the predictability improvement from
the corresponding rainfall series. However, temper-
ature series act as a cause to terrorism series in just
some specific regions, while natural disaster series af-
fect only one region (i.e., AsiaC). Based on this PI
method, the rainfall series can be concluded as a uni-
versal causation factor to the terrorism series.
CCM: The correlation offered by CCM is always
contiguous with climate series in each region, there
is no case where one variable series has strong CCM
correlation while others have it weak. This result in-
dicates that the climate variables in our experiments
can be considered as an autonomous system which
the terrorism system is coupled on.
Exploring Potential Causal Models for Climate-Society-Conflict Interaction
73

Figure 7: (a) Qualitative interpretation of PI, CCM, and CMI in each region (region domain), (b) Parallel comparison of
qualitative interpretations in each region (method domain).
CMI: In CMI method, the condition of rainfall and
temperature series offers the positive mutual informa-
tion between the terrorism series C(t) and C(t + τ) in
all of the regions except for AmericaC. However, the
mutual information given by the condition of natural
disaster series is ambiguous over these regions, which
match the results in (Slettebak, 2012) - natural disas-
ters are not the factors to be blamed for conflict.
3.2 LSTM Causality Result
We analyze the LSTM result separately since it is un-
explainable, which makes its result not guaranteed to
be true. In our experiments, we establish a LSTM net-
work with two LSTM layers with 128 hidden nodes
and three full connect layers with 64,128,16 hidden
nodes respectively. There maybe other architectures
featuring attention and mixed with graph neural net-
works we have not considered yet and is left for future
work.
We applied one-step prediction along the last ten
years (1998-2018), which means for each month in
each region, an independent LSTM is applied, while
the average prediction percentage error is considered
as the causality indicator. Fig.8 shows the results from
LSTM. In AmericaC, AmericaS, AsiaE and Ocea-
nia, the causality between climate and conflict is am-
biguous from a LSTM regression sight, while oth-
ers shows climate series may help in the conflict pre-
diction which indicates the causality between climate
and conflict. However, we can also observe the in-
stability of the algorithm from the results, e.g. in
AfricaN, AsiaC, EuropeE and Oceania, the prediction
with inputs of C&D is worse than that with only C.
This means LSTM has learned some odd mechanisms
which actually does not exist and cause an overfitting.
COMPLEXIS 2023 - 8th International Conference on Complexity, Future Information Systems and Risk
74
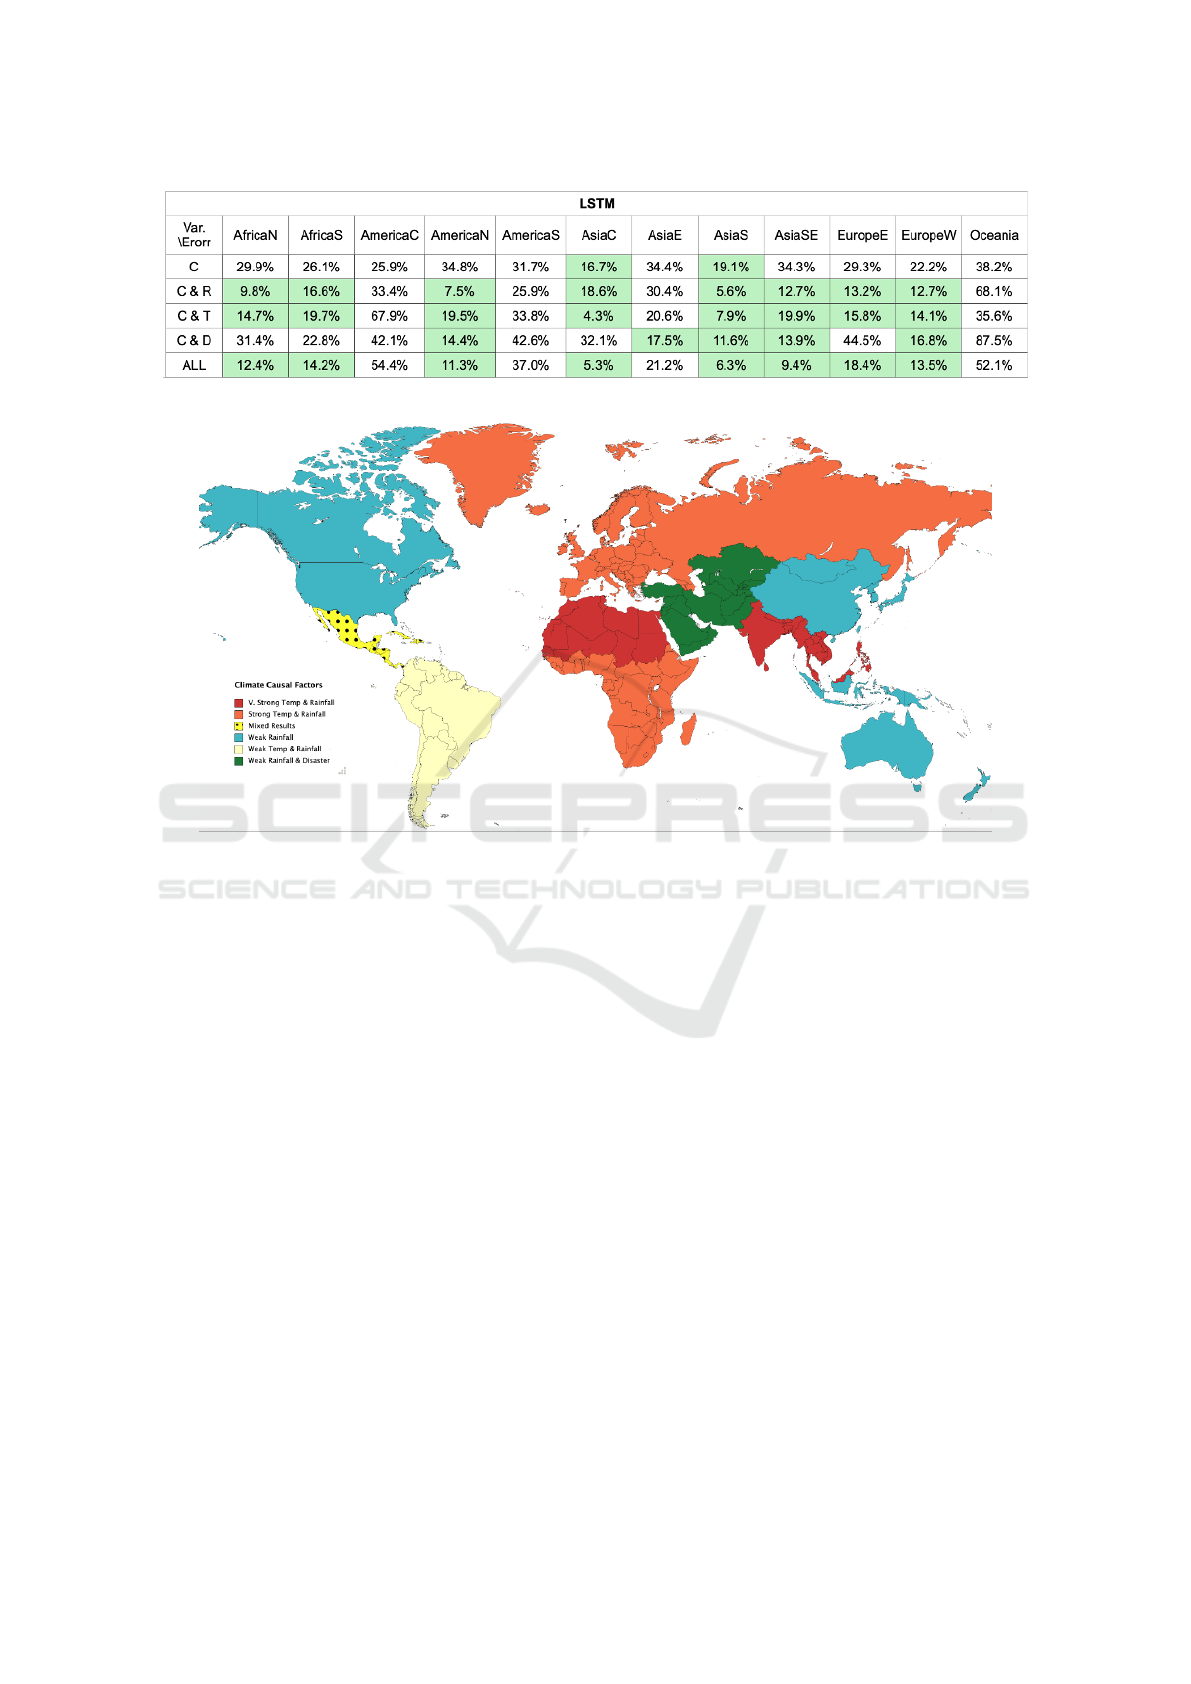
Figure 8: LSTM results.
Figure 9: Global result summary by region.
In this report, we will only take the LSTM results as
a reference, not as a decisive factor.
3.3 Temporal Lag
Back to Fig.8, we find an interesting phenomenon in
CMI(τ) results. Obviously, when temporal lag τ = 0,
the mutual information between terrorism series C(t)
and C(t +τ) reaches the maximum. Nevertheless, the
rainfall and temperature series CMI(τ) reaches an-
other peek when the temporal lag τ is around 10-14
months (1 year) and around 34-38 months (3 years) in
the regions of AfricaN, AfricaS, AsiaE, AsiaS, Asi-
aSE and EuropeE. This indicates that in these re-
gions, the climate series may have the same causa-
tion mechanism in climate ⇒ agriculture ⇒ socioe-
conomic ⇒ conflict under our assumptions. A possi-
ble preliminary answer would be that, in low socioe-
conomic development and low capabilities regions,
or regions dominated by agriculture, the climate has
a distinct causation to the region conflict/terrorism
with the time lag of one year and three year (Mach
et al., 2019). However, the mechanism lay in this
phenomenon is still an open question and becomes a
further issue for us.
4 CONCLUSIONS AND NEXT
STEPS
Climate change affects human liveability and may in-
crease the likelihood of armed violence. However, the
precise repercussions on social cohesion and conflict
are difficult to model, and several socio-economic
mechanisms exist between local climate changes and
conflict, and are often hidden to us. Nonetheless, we
offer an exploratory data analysis in this paper at a
global scale, on the relationship between diverse cli-
mate indicators and conflict. Here we investigate po-
tential basic causal models between climate change
and conflict, including the causal direction, causal lag,
and causal strength. We use historical climate and
extreme environmental event data from the past 50
years across the world to identify geographic region-
specific causal indicators. The initial broad find-
ings shown in Fig.9 are: (1) rainfall is a reasonably
general indicator of conflict, (2) there are fragile re-
Exploring Potential Causal Models for Climate-Society-Conflict Interaction
75

gions which exhibit a strong causal link between ex-
treme climate variations and conflict (predominantly
in Africa and South Asia), and 3. there exists a com-
mon time lag of the causality between the climate
variations and the conflict in many regions, which is
worth further study. In order to identify the spurious
causality in our results from pure data analysis per-
spective, we proposed to embed the knowledge from
social science into our initial assumptions about the
mechanisms within climate and conflict.
ACKNOWLEDGEMENTS
We acknowledge funding from the Alan Turing In-
stitute via the Defence and Securities Program, and
valuable advice and help given by the previous pro-
gram director Prof. Mark Briers.
REFERENCES
Buhaug, H. (2010). Climate not to blame for african civil
wars. In Proc. National Academy of Sciences (PNAS).
Burke, M. B., Miguel, E., Satyanath, S., Dykema, J. A.,
and Lobell, D. B. (2009). Warming increases the risk
of civil war in africa. In Proc. National Academy of
Sciences (PNAS).
Granger, C. W. (1969). nvestigating causal relations by
econometric models and cross-spectral methods. In
Econometrica: journal of the Econometric Society.
Guo, W., Gleditsch, K., and Wilson, A. (2018). Retool AI
to forecast and limit wars. In Nature.
Hlavackova-Schindler, K., Palus, M., Vejmelka, M., and
Bhattacharya, J. (2007). Causality detection based on
information-theoretic approaches in time series analy-
sis. In Physical Reports.
Homer-Dixon, T. (2010). Environment, scarcity, and vio-
lence. Princeton University Press.
Hsiang, S. M. and Burke, M. (2014). Climate, conflict, and
social stability: what does the evidence say? In Cli-
matic Change.
Hsiang, S. M., Meng, K. C., and Cane, M. A. (2011). Civil
conflicts are associated with the global climate. In
Nature.
Krakovska, A. (2017). Predictability improvement as a tool
to detect causality. In International Conference on
Measurement.
Krakovska, A. and Hanzely, F. (2016). Testing for causality
in reconstructed state spaces by an optimized mixed
prediction method. In Physical Review E.
Krakovska, A. and Jakubik, J. (2020). Implementation of
two causal methods based on predictions in recon-
structed state space. In Physical Review E.
Krakovska, A., Jakubik, J., Chvostekova, M., Coufal, D.,
Jajcay, N., and Palus, M. (2018). Comparison of six
methods for the detection of causality in a bivariate
time series. In Physical Review E.
Li, X. and Ouyang, W. (2010). Estimating coupling direc-
tion between neuronal populations with permutation
conditional mutual information. In NeuroImage.
Mach, K. J., Kraan, C. M., Adger, W. N., Buhaug, H.,
Burke, M., Fearon, J. D., Field, C., Maystadt, J.-F.,
and O’Loughlin, J. (2019). Climate as a risk factor for
armed conflict. In Nature.
Nes, E. H. V., Scheffer, M., Brovkin, V., Lenton, T. M., Ye,
H., Deyle, E., and Sugihara, G. (2015). Causal feed-
backs in climate change. In Nature Climate Change.
Salehyan, I. (2014). Climate change and conflict: Making
sense of disparate findings. In Political Geography.
Slettebak, R. T. (2012). Don?t blame the weather! climate-
related natural disasters and civil conflict. In Journal
of Peace Research.
Sugihara, G., May, R., Ye, H., h. Hsieh, C., Deyle, E., Fog-
arty, M., and Munch, S. (2012). Detecting causality in
complex ecosystems. In Science.
Sun, S. C., Jin, B., Wei, Z., and Guo, W. (2022). Revealing
the excitation causality between climate and political
violence via a neural forward-intensity poisson pro-
cess. In International Joint Congress on AI (IJCAI).
Tsonis, A., Deyle, E. R., Ye, H., and Sugihara, G. (2018).
Convergent cross mapping: theory and an example. In
Advances in nonlinear geosciences.
Wang, X., Piao, S., Ciais, P., Friedlingstein, P., Myneni,
R. B., Cox, P., Heimann, M., Miller, J., Peng, S., and
Wang, T. (2014). A two-fold increase of carbon cy-
cle sensitivity to tropical temperature variations. In
Nature.
Wang, Y., Yang, J., Chen, Y., P. De Maeyer, Z. L., and Duan,
W. (2018). Detecting the causal effect of soil moisture
on precipitation using convergent cross mapping. In
Nature Scientific reports.
Wen, D., Jia, P., Hsu, S.-H., Zhou, Y., Lan, X., Cui, D., Li,
G., Yin, S., and Wang, L. (2019). Estimating coupling
strength between multivariate neural series with mul-
tivariate permutation conditional mutual information.
In Neural Networks.
COMPLEXIS 2023 - 8th International Conference on Complexity, Future Information Systems and Risk
76
