
Evaluation of Urban Perception Using Only Image Segmentation
Features
Xinyi Li
a
, Benjamin Beaucamp
b
, Vincent Tourre
c
, Thomas Leduc
d
and Myriam Servi
`
eres
e
Nantes Universit
´
e, ENSA Nantes,
´
Ecole Centrale Nantes, CNRS, AAU-CRENAU, UMR 1563, F-44000 Nantes, France
Keywords:
Urban Perception, Voluntary Geographic Information, Place Pulse 2.0, Computer Vision, Panoptic
Segmentation, Deep Learning, Machine Learning.
Abstract:
Deep learning has been used with the street-view imagery Place Pulse 2.0 to evaluate the perception of urban
space along six perceptual dimensions: safe, lively, beautiful, wealthy, boring, and depressing. Traditional
methods automatically extract feature representations from images through a convolutional neural network to
yield prediction. However, the formers are computationally intensive and do not take a priori into account the
semantic information from panoptic segmentation scene. In light of this, we propose that learning with seman-
tic information could be close to full image analysis for the prediction of perceptual qualities. A lightweight
solution is presented, which quickly predicts the sense of urban space from the implied highly compressed seg-
mentation feature vectors of the street-view images via deep/machine learning models. Our solution achieves
an average accuracy of about 62%, which is acceptable compared to the baseline result accuracy of 68%, and
significantly reduces the complexity of the data and the computational effort.
1 INTRODUCTION
The physical appearance of urban space could affect
the perception of individuals (Azma and Katanchi,
2017), and further influences their behavioral patterns
(Miranda et al., 2021). Many social scientists have
revealed the link between the disorderliness of cities
and residents’ perception of safety and criminal be-
havior (Kelling et al., 1982), between the appear-
ance of street buildings and the feeling of fear and
health (Cohen et al., 2003), between neighborhood
perceived climate and education (Milam et al., 2010),
etc. Objectively evaluating the impact of urban land-
scape on residents’ perception is of great importance
to effectively analyze and predict residents’ behav-
ior patterns, and inspire urban planners and decision-
makers on the improvement of urban life quality. One
application of this research by (Zhang et al., 2018a)
is the creation of a map showing the spatial distri-
bution of the sense of safety perceived through the
streetscapes in Chengdu. Their work can reveal to ur-
a
https://orcid.org/0009-0006-4549-4851
b
https://orcid.org/0000-0001-6930-3032
c
https://orcid.org/0000-0003-4401-9267
d
https://orcid.org/0000-0002-5728-9787
e
https://orcid.org/0000-0001-5749-1590
ban planners which areas lack security.
The studies of urban perception evaluation present
practical challenges. Traditional research methods,
such as field surveys, neighborhood audits (Sampson
and Raudenbush, 1999), and crowdsourced studies,
are difficult to assess at large cross-city (Rundle et al.,
2011), fine-grained, and uniform scales, while high
survey costs and measurement errors are also draw-
backs of these approaches.
Recent advances in digitalization technology have
produced new means of data collection to pro-
vide high-resolution, real-time, and large-spatial-
scale landscape image data support for urban per-
ception studies. Publicly available street-view im-
ages (SVI), such as Google Street View, Mapillary
(Neuhold et al., 2017), and Tencent Street View
1
, are
used to evaluate the urban perceptual quality of safety
(Dubey et al., 2016), comfort (Liu et al., 2019), green-
ery (Li et al., 2015), vitality (Wei et al., 2022). With
such massive image data collected on an international
scale, some researchers applied deep/machine learn-
ing, the key techniques to exploit the value of these
data. Deep/machine learning models extract features
from SVI and further predict human perception. Most
of the works are based on the MIT project Place Pulse
1
See https://map.qq.com (Accessed January 2023).
200
Li, X., Beaucamp, B., Tourre, V., Leduc, T. and Servières, M.
Evaluation of Urban Perception Using Only Image Segmentation Features.
DOI: 10.5220/0011969700003473
In Proceedings of the 9th International Conference on Geographical Information Systems Theory, Applications and Management (GISTAM 2023), pages 200-207
ISBN: 978-989-758-649-1; ISSN: 2184-500X
Copyright
c
2023 by SCITEPRESS – Science and Technology Publications, Lda. Under CC license (CC BY-NC-ND 4.0)

2.0 (PP2) (Dubey et al., 2016), which provides pair-
wise comparisons of Google SVI on six perceptual
attributes, namely safe, lively, beautiful, wealthy, bor-
ing, and depressing.
However, the existing efforts largely depend on
purely visual information (images) to train models.
Some researchers have noticed the importance of se-
mantic information of visual elements (e.g. car, traf-
fic light, crosswalk) in images. People combine the
scene they see with previous experiences to gain spe-
cial feelings (Azma and Katanchi, 2017). The visual
elements, a medium carrying the observer’s previous
experiences, can evoke different feelings in city ob-
servers’ minds. For example, when people enter a
new city, although no images of the place exist, they
always have some experience of previously observed
visual elements (e.g. traffic lights), which influence
their perceptual activity (feeling safe). Thus, some
studies introduced semantic segmentation techniques
to assist urban perception prediction and explored
how different visual elements impact human sensing
(Ji et al., 2021; Zhang et al., 2018b; Zhang et al.,
2018a; Xu et al., 2019). These works demonstrate
that the semantic information of the visual elements
can influence urban perception, although it is not the
only factor that affects this process. The central ques-
tion this paper asks is whether using only this non-
visual and condensed information in deep/machine-
learning-based urban perception prediction can lead
to results comparable to traditional methods based on
image analysis. Our work demonstrates and explains
that applying only the semantic information extracted
from different visual elements in SVI, can achieve ac-
ceptable performance for urban perceptual qualities
prediction, with results close to those of image-based
methods. Our main contributions are the following:
• A purely quantitative, non-image, and highly
compressed derived dataset of PP2, in which we
summarize each PP2 image as feature vectors that
contain only semantic information.
• A neural network for urban perception evaluation
paired with the derived dataset achieves an aver-
age accuracy of 62.4%.
• The effectiveness of the segmentation information
is verified on classical machine learning models
(Linear Regression, SVM, Random Forest, XG-
Boost) as well. The accuracy of models ranges
from 60% to 62%.
• Our work shows that models using coarse seman-
tic information instead of RGB images achieve
acceptable results, despite the huge compression
of information.
2 RELATED WORK
2.1 Place Pulse 2.0 Dataset for Urban
Visual Perception
Place Pulse 2.0 (Dubey et al., 2016) is a specialized
dataset for urban space perception at a global scale. It
consists of 400 × 300 pixels images of 56 cities ob-
tained from Google Street View, and 1,223,649 pair-
wise comparisons from the responses to six questions
based on six perceptual attributes: safe, lively, beau-
tiful, wealthy, boring, and depressing. For example,
volunteers will be given a pair of street-view images
and asked to answer questions, such as “Which place
looks safer?”, “Which place looks more depressing?”.
2.2 Urban Visual Perception via Deep
Learning
With PP2 such a massive geotagged image dataset,
deep learning approaches enable the evaluation of hu-
man perception at a large scale. The classical deep
learning models and their variants can be trained on
PP2 and then predict the outcome of a pairwise SVI
comparison. The pairwise comparison prediction task
is often formulated as a binary classification task to
give a prediction result of 0 or 1, representing one of
the left or right images that performs better for the
given criterion. The most classical RSS-CNN (Dubey
et al., 2016) model employs VGGNet to extract im-
age features and feeds them into the fusion and rank-
ing sub-networks. It predicts pairwise comparison
from two images while considering the ordinal rank-
ing overall dataset, resulting in an average predic-
tion accuracy of 68% on the six attributes. Subse-
quently, several researchers have developed this work
and introduced variants of deep learning networks to
improve prediction performance. Multi-task learning
(Caruana, 1997), a new training paradigm that has
been proven to improve the generalization of deep
learning models, has been used to explore the rela-
tionship between different perceptual attributes and
contribute to the improvement of prediction accuracy
(Guan et al., 2021; Min et al., 2019). The widely pop-
ular attention mechanism (Vaswani et al., 2017) has
also attracted the interest of researchers. Li et al. (Li
et al., 2021) proposed that humans generate their cog-
nition for street-view pictures from the key features
rather than extracting all the information and making
judgments. As an attempt to resemble this character-
istic, the attention mechanism, which is regarded as a
dynamic weight adjustment process based on features
of the input image, is introduced (Min et al., 2019; Li
Evaluation of Urban Perception Using Only Image Segmentation Features
201
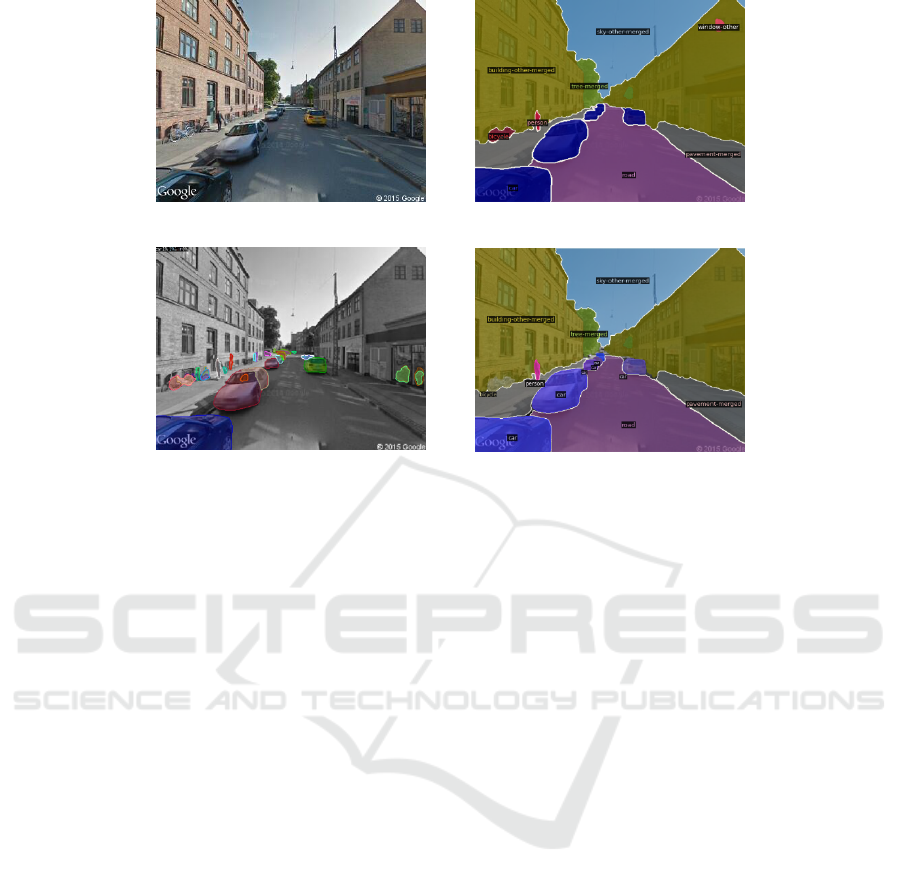
(a) Original image. (b) Semantic segmentation.
(c) Instance segmentation.
(d) Panoptic segmentation.
Figure 1: A segmented PP2 image.
et al., 2022). The model (Li et al., 2022) with atten-
tion module reports a performance that exceeds the
baseline slightly.
Not satisfied with just obtaining a comparative re-
sult, some researchers have tried to gain a deeper un-
derstanding of how human perception of the city is af-
fected. The semantic information of visual elements
in images has received attention, and the relationship
between the visual elements and human perceptions
has become a new topic worth exploring. The existing
study approaches often contain a three-step process:
first, extract the semantic information representation
from SVI by image segmentation technique. The rep-
resentation has different formats depending on their
segmentation networks and the semantic information
they contain. It is usually a structural vector in which
each element indicates the information of an object
category. Second, employ semantic information as a
proxy for the urban environment to predict pairwise
comparison outcomes. Third, the relationship of each
visual element to perceptual attributes is quantified
according to the model parameters. Xu et al. (Xu
et al., 2019) extracted the distribution of 1,000 vi-
sual element categories through ImageNet 2012 clas-
sification network and added the output vector to the
training network as an extra input to assist the visual
perception prediction task. The experimental results
prove that adding semantic information is beneficial,
resulting in a 1.3% improvement in the overall ac-
curacy of the original model with only image inputs.
Zhang (Zhang et al., 2018b) and Ji (Ji et al., 2021) cal-
culated the objects viewshed ratio, which represents
the areal proportion of segmented objects, and used
it to investigate the dependence between visual ele-
ments and human perceptual scores by adopting mul-
tiple linear regression. The above works show that
semantic information can contribute to evaluating hu-
man perceptions of urban space and be a reference to
help researchers understand the relationship between
human perception and visual elements.
2.3 Panoptic Segmentation
Panoptic segmentation is a computer vision task that
involves categorizing objects, as well as identifying
and locating each instance of an object category. It
can be seen as a combination of the typically distinct
tasks semantic segmentation and instance segmenta-
tion (Kirillov et al., 2019). While semantic segmen-
tation only focuses on assigning an object category
label to each pixel in an image, and instance segmen-
tation is aimed at detecting and distinguishing each
instance of particular categories, panoptic segmenta-
tion goes one step further by combining these two ap-
proaches to provide a more detailed and accurate un-
derstanding of an image. For example, in Figure 1,
the different cars are labeled as different things and
are thus separate instances. The road is seen as stuff
and is thus labeled as a single instance.
Masked-attention Mask Transformer
(Mask2Former) (Cheng et al., 2022) is one of
the state-of-the-art panoptic segmentation networks.
GISTAM 2023 - 9th International Conference on Geographical Information Systems Theory, Applications and Management
202
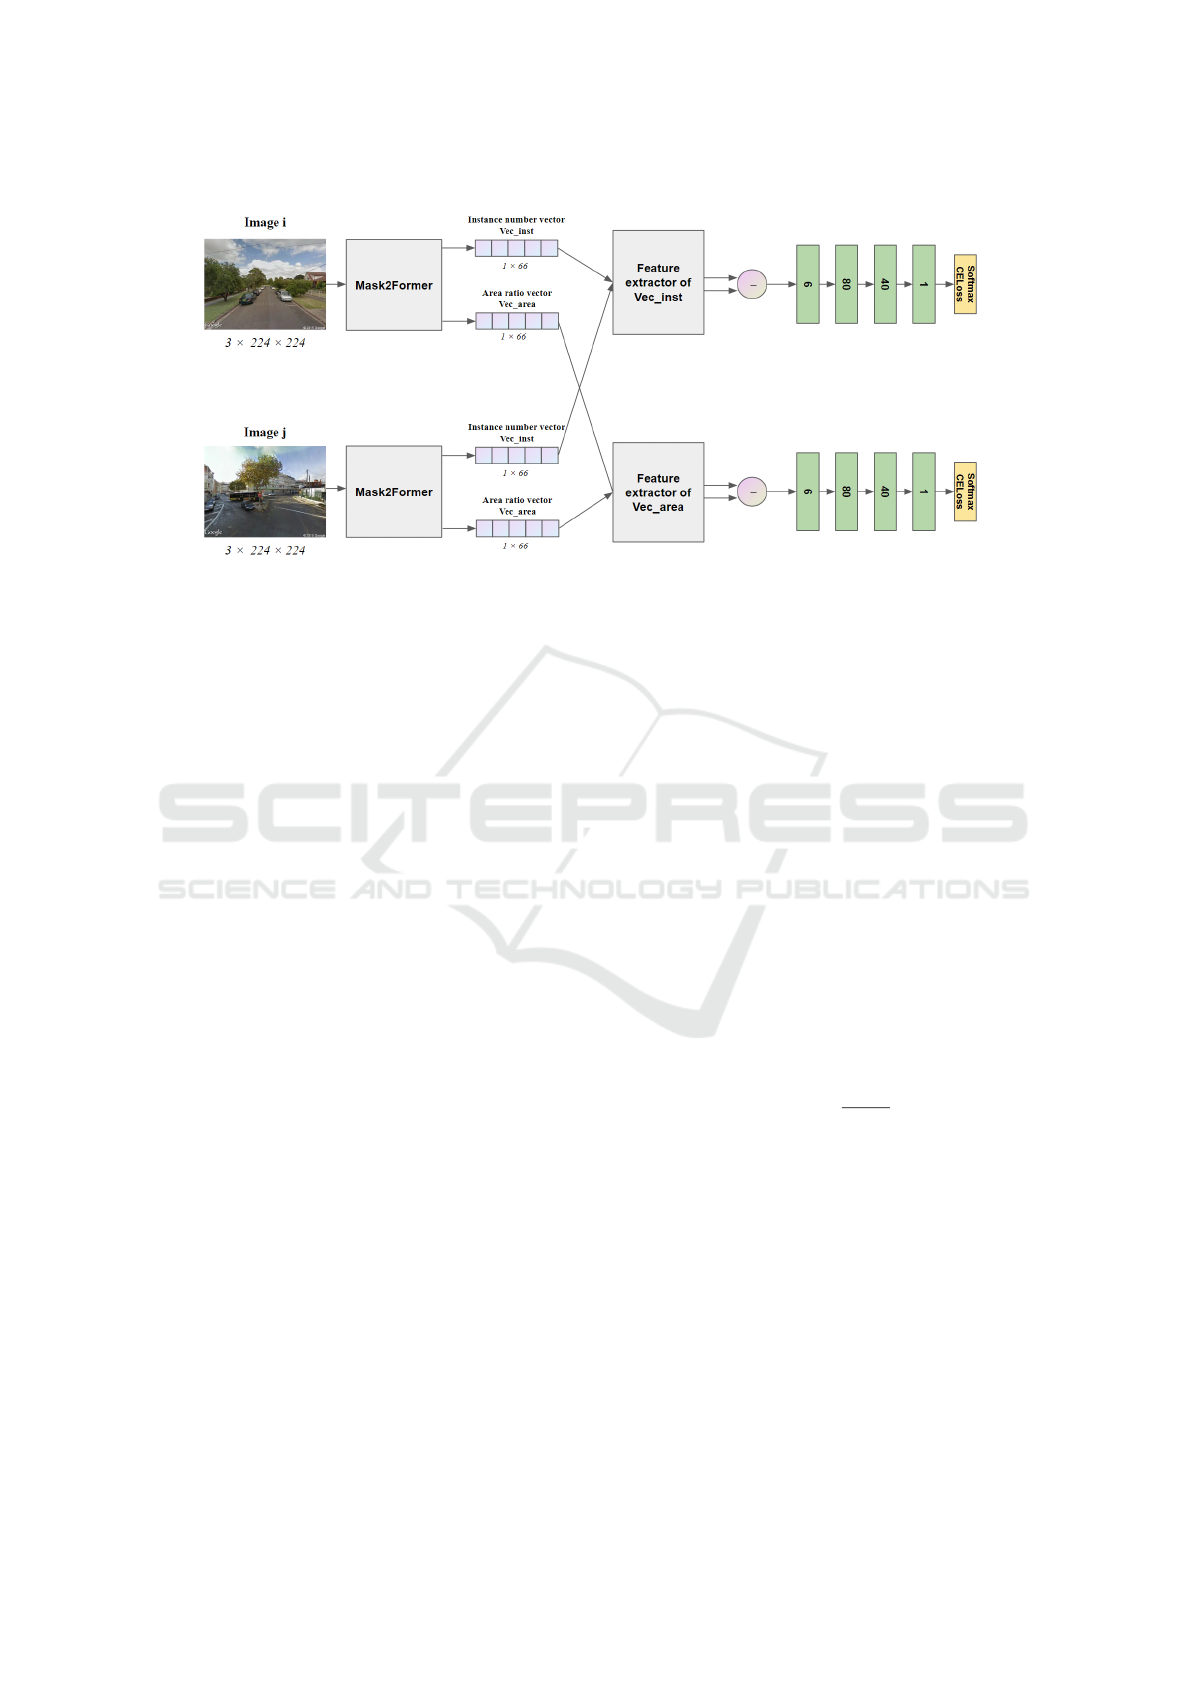
Figure 2: Architecture of proposed SS-NN.
Given an input image, the model is able to predict
a category or instance label for each pixel. It has
reached a panoptic quality score of 45.5 in classifying
66 object categories on Mapillary Vistas and has been
employed in this study.
3 APPROACH
Unlike traditional urban perception methods that use
only images as input for models’ learning, we pro-
pose to take the semantic information extracted from
panoptic segmentation scene as the only input to per-
form the urban scene analysis based on human per-
ception. The process is decoupled into two steps:
segmentation prediction and comparison prediction.
First, we apply Mask2Former on PP2 images to ob-
tain the panoptic segmentation results. Mask2Former
was chosen because it outperforms a significant mar-
gin on Mapillary Vistas. The images are partitioned
into multiple segments belonging to 66 categories:
car, person, sky, road, void, etc. Then the statistics
of the number of instances and pixels owned by each
category in each image will be recorded as the seg-
mentation result. Second, the segmentation result is
fed into neural network models, which predict the re-
sults of pairwise comparisons on the six attributes. An
overview of our network architecture is shown in Fig-
ure 2. In addition, we also test some classical machine
learning models on only the attribute of safety using
simplified inputs to explore the effectiveness of the
semantic information on different models.
3.1 Segmentation Prediction
PP2 images go through a standard pre-processing
pipeline used by the baseline network (Dubey et al.,
2016), including rescaling, center cropping, and nor-
malization. Subsequently, the pre-processed 224 ×
224 pixels images are fed into the panoptic segmen-
tation network Mask2Former, which has been trained
on the Mapillary Vistas dataset, to parse each PP2 im-
age and extract the feature vectors of urban physical
appearance, shown in Figure 3. The feature vectors
contain quantitative information about the number of
instances and pixel areas possessed by each object
category in the panoramic segmentation scene. We
define index k as the k − th of the 66 object cate-
gories in image I. In this way, the φ
inst
k
represents
the number of instances belonging to the k − th cate-
gory. Similar to (Ji et al., 2021; Zhang et al., 2018a),
φ
area
k
represents the areal proportion of k − th cate-
gory. Formally,
φ
area
k
=
pixel
k
pixel
I
(1)
where pix el
k
is the number of pixels of k − th cate-
gory, pixel
I
is the total number of pixels of the image
I. Consequently, for the image I, the area ratio vector
Vec
area
can be represented by a vector consisting of
φ
area
of all categories. Formally,
Vec
area
= [φ
area
1
, ..., φ
area
66
] (2)
Similarly, the instance number vector Vec
inst
can be
described as
Vec
inst
= [φ
inst
1
, ..., φ
inst
66
] (3)
Evaluation of Urban Perception Using Only Image Segmentation Features
203
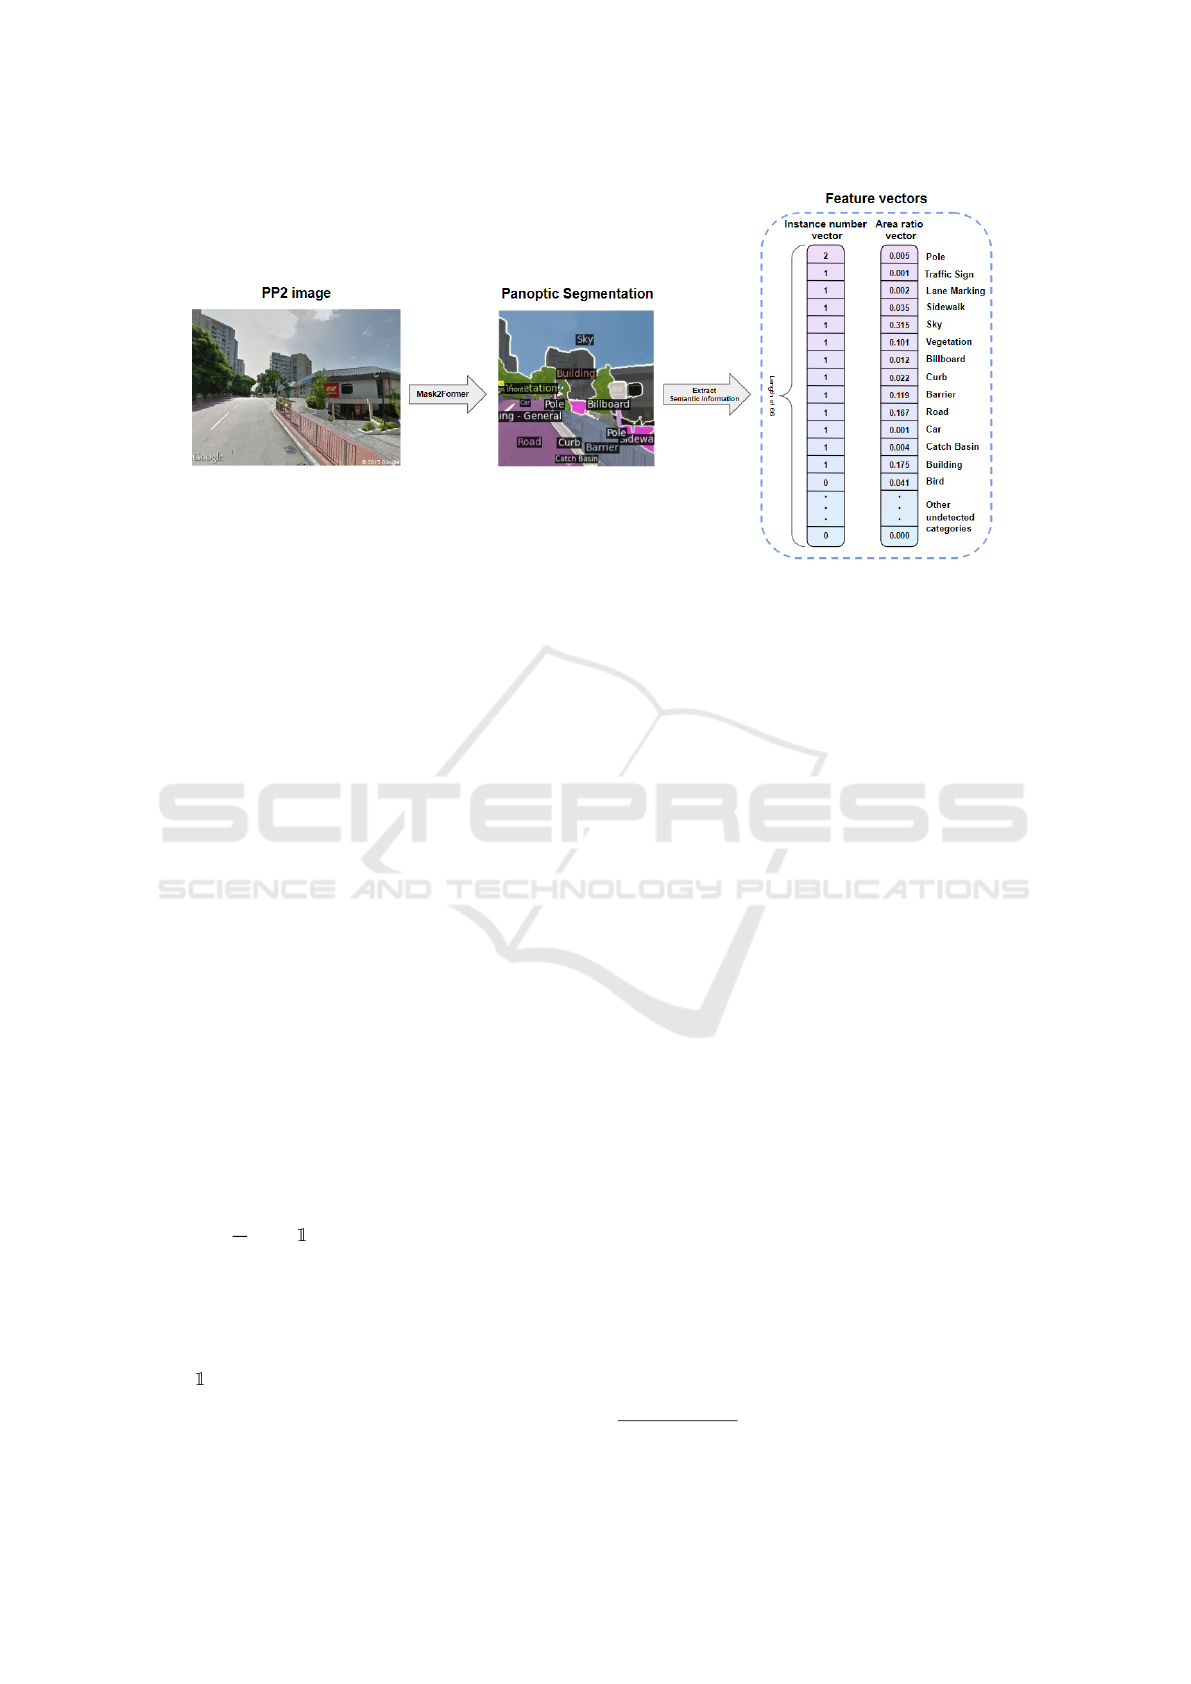
Figure 3: Extraction of the feature vectors. The PP2 image is fed into Mask2Former which outputs the panoptic segmentation
image and semantic information of each category, including the number of instances and the area ratio. 14 of the 66 semantic
categories are detected in this image. For the rest undetected categories, their number of instances and the area ratio are 0.
3.2 Comparison Prediction
We refer to Streetscore Convolutional Neural Net-
work (Dubey et al., 2016) to create our Streetscore
Neural Network (SS-NN), which can predict the win-
ning image from a pair of images by using the feature
vectors. For one image pair, the feature vectors of the
left and right images first pass a feature extractor con-
sisting of three linear layers, with a nonlinear relation-
ship between the layers through the RELU function.
The layers are composed of pairs of input and output
sizes (66, 80), (80, 40), (40, 6). Applying the same
feature extractor to both the left and right images aims
at finding similar dimensionality-reduced features for
the pair. Afterward, we make an elementwise dif-
ference between the obtained outputs, thus fusion the
two outputs into one. The following learning network
is also a three-linear layer structure with RELU func-
tion. The setting of layers is (6, 80), (80, 40), (40, 1).
We train SS-NN for pair classification using the stan-
dard softmax with stochastic gradient descent. The
softmax loss is specified as follows:
L
c
= −
1
N
N
∑
n
K
∑
k
{y = k}log(g
k
(Vec
i
, Vec
j
)) (4)
where L
c
is the loss, and N is the batch size. Vec
i
, Vec
j
denotes the feature vector extracted from the left and
right images. K = 2 means that there are two voting
options, left and right. y is the label of each compar-
ison. takes 1 when y belongs to category k; other-
wise takes 0. g is the softmax of final layer activation.
4 EXPERIMENTS
We evaluate our model performance using the PP2
dataset containing 1,343,004 pairwise comparisons
(PC). The details of the dataset are shown in Table 1.
Our SS-NN is trained with a batch size of 48 and an
initial learning rate of 0.001. The code is available
2
.
4.1 SS-NN Model
The performance of the SS-NN model is evaluated
with a standard accuracy. The average prediction ac-
curacy on the six attributes is shown in Table 2. For
instance number vector and area ratio vector, the aver-
age accuracy reaches 60.2% and 62.4%, respectively.
The performance of the SS-NN model with the fea-
ture vectors as input is slightly lower than the base-
line RSS-CNN, which achieved an accuracy of 68%.
In addition, compared to SS-CNN’s 23,576,641 pa-
rameters, our SS-NN model has only 12,687 parame-
ters. This lightweight model dramatically reduces the
learning burden.
4.2 Machine Learning Models
Given the good performance of area ratio vectors on
neural networks, we continue to explore their poten-
tial to be applied to different machine learning meth-
ods that are more stable and better interpreted. To
further compress the data while retaining useful in-
formation, we selected only the top 14 object classes
2
See https://github.com/LiXinyi9812/DLonPP2.git
GISTAM 2023 - 9th International Conference on Geographical Information Systems Theory, Applications and Management
204
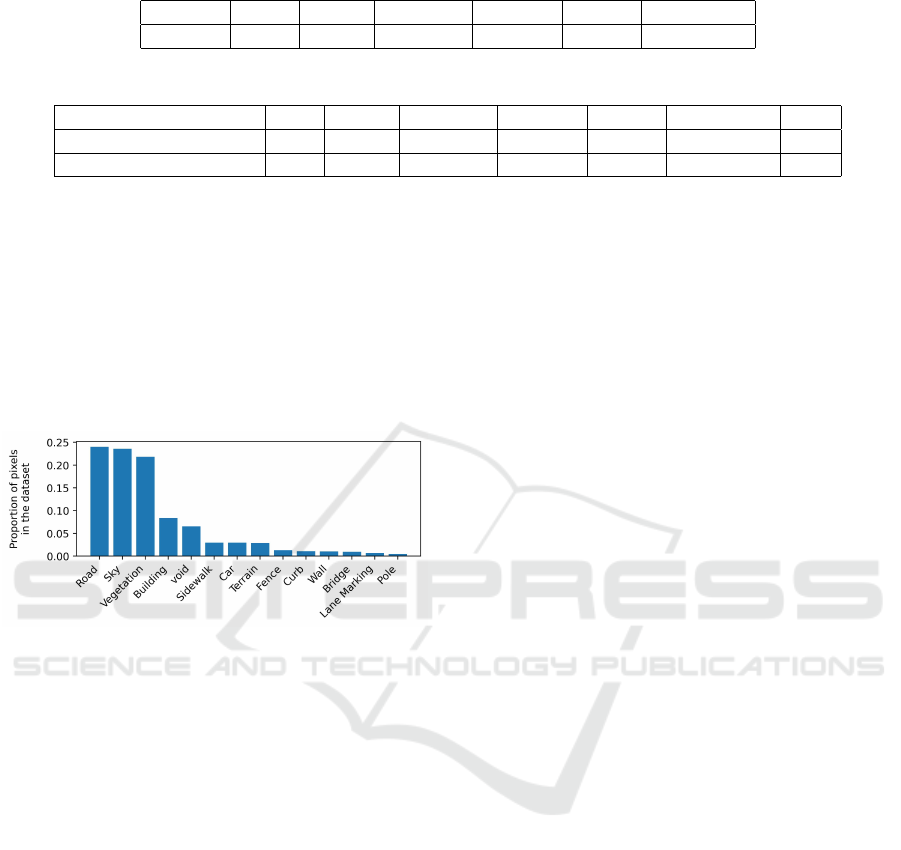
Table 1: The percentage of PC belonging to six attributes of the total PC count (%).
Safe Lively Beautiful Wealthy Boring Depressing
PC ratio 32.82 23.75 14.11 11.15 9.25 8.92
Table 2: The accuracy of SS-NN using feature vector inputs (%).
Safe Lively Beautiful Wealthy Boring Depressing Avg.
Instance number vector 59.6 62.3 59.8 59.7 62.0 57.6 60.2
Area ratio vector 61.9 62.4 62.9 62.0 62.0 63.0 62.4
with a high ratio of pixels over the whole dataset:
void, curb, fence, wall, road, sidewalk, bridge, build-
ing, lane marking - general, sky, terrain, vegetation,
pole, and car. The distribution of the ratio of the pix-
els is shown in Figure 4. For example, about 24% of
the pixels in the dataset belong to the road. After this
step, the amount of data in the area ratio vector has
been reduced, and the feature vectors are standard-
ized.
Figure 4: The distribution of the top-14 semantic categories
in the dataset (98.4% of the pixels).
We choose the task ”which image looks safer”,
and take the simplified area ratio vector as input to
four popular machine learning models with good gen-
eralization ability: Linear Regression, Support Vector
Machine (SVM), Random Forest, and eXtreme Gra-
dient Boosting (XGBoost). The obtained prediction
accuracy is shown in Table 3. All the machine learn-
ing models perform as well as the above deep learn-
ing model, resulting in an accuracy between 60% and
63%.
5 DISCUSSION
5.1 The Effectiveness of Feature Vectors
In this paper, we show that the feature vectors ex-
tracted from the panoptic segmentation scene achieve
acceptable performance to predict the perception of
urban space, compared to models with images as in-
puts. The feature vectors do not contain any spatial in-
formation and are highly compressed. Nevertheless,
the obtained results are close to the ones obtained by
larger models with images and convolutions. A pos-
sible explanation is that the feature vectors are funda-
mental components of some complex and valid met-
rics that impact urban perception, such as salient re-
gion saturation, visual entropy, green view index, and
sky-openness index (Cheng et al., 2017). The predic-
tion network simulates the computation of these com-
plex urban perception metrics and combines them to
give a comprehensive perception of the city. For in-
stance, the area ratio of the vegetation category can
be used to calculate the green view index related to
aesthetics and living comfort, and the traffic light and
building categories together reflect the imageability
(Ma et al., 2021) in terms of the richness of space.
One noticeable result is that our SS-NN models
have consistent performance across the six perceptual
qualities, while the performance of the baseline model
(Dubey et al., 2016) varies depending on the amount
of data available for a given perceptual quality. The
baseline gives a minimum of 62% for the depressing
quality with the least amount of data, and a maximum
of 73% for the safe quality with the largest amount
of data. In contrast, our model performs almost iden-
tically in predicting the sense of depressing and safe
qualities, despite a nearly fourfold difference in the
amount of data. The range of the baseline’s predic-
tion accuracy is 9%, while the range of our model
is 5% using instance number vector and 2% using
area ratio vector. This indicates that our method is
robust to variations in dataset size compared to the
baseline. The possible benefit for urban perception
studies could be that our model is able to obtain ac-
ceptable prediction results when introducing new per-
ceptual qualities, even if a small amount of data is
collected. This assumption might be demonstrated in
future studies.
After being further compressed, the feature vec-
tors reduced from 66 to the top-14 categories do not
show a significant performance improvement or de-
cline. The streamlined feature vectors still provide
sufficient learning information and further reduce the
learning burden of the models.
Evaluation of Urban Perception Using Only Image Segmentation Features
205
Table 3: The prediction accuracy of machine learning models on the safety attribute (%).
Linear Regression SVM Random Forest XGBoost
Area ratio vector 60.5 62.1 61.5 62.3
5.2 Experiment Limitations
The first step of this work is to extract 66 common
categories of objects by Mask2Former. Nevertheless,
the 66 categories are not comprehensive because they
may not include all the objects that have an essential
influence on the perception process, such as the visual
elements prisons and palaces reported by (Xu et al.,
2019).
5.3 Further Applications in Urban
Planning
Predicting people’s subjective perceptions of urban
space by deep/machine learning models via trans-
formed non-visual features offers a new method for
urban planning. Our approach could help assess and
guide city construction by providing valuable ref-
erences and instructions for urban planners. Un-
like most urban perception models, which are post-
evaluation models and can only assess existing street-
view images, our model can serve as an ex-ante eval-
uation model, allowing the use of simple non-visual
numerical data to predict how residents will perceive
the planned environment. For example, the number
of instances of buildings, poles, and other objects, or
the objects’ estimated spatial occupation ratio in the
urban planning scheme, can be converted to the pro-
posed features vector as input to predict whether the
planned space will bring a good sense to residents. In
addition, as the foundation of automatic urban percep-
tion, street-view services face severe privacy violation
accusations in some countries (Flores and Belongie,
2010), making it problematic to use the images of
these areas as input to our models. Our proposed ap-
proach provides a way to circumvent this problem.
The segmentation processing of street-view imagery
automatically removes all visual components, mak-
ing our approach free from privacy arguments and al-
lowing future users to assess urban perception without
any privacy concerns.
6 CONCLUSION AND FURTHER
WORKS
This work shows that the non-visual semantic infor-
mation extracted from urban landscape panoptic seg-
mentation scenes could be solely used for urban per-
ception. Our proposed segmentation feature vector al-
lows deep/machine learning models to obtain accept-
able results with less computational effort. To justify
its effectiveness, we show the average prediction ac-
curacy of our neural network and classical machine
learning models, with results ranging from 60% to
62%. Compared to the baseline result of 68%, our
results are acceptable. Further work should be done
to verify that learning with semantic information can
achieve a predictive performance comparable to im-
age analysis methods. Some visualization techniques
such as class activation map can be used in traditional
image-input urban perception models, to locate the
high-response regions that affect the prediction, and
to explore whether there is a correspondence between
the most influential image regions and the elements
contained in our semantic feature vectors. Other fu-
ture work will apply the machine learning models to
assess the other five urban perceptual attributes by
taking feature vectors as input. Besides, explore the
relationship between the semantic categories and ur-
ban perception results to explain the validity of this
novel data format. While the traditional methods that
use deep convolutional neural networks with images
as input have poor interpretability in urban perception
tasks, the machine learning models such as Random
Forests have better interpretability, allowing a clearer
presentation of the relationship between the objects in
images and the sense of urban space. Other valuable
insights could also be learned by performing an in-
depth comparison of the models’ predictions to iden-
tify the shortcomings of the machine learning mod-
els with feature vectors compared to the deep learning
models with images.
ACKNOWLEDGEMENTS
This work was funded by Centrale Nantes and RFI
Atlanstic. We thank the Centrale Nantes Super-
computing Centre for providing the HPC resource
throughout the project.
REFERENCES
Azma, S. and Katanchi, R. (2017). The effect of landscap-
ing and building facades on perceptual-behavioral fea-
tures of citizens. Journal of History Culture and Art
Research, 6(3):264–281.
GISTAM 2023 - 9th International Conference on Geographical Information Systems Theory, Applications and Management
206

Caruana, R. (1997). Multitask learning. Machine learning,
28(1):41–75.
Cheng, B., Misra, I., Schwing, A. G., Kirillov, A., and Gird-
har, R. (2022). Masked-attention mask transformer for
universal image segmentation. In Proceedings of the
IEEE/CVF Conference on Computer Vision and Pat-
tern Recognition, pages 1290–1299.
Cheng, L., Chu, S., Zong, W., Li, S., Wu, J., and Li, M.
(2017). Use of tencent street view imagery for visual
perception of streets. ISPRS International Journal of
Geo-Information, 6(9):265.
Cohen, D. A., Mason, K., Bedimo, A., Scribner, R., Basolo,
V., and Farley, T. A. (2003). Neighborhood physi-
cal conditions and health. American journal of public
health, 93(3):467–471.
Dubey, A., Naik, N., Parikh, D., Raskar, R., and Hidalgo,
C. A. (2016). Deep learning the city: Quantifying ur-
ban perception at a global scale. In European confer-
ence on computer vision, pages 196–212. Springer.
Flores, A. and Belongie, S. (2010). Removing pedestrians
from google street view images. In 2010 IEEE Com-
puter Society Conference on Computer Vision and
Pattern Recognition-Workshops, pages 53–58. IEEE.
Guan, W., Chen, Z., Feng, F., Liu, W., and Nie, L. (2021).
Urban perception: Sensing cities via a deep interactive
multi-task learning framework. ACM Transactions on
Multimedia Computing, Communications, and Appli-
cations (TOMM), 17(1s):1–20.
Ji, H., Qing, L., Han, L., Wang, Z., Cheng, Y., and Peng, Y.
(2021). A new data-enabled intelligence framework
for evaluating urban space perception. ISPRS Interna-
tional Journal of Geo-Information, 10(6):400.
Kelling, G. L., Wilson, J. Q., et al. (1982). Broken windows.
Atlantic monthly, 249(3):29–38.
Kirillov, A., He, K., Girshick, R., Rother, C., and Dollar,
P. (2019). Panoptic segmentation. In Proceedings of
the IEEE/CVF Conference on Computer Vision and
Pattern Recognition (CVPR).
Li, X., Zhang, C., Li, W., Ricard, R., Meng, Q., and Zhang,
W. (2015). Assessing street-level urban greenery us-
ing google street view and a modified green view in-
dex. Urban Forestry & Urban Greening, 14(3):675–
685.
Li, Y., Zhang, C., Wang, C., and Cheng, Z. (2021). Human
perception evaluation system for urban streetscapes
based on computer vision algorithms with attention
mechanisms. Transactions in GIS.
Li, Z., Chen, Z., Zheng, W.-S., Oh, S., and Nguyen, K.
(2022). Ar-cnn: an attention ranking network for
learning urban perception. Science China Information
Sciences, 65(1):1–11.
Liu, M., Han, L., Xiong, S., Qing, L., Ji, H., and Peng,
Y. (2019). Large-scale street space quality evaluation
based on deep learning over street view image. In In-
ternational Conference on Image and Graphics, pages
690–701. Springer.
Ma, X., Ma, C., Wu, C., Xi, Y., Yang, R., Peng, N., Zhang,
C., and Ren, F. (2021). Measuring human percep-
tions of streetscapes to better inform urban renewal:
A perspective of scene semantic parsing. Cities,
110:103086.
Milam, A., Furr-Holden, C., and Leaf, P. (2010). Perceived
school and neighborhood safety, neighborhood vio-
lence and academic achievement in urban school chil-
dren. The Urban Review, 42(5):458–467.
Min, W., Mei, S., Liu, L., Wang, Y., and Jiang, S. (2019).
Multi-task deep relative attribute learning for visual
urban perception. IEEE Transactions on Image Pro-
cessing, 29:657–669.
Miranda, A. S., Fan, Z., Duarte, F., and Ratti, C. (2021).
Desirable streets: Using deviations in pedestrian tra-
jectories to measure the value of the built environ-
ment. Computers, Environment and Urban Systems,
86:101563.
Neuhold, G., Ollmann, T., Bul
`
o, S. R., and Kontschieder,
P. (2017). The mapillary vistas dataset for semantic
understanding of street scenes. In 2017 IEEE Interna-
tional Conference on Computer Vision (ICCV), pages
5000–5009.
Rundle, A. G., Bader, M. D., Richards, C. A., Neckerman,
K. M., and Teitler, J. O. (2011). Using google street
view to audit neighborhood environments. American
journal of preventive medicine, 40(1):94–100.
Sampson, R. J. and Raudenbush, S. W. (1999). System-
atic social observation of public spaces: A new look
at disorder in urban neighborhoods. American journal
of sociology, 105(3):603–651.
Vaswani, A., Shazeer, N., Parmar, N., Uszkoreit, J., Jones,
L., Gomez, A. N., Kaiser, Ł., and Polosukhin, I.
(2017). Attention is all you need. Advances in neural
information processing systems, 30.
Wei, J., Yue, W., Li, M., and Gao, J. (2022). Mapping hu-
man perception of urban landscape from street-view
images: A deep-learning approach. International
Journal of Applied Earth Observation and Geoinfor-
mation, 112:102886.
Xu, Y., Yang, Q., Cui, C., Shi, C., Song, G., Han, X., and
Yin, Y. (2019). Visual urban perception with deep
semantic-aware network. In International Conference
on Multimedia Modeling, pages 28–40. Springer.
Zhang, F., Hu, M., Che, W., Lin, H., and Fang, C. (2018a).
Framework for virtual cognitive experiment in virtual
geographic environments. ISPRS International Jour-
nal of Geo-Information, 7(1):36.
Zhang, F., Zhou, B., Liu, L., Liu, Y., Fung, H. H., Lin, H.,
and Ratti, C. (2018b). Measuring human perceptions
of a large-scale urban region using machine learning.
Landscape and Urban Planning, 180:148–160.
Evaluation of Urban Perception Using Only Image Segmentation Features
207
