
Modeling & Simulating the Evacuation of a Building Based on
Building Floor Plan and Evacuation Strategies
Shreya and K.S. Rajan
Lab for Spatial Informatics, IIIT Hyderabad, Hyderabad, Telangana-500032, India
Keywords: Building Evacuation, Evacuation Strategies, Floor Plan, Path Planning.
Abstract: Accidental fires in public and large buildings not only cause property loss but also can lead to loss of lives.
During such emergencies, building evacuation depends on a range of factors including floor plans, exits
available, obstructions if any, the occupancy levels of the building, and so on. The study here brings together
the spatial, temporal, and path planning possibilities to evaluate fire evacuation strategies for 2D building
plans. It provides a geospatial framework to assess the impacts of dynamic changes in the building
environment and its impact on evacuation outcomes. In this study, occupancy-based path planning using
Pgrouting over an IndoorGML formatted data is combined with modeling their interactions over the path
toward the exit to assess the outcomes. This computational approach over the time-dependent path provides
interesting insights into determining the number of paths and the need for one or more exits during an
emergency. The study shows that integrating the floor plan into path generation and people flow can be a
powerful tool for assessing the building environment.
1 INTRODUCTION
Evacuation strategies are important in many
situations even in regions that may not be affected by
earthquakes or other natural causes. As urban areas
get more densely populated with multistoried
buildings that have many people either living or
working from these, it is important to evaluate the
evacuation strategies in these buildings. Engineers
and Architects need to demonstrate that their designs
of the building are safe for the residents. While they
may be also concerned that providing multiple exits
can affect their designs, a better understanding of
safety can help improve the designs suitably. On the
other hand, a geospatial model of the indoor floor
plans can help improve the understanding by not only
visualizing but allowing for multiple computational
models to be evaluated using geospatial models of the
evacuation paths. Indoor navigation paths have been
derived, in recent years, based on floor plans (Yang
and Worboys, 2015) and have also been extended to
data models like CityGML or IFC ((Kolbe et al.,
2005). While these approaches provide for a path
from say a room to the building exit, they are
generally independent static paths for each person
assuming no crowding or delay in movement when
all the occupants rush to the exit in an emergency.
In an emergency, a path based on quantitative
measurements like distance, direction, and angles is
not of much use or can be rather difficult to
comprehend by people trying to move in a hurry. If
these spaces can be captured qualitatively and shared
as part of the evacuation path to the users, it might
make it easier for people movement and re-defining
the paths depending on the changing environment in
the building. A semantic indoor space model
proposed in (Maheshwari and Rajan, 2016) based on
combining the ontology for indoor spaces with
geometric and semantic characteristics of the space,
as defined in (Maheshwari et al., 2019), can be
combined with the path generation approach to
provide for a more informative and comprehendible
path, that can be used by all residents of such
buildings. An attempt at using semantic information
in indoor path planning is presented in (Xiong et al.,
2015) by combining both geometric and semantic
information of building components.
Path planning in indoor spaces has been studied
based on shortest path (Ramón et al., 2013; Botsis and
Panagiotopoulos, 2021; Clementini and Pagliaro,
2020) algorithms like Dijkstra’s and Bellman-Ford’s
algorithms. While these shortest path algorithms
230
Shreya, . and Rajan, K.
Modeling Simulating the Evacuation of a Building Based on Building Floor Plan and Evacuation Strategies.
DOI: 10.5220/0011992600003473
In Proceedings of the 9th International Conference on Geographical Information Systems Theory, Applications and Management (GISTAM 2023), pages 230-236
ISBN: 978-989-758-649-1; ISSN: 2184-500X
Copyright
c
2023 by SCITEPRESS – Science and Technology Publications, Lda. Under CC license (CC BY-NC-ND 4.0)

provide a good idea of the nearest exit, the optimality
was considered based on different criteria like least
risk (Mirahadi and McCabe, 2019), the best-known
path to the evacuee from among paths to multiple
exits (Liu et al., 2016) in a building. Geospatial
technology with the computational algorithms to
develop and verify whether a building satisfies the
emergency regulations is presented in (Ramón et al.,
2013). Indoor navigation approaches, as in (Mortari
et al., 2014) use displacement techniques to generate
routes and may be extendable for evacuation purposes
as they do contain topological information. Paper
(Sun and Liu, 2011) introduced a continuous
framework that talks about both structure and
topology, using a grid graph–based modeling for path
planning.
On the other hand, the availability of BIM models
of the buildings has led to exploring these datasets for
indoor path generation automatically based on
straight skeletons (Fu and Liu, 2019) or generating a
geometric topology network from the building spaces
and spatial connections as represented in an IFC file
(Taneja et al., 2011). In (Yenumula et al., 2015), they
used the BIM-based signage information to indicate
the exits that can be accessible during fires by
assessing the effect of smoke on the visibility of the
signages, while (Liu and Zlatanova, 2011) presents a
door-to-door approach and (Ma et al., 2017) talks of
using BIM over a schematic based evacuation plan
for the floors.
While all these studies do work on different
aspects of evacuation paths, their computation, and
representation, these are mostly static paths and do
not consider the changes in the indoor environment
like whether the exits are useable or reachable from a
given location in the building. This needs to be
evaluated as heavily crowded or occupied buildings
may need multiple exits for evacuation of the
residents in the shortest time. Also, the changes can
affect the evacuation models by affecting the time
along the path considering lags in people flow and
capacity of the paths in addition to the availability of
additional exits if any. This paper attempts to address
some of these issues in the generation of the optimal
path for evacuation for each occupant of the building
for a given 2D floor plan considering that the graph
network connecting these spaces may change in
adverse conditions.
1.1 Objective
In this study, an attempt has been made to integrate the
inputs from the floor plan generated network with an
option of new exits emerging in addition to the main
exits as part of an evacuation strategy to assess –
a) How the capacity of the path links or edges
can delay the evacuation time based on the
people’s movement pattern
b) How to determine if an evacuee will use an
alternative new emerging exit like a window
This paper assumes the availability of a space
model from IndoorGML, whose description is out of
the scope of this paper and develops on the possible
evacuation networks that emerge from such data.
2 METHODOLOGY
Figure 1: An overview of the methodology and its
components.
2.1 Building Plan for Node Generation
A building floor plan in Autodesk Revit Architecture
software is created with attribute information such as
door windows. The structural element of the building
contains six spaces denoted as a room, twelve
windows, and seven doors including one main exit.
All the rooms are accessible from one space to
another. This building plan, originally in DXF file
format, was imported into QGIS. This DXF file was
preprocessed in terms of topological consistency so
that it has the right number of polygon geometries,
location of doors, windows, etc. The building floor
plan was adjusted in QGIS according to the
coordinate reference system so that it lies on the same
plan of projection. Nodes were generated at the
centroid of the room, representative points for the
occupants of the room, and door center points for
each room space. In addition, to account for more
than one exit from the building, including emergency
or alternate exits like a window, the final destination
for the simulations is a node called the Evacuation
point away from the Building that is reachable from
Modeling Simulating the Evacuation of a Building Based on Building Floor Plan and Evacuation Strategies
231

all the exits, as shown in figure 3. These nodes are
further used for graph generation.
2.2 Primary Graph Network
The generated nodes are identified as the potential
sources, intermediate nodes, and destination nodes
such as main exits and windows as alternate exits.
The graph is then generated using the source and
destination pair of coordinates assigned to form the
primary network layer. The generated graph network
G can be seen in figure 3. Each path link is
characterized by its actual edge length and used in
calculating the path edge capacity.
2.3 Occupancy and Path Edge
Capacity
As the approach here is to estimate the impact on the
people flow movement in the context of an
emergency, it is assumed that the spaces (or rooms)
are fully occupied to their maximum capacity. Hence,
the occupancy of each space is estimated based on the
unit area needed per person. For the path edge
capacity, an average speed of 6 kmph is assumed per
person to account for the movement behavior during
evacuations. This allows for computing each
occupant’s travel time to the exit and hence
estimating the last man’s exit time. While the case of
emerging exits is like a window, a hold time is also
added to the link concerned to account for the delays
in accessing such exits. The proposed approach also
allows for a pass-through capacity to be added at the
specific nodes for estimating the rate of flow of
people.
2.4 Evacuation Path Generation
2.4.1 Shortest Path for the Base Scenario
In this study, a base scenario is defined as one that has
no obstruction and allows for the free movement of
people through the paths. This is possible from all the
structural elements such as doors and windows. Path
computation for the shortest path calculation to the
main exit is obtained using the Pgrouting module in
PostgreSQL. Here, the room spaces are considered
source nodes and the doors or windows on the
building periphery as the exits. Using the Dijkstra
algorithm, all potential shortest paths for each source-
destination combination are obtained, denoted by set
P. Each path, ( P
i,k
ε P ) denotes the i paths available
to each user or individual k. The shortest path for a
given user k is P
mk,
where m ε i, denotes the final path
chosen.
2.4.2 Evacuation Path for the Adverse
Scenario
In case of an emergency, the shortest path computed
in the earlier sub-section may be not available to the
user. Here, we consider that an untoward incident like
fire or another emerging condition can lead to a node
or an edge blockage. While the later disconnects only
the path that consists of the blocked edge, an affected
node disconnects all the edges that are connected to
it, as shown in figure 2. In this paper, the case of node
blockage is considered as the edge case can be a
special case of the same. The set P* is the updated
available set under changed circumstances. An agent-
based approach is used to evaluate the options from
the set P* and decide on the optimal path to take
considering the existing and alternate exits available
and the parameters computed earlier for the graph and
its link edges including lag due to link capacity. The
agent aims to minimize the time taken to the final exit
point.
Figure 2: Affected node and edge.
3 DATA
3.1 Floor Plan
A building floor plan covering a total carpet area of
102.349 m
2
as shown in Figure 3 is used for this
study. The building floor plan was converted to
shapefile format from DXF. It consists of six rooms,
six internal doors, one external main exit, and twelve
windows which act as an alternate exit during the
adverse case. The exit door has the capacity to carry
two occupants at a time whereas the alternate exit has
the capacity of one occupant at a time. In this study,
the number of spaces is taken as rooms denoted by its
centroids as the source points. Figure 3 shows the
floor plan followed by notations such as nodes that
are used for source and destination input, evacuation
point, the evaluation or safe point for evacuees to
reach, and the generated graph network. Network
graph notations are described in section 4.1.
Affected node
Affected Edge
GISTAM 2023 - 9th International Conference on Geographical Information Systems Theory, Applications and Management
232
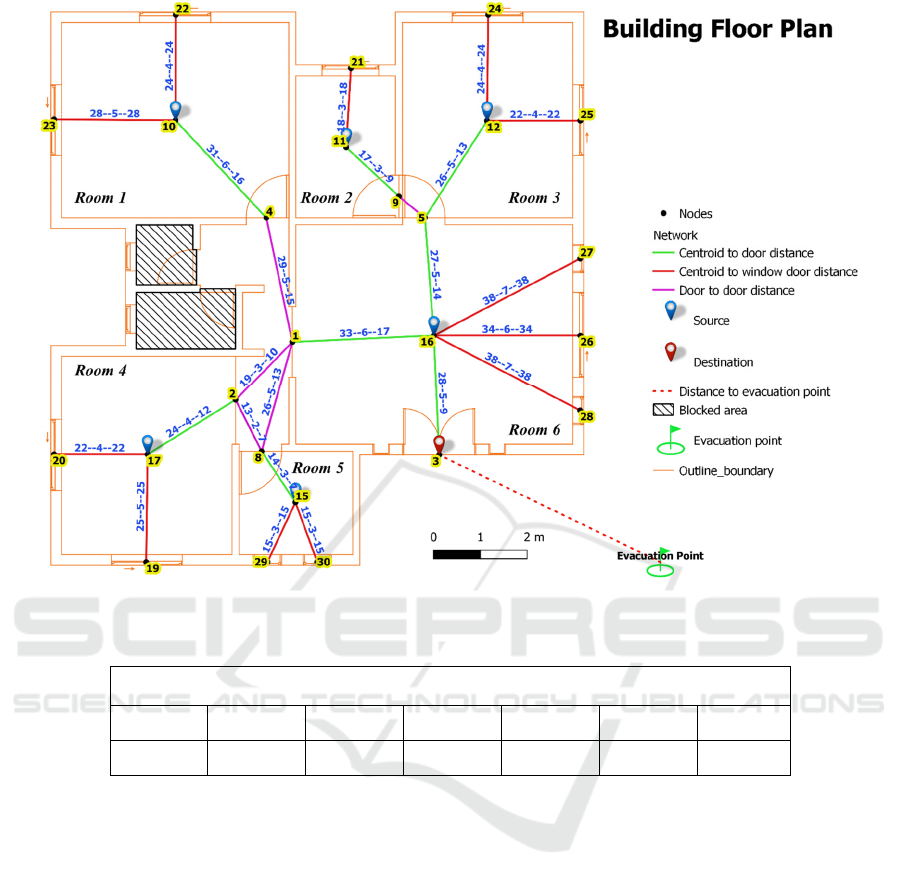
Figure. 3: Building Structural Plan.
Table 1: Occupancy count of room.
Number of occupants based on the floor Space Model
Room 1 Room 2 Room 3 Room 4 Room 5 Room 6 Total
20 6 15 15 5 28 89
3.2 Occupancy
The occupancy is derived from the area of the room
space, as the model is evaluated for a worst-case
scenario of maximum occupancy. Table 1 shows the
occupancy in each space. There is no occupancy in
the corridor and the shaded room. It has to be noted
that occupancy is a key parameter here, and if it is less
than the capacity of the room it will affect the path
optimization and can lead to a different outcome.
4 RESULTS
4.1 Network Generation Including
Edge/Path Capacity
In figure 3, the line in different colors indicates the
generated graph. This graph accounts for the main
exit and the alternate exits and shows the shortest
paths only. Centroid-to-door distance is marked in
green, the centroid to the window is marked with red,
and the door-to-door distance is marked with purple.
These networks are assigned labels, indicating the
distance—time—capacity of the edge. The capacity of
an edge is proportional to the rate of people flow at
the exits. There are some limitations to people flow
based on the capacity - if the number of occupants is
greater than the least capacity edge of the path P
mk
then not all the occupants can be evacuated in the
shortest time shown.
4.2 Path Identification
Path identification is shown in figures 4 and 5 which
have some representative agents for every room and
are uniquely equal to the number of potential exits for
a given space. Agents can be broad of two types – a
Modeling Simulating the Evacuation of a Building Based on Building Floor Plan and Evacuation Strategies
233
normal agent who uses the known path (P
0
) to the
main exit only; and a special agent who uses one of
the alternate paths. These special agents are activated
when the traditional or known path (P
0
) is disturbed
and their behavior is dependent on the conditions.
There are multiple evacuation agents in each space.
Each agent uses the graph or sub-graph appropriately
for the choice of exit and the path to be followed.
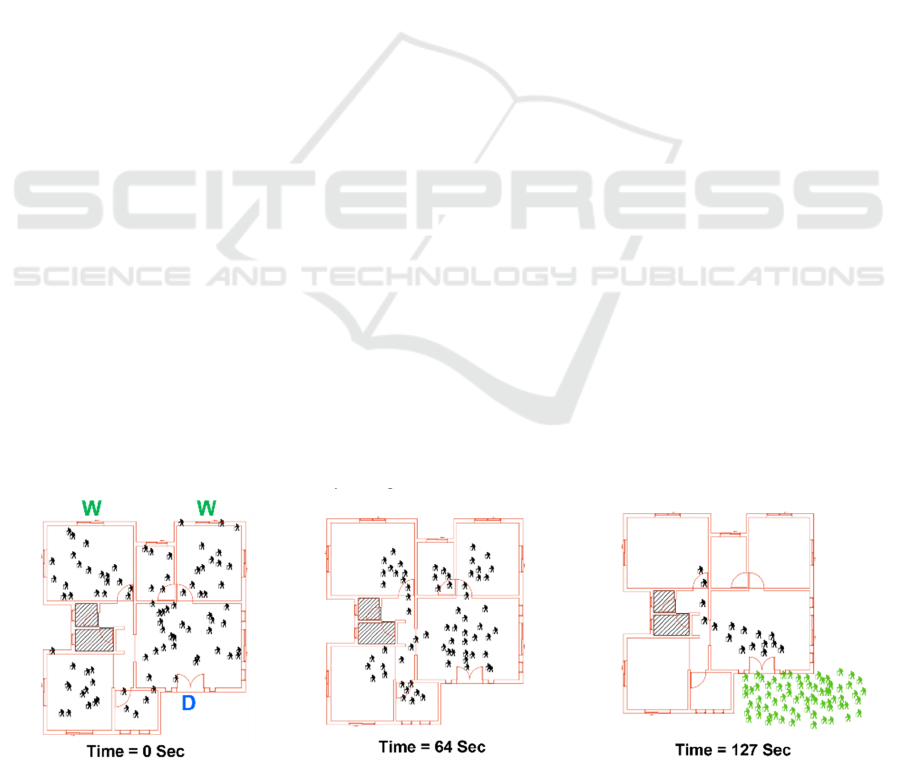
4.2.1 Base Scenario
The base case scenario is the free flow for exiting the
occupants with no blockage in between the path. For
example, room 1 has an occupancy of 20 and the
capacity of an edge-to-door is 16, which means that
the edge can hold only 16 occupants at a time hence
there will be a lag. If lag was not there, then it could
have been just the addition of all the time from source
to destination. If there was no lag it could have taken
only 22 seconds for an occupant to come out of the
main door instead of 254 seconds for the last position.
The base scenario is shown in figure 4 and the
evacuees are using the main exit as alternate exits will
take longer evacuation times.
4.2.2 Adverse Scenario
An adverse case scenario of fire in the building is
considered. The fire blocks the path to the exit and to
the evacuation point. The implemented scenario
shows the blockage at the most critical point, where
most of the edges are merging, representing the
worst-case scenario
.
For this scenario, as the node is
affected all the connected edges are dropped resulting
in multiple graphs being generated instead of one
main graph. In this case, there are four graphs
connecting alternate exits for room 1, room 4, and
room 5 along with one larger sub-graph for room 2,
room 3, and room 6 towards the main exit. The
alternate exits, and windows, are chosen by the agents
as these room spaces are disconnected from the
primary graph network. The evacuation time of the
last person was at 3195 seconds, comparatively quite
large from the base scenario. The movement of the
agents is depicted in figure 5.
4.2.3 Cumulative Count
In the base case scenario, evacuees took minimum
time for the exit as there is no lag or time delay for
opening/breaking exits, whereas in the adverse case,
scenario evacuees took maximum time due to time
delay/lag in breaking/opening the window and
coming out of it. Figure 5 shows cumulative count
graph results with a cascading effect that occurred
during the evacuation. The linearity of the graph
indicates that evacuees took minimum time for the
exit as there is minimal to no lag or time delay and the
non-linearity of the graph shows that evacuees took
maximum time due to time delay/lag in
breaking/opening the window while exiting.
5 CONCLUSION
The study proposed an effective methodology for the
evacuation modeling of the occupants based on the
changing paths to the exit based on a 2D structural
plan. Compared to the base scenario, the adverse
scenario took more than 12x times for evacuation of
the 89 occupants of this building. This indicates that
changed dynamics can have very different outcomes
and the provision of alternative exits with decent
capacity needs to be planned well. Also, it should be
noted that the capacity of the main exit and the access
time at the alternate exits affects the evacuation time
hence there is a need to evaluate these for different
cases and define the appropriate capacity of these
doors and windows. The use of an agent-based model
Base Case Scenario: No Fire Blockage
Figure 4: Base case scenario.
GISTAM 2023 - 9th International Conference on Geographical Information Systems Theory, Applications and Management
234
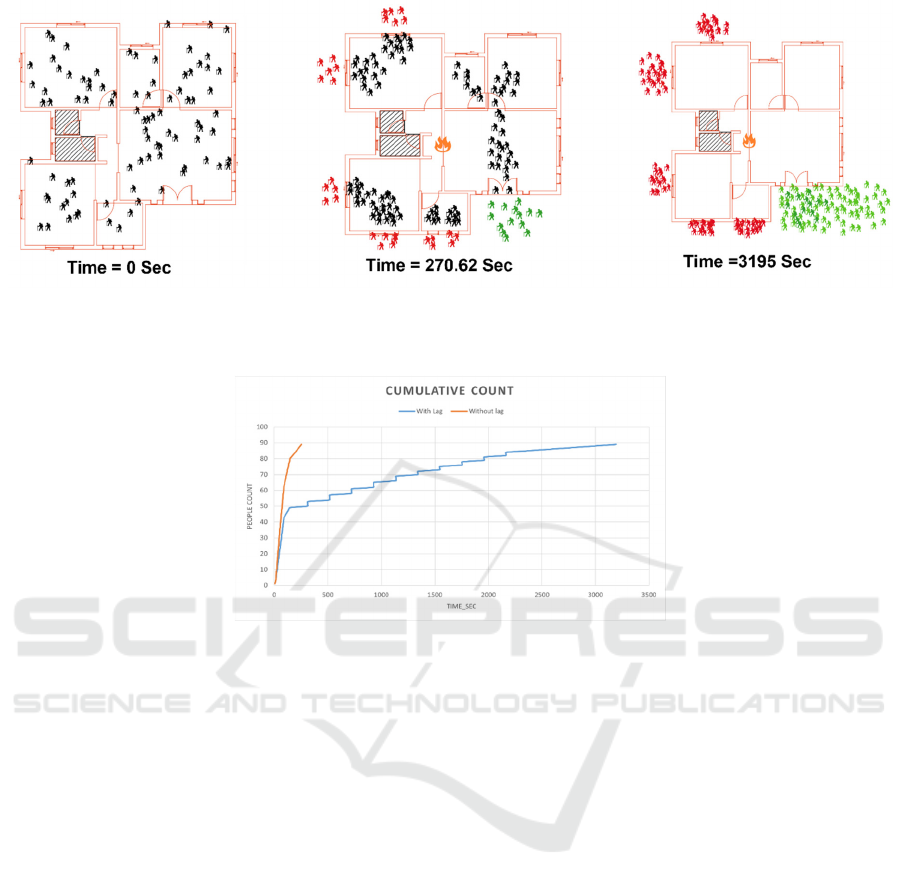
Adverse Case Scenario: Fire Blockage at a critical point
Figure 5: Adverse Case Scenario.
Figure 6: Graph: Cumulative Count.
to evaluate options provides for dynamic decision-
making in such situations or scenarios and adapts to
the changing graph networks. The adoption of a space
model fully can further help define the pass-through
spaces, occupied spaces, and their respective
constraints in a better way. Also, with the increasing
use of location sensors, it will be good to integrate
these models with a real-time people positional model
and crowding behavior to see how the scenarios will
evolve in varying ground conditions.
REFERENCES
N. Maheshwari, and K.S. Rajan., “A semantic model to
define indoor space in the context of an emergency
evacuation,” Int. Arch. Photogramm. Remote Sens.
Spat. Inf. Sci.—ISPRS Arch. 2016, 41, 313–318.
N. Maheshwari, S. Srivastava, and K.S. Rajan,
"Development of an Indoor Space Semantic Model and
Its Implementation as an IndoorGML Extension",
ISPRS International Journal of Geo-Information, vol. 8,
2019.
Ramón, A., Rodrıguez-Hidalgo, A. B., Navarro-Carrión, J.
T., & Zaragozı, B. (2013). A methodology for
evacuation route planning inside buildings using
geospatial technology. In Data Management and
Security. Applications in Medicine, Science, and
Engineering (Vol. 45, pp. 155-166). WIT Press.
Botsis, D., & Panagiotopoulos, E. (2021). Determination of
the shortest path in the university campus of Serres
using the Dijkstra and Bellman‐Ford algorithms.
ΧΩΡΟ-ΓΡΑΦΙΕΣ, 6(1).
Clementini, E., & Pagliaro, A. (2020). The Construction of
a Network for Indoor Navigation. In GISTAM (pp.
254-261).
Mirahadi, F., & McCabe, B. (2019). A real-time path-
planning model for building evacuations. In ISARC.
Proceedings of the International Symposium on
Automation and Robotics in Construction (Vol. 36, pp.
998-1004). IAARC Publications.
Liu, C., Mao, Z. L., & Fu, Z. M. (2016). Emergency
evacuation model and algorithm in the building with
several exits. Procedia Engineering, 135, 12-18.
Kolbe, T., Gröger, G., and Plümer, L. (2005). CityGML:
Interoperable access to 3D city models. In van Oost-
erom, P., Zlatanova, S., and Fendel, E., editors, Geo-
information for Disaster Management, pages 883–898,
Berlin, Heidelberg. Springer
Yang, L. and Worboys, M. (2015). Generation of
navigation graphs for indoor space. International
Journal of Geographical Information Science,
29(10):210–218
Modeling Simulating the Evacuation of a Building Based on Building Floor Plan and Evacuation Strategies
235

Mortari, F., Zlatanova, S., Liu, L., & Clementini, E. (2014).
" Improved Geometric Network Model"(IGNM): A
Novel Approach for Deriving Connectivity Graphs for
Indoor Navigation. ISPRS Annals of Photogrammetry,
Remote Sensing & Spatial Information Sciences, 2(4).
Sun, J., & Li, X. (2011, June). Indoor evacuation routes
planning with a grid graph-based model. In 2011 19th
International Conference on Geoinformatics (pp. 1-4).
IEEE.
Fu, M., & Liu, R. (2019). Automatic generation of path
networks for evacuation using building information
modeling. In Computing in Civil Engineering 2019:
Visualization, Information Modeling, and Simulation
(pp. 320-327). Reston, VA: American Society of Civil
Engineers.
Taneja, S., Akinci, B., Garrett, J. H., Soibelman, L., & East,
B. (2011). Transforming IFC-based building layout
information into a geometric topology network for
indoor navigation assistance. In Computing in Civil
Engineering (2011) (pp. 315-322).
Yenumula, K., Kolmer, C., Pan, J., & Su, X. (2015). BIM-
controlled signage system for building evacuation.
Procedia Engineering, 118, 284-289.
Liu, L., & Zlatanova, S. (2011). A" door-to-door" path-
finding approach for indoor navigation. Proceedings
Gi4DM 2011: GeoInformation for Disaster
Management, Antalya, Turkey, 3-8 May 2011.
Ma, J., Jia, W., & Zhang, J. (2017, May). Research of
building evacuation path to guide based on BIM. In
2017 29th Chinese Control And Decision Conference
(CCDC) (pp. 1814-1818). IEEE.
Xiong, Q., Zhu, Q., Zlatanova, S., Du, Z., Zhang, Y., &
Zeng, L. Y. (2015). Multi-level Indoor Path Planning
Method. International Archives of the
Photogrammetry, Remote Sensing & Spatial
Information Sciences.
GISTAM 2023 - 9th International Conference on Geographical Information Systems Theory, Applications and Management
236
