
Benchmarking Automated Machine Learning Methods for Price
Forecasting Applications
Horst Stühler
1 a
, Marc-André Zöller
2 b
, Dennis Klau
3 c
,
Alexandre Beiderwellen-Bedrikow
1 d
and Christian Tutschku
3 e
1
Zeppelin GmbH, Graf-Zeppelin-Platz 1, 85766 Garching, Germany
2
USU Software AG, Rüppurrer Str. 1, 76137 Karlsruhe, Germany
3
Fraunhofer IAO, Nobelstraße 12, 70569 Stuttgart, Germany
Keywords:
Construction Equipment, Price Forecasting, Machine Learning, ML, AutoML, CRISP-DM, Case Study.
Abstract:
Price forecasting for used construction equipment is a challenging task due to spatial and temporal price
fluctuations. It is thus of high interest to automate the forecasting process based on current market data. Even
though applying machine learning (ML) to these data represents a promising approach to predict the residual
value of certain tools, it is hard to implement for small and medium-sized enterprises due to their insufficient
ML expertise. To this end, we demonstrate the possibility of substituting manually created ML pipelines with
automated machine learning (AutoML) solutions, which automatically generate the underlying pipelines. We
combine AutoML methods with the domain knowledge of the companies. Based on the CRISP-DM process,
we split the manual ML pipeline into a machine learning and non-machine learning part. To take all complex
industrial requirements into account and to demonstrate the applicability of our new approach, we designed
a novel metric named method evaluation score, which incorporates the most important technical and non-
technical metrics for quality and usability. Based on this metric, we show in a case study for the industrial use
case of price forecasting, that domain knowledge combined with AutoML can weaken the dependence on ML
experts for innovative small and medium-sized enterprises which are interested in conducting such solutions.
1 INTRODUCTION
Price forecasting is crucial for companies dealing
with used assets whose price depends on availabil-
ity and demand varying spatially and over time. Es-
pecially the sector of heavy construction equipment
dealers and rental companies relies heavily on accu-
rate price predictions. Determining the current and
future residual value of their fleet allows construc-
tion equipment dealers to identify the optimal time
to resell individual pieces of machinery (Lucko et al.,
2007; Chiteri, 2018). Although several data-driven
methods have been proposed to forecast the heavy
equipment’s residual value (Lucko, 2003; Lucko and
Vorster, 2004; Fan et al., 2008; Lucko, 2011; Zong,
a
https://orcid.org/0000-0002-7638-1861
b
https://orcid.org/0000-0001-8705-9862
c
https://orcid.org/0000-0003-3618-7359
d
https://orcid.org/0000-0001-7934-8410
e
https://orcid.org/0000-0003-0401-5333
2017; Miloševi
´
c et al., 2020), price forecasting in
practice is still mainly performed manually due to
the lack of sufficiently skilled employees. Conse-
quently, it is a time-consuming and inflexible process
that highly depends on the domain expertise of the
employees. Due to these substantial time, cost, and
knowledge factors, the manual process is generally
carried out irregularly and infrequently, maybe even
fragmentary. This may lead to partially outdated or
even obsolete prices, as current market price fluctu-
ations are not taken into account (Ponnaluru et al.,
2012). To reflect current market prices while support-
ing domain experts and digitalization of price predic-
tion in general, it is desirable to automate the forecast-
ing process and update the forecastings periodically.
Using machine learning (ML) methods to calcu-
late the residual value of construction equipment has
already been tested in the past (Zong, 2017; Chiteri,
2018; Miloševi
´
c et al., 2021; Shehadeh et al., 2021;
Alshboul et al., 2021). While the results of these
studies and general developments in the field of ML
30
StÃijhler, H., ZÃ˝uller, M., Klau, D., Beiderwellen-Bedrikow, A. and Tutschku, C.
Benchmarking Automated Machine Learning Methods for Price Forecasting Applications.
DOI: 10.5220/0012051400003541
In Proceedings of the 12th International Conference on Data Science, Technology and Applications (DATA 2023) , pages 30-39
ISBN: 978-989-758-664-4; ISSN: 2184-285X
Copyright
c
2023 by SCITEPRESS – Science and Technology Publications, Lda. Under CC license (CC BY-NC-ND 4.0)

are very promising, a substantial portion of the ex-
isting work originates from academic institutes, tech
companies, start-ups, or large international corpora-
tions. Meanwhile, small and medium-sized enter-
prises (SMEs), while accounting for 90% of all busi-
nesses (Ardic et al., 2011), are not represented. Even
though SMEs generate large amounts of data and have
significant domain knowledge, ML applications are
less common there. One of the main challenges for
these organizations is the lack of skilled employees
with ML knowledge (Bauer et al., 2020).
As an alternative to the manual creation of ML
models, automated machine learning (AutoML) has
been proposed in the last years (Hutter et al., 2019;
Yao et al., 2018; Zöller and Huber, 2021). AutoML
aims to reduce and partially automate the necessary
manual work carried out by humans when creating
ML solutions. It has already been proven to achieve
good performance with a significantly smaller degree
of human effort and a high computational efficiency
(Yao et al., 2018). This provides a possible solution
for SMEs to the severe shortage of professionals with
in-depth ML knowledge.
To evaluate this potential solution, we conduct a
case study in the context of used machinery valua-
tion. Using the well-established Cross Industry Stan-
dard Process for Data Mining (CRISP-DM) (Shearer,
2000), we divide the different steps of creating an ML
pipeline into a non-ML and an ML part. The non-ML
part can be executed by domain experts, while for the
ML part, we examine different AutoML frameworks
and compare them with the traditional, manual de-
velopment. The case study investigates if AutoML is
a viable alternative to manual ML methods and how
domain experts can fuel the ML process. To easily
assess our approach and create a general multimodal
assessment method, we introduce the novel method
evaluation score (MES), which incorporates different
application-based metrics into one single number.
The work is structured as follows: Section 2
presents related work. Section 3 describes the idea of
splitting the ML pipeline into a data domain and ML
phase, introduces the manual ML and AutoML meth-
ods, and describes the new MES. The main findings
are presented in Section 4 followed by a conclusion.
2 RELATED WORK
2.1 Automated Price Prediction for
Used Construction Machines
Several works have been published that use ML to
calculate the residual value of construction equip-
ment. (Zong, 2017) estimates the residual value of
used articulated trucks using various regression mod-
els. Similarly, (Chiteri, 2018) analyses the residual
value of
3
⁄
4
ton trucks based on historical data from
auctions and resale transactions. (Miloševi
´
c et al.,
2021) construct an ensemble model based on a di-
verse set of regression models to predict the resid-
ual value of 500 000 construction machines advertised
in the USA. (Shehadeh et al., 2021) and (Alshboul
et al., 2021) use various regression models to predict
the residual value of six different construction equip-
ment types based on data from open-accessed auction
databases and official reporting agencies.
While the results of these studies have shown first
ML successes, creating the proposed models requires
ML expertise. Our case study focuses on the potential
of AutoML and how SMEs with limited ML expertise
can benefit from automated approaches in the field.
2.2 Automated Machine Learning
AutoML aims to improve the current way of build-
ing ML applications manually via automation. While
ML experts can increase their efficiency by automat-
ing tedious tasks like hyperparameter optimization,
domain experts can be enabled to build ML pipelines
on their own without having to rely on a data scientist.
Currently, those systems mainly focus on supervised
learning tasks, e.g., tabular regression (Zöller et al.,
2021) or image classification (Zoph and Le, 2016).
From tuning the hyperparameters of a fixed model
over automatic ML model selection up to generat-
ing complete ML pipelines from a predefined search
space, AutoML mimics the way how humans grad-
ually approach ML challenges today. Virtually all
AutoML approaches formulate the automatic cre-
ation of an ML pipeline as a black-box optimization
problem that is solved iteratively (Zöller and Huber,
2021): potential model candidates are drawn from the
underlying search space, and the performance on the
given dataset is calculated. This procedure is repeated
until the optimization budget, usually, a maximum op-
timization duration, is depleted. Often this optimiza-
tion is implemented via Bayesian optimization (Fra-
zier, 2018), which utilizes a probabilistic surrogate
model, like a Gaussian process, to predict the perfor-
mance of untested pipeline candidates and steer the
optimization to better-performing regions.
2.3 CRISP-DM
Due to its widespread dissemination and acceptance
in data-driven development, CRISP-DM is often used
in the ML context, for example, to develop quality as-
Benchmarking Automated Machine Learning Methods for Price Forecasting Applications
31

Business
Understanding
Data
Understanding
Data
Preparation
Modeling Evaluation Deployment
Determine Business Objectives
Assess Situation
Determine Data Mining Goals
Produce Project Plan
Evaluate Results
Review Process
Determine Next Steps
Plan Deployment
Plan Monitoring and Maintenance
Produce Final Report
Review Project
Data Processing Phase ML Phase
Collect Initial Data
Describe Data
Explore Data
Verify Data Quality
Select Data
Clean Data
Construct Data
Integrate Data
Format Data
Select Modeling Tech.
Generate Test Design
Build Model
Assess Model
Level 1
Level 2 Level 3
Level 4
L. 5
L. 6
Figure 1: Adaptation of the CRISP-DM process neglecting the loop from the original process for visual simplicity. The data
understanding, preparation, and modeling steps are divided into a data processing and ML phase; individual steps are further
grouped into knowledge levels. Tasks within the data processing phase require basic programming and data processing skills
and highly benefit from domain expertise. In contrast, ML expert knowledge is mandatory for the steps within the ML phase.
surance methodologies (Studer et al., 2021) or to in-
vestigate the interpretability of machine learning so-
lutions (Kolyshkina and Simoff, 2019).
According to CRISP-DM, building ML models
can be divided into six steps with associated sub-
tasks, as highlighted by the blue area in Figure 1. The
Business Understanding step investigates the business
needs, goals, and constraints to formulate a data min-
ing problem and develop a project plan. During the
Data Understanding phase, actual datasets are identi-
fied and collected. Also, a first analysis is conducted
to understand the data and assess its quality. These
datasets are further manipulated in the Data Prepa-
ration step to properly prepare them for modeling.
This includes, e.g., selecting meaningful attributes,
performing data cleaning, and integrating different
data sources. Based on this final data set, the actual
generation of the models is executed in the Model-
ing step. Different models and configurations are ex-
plored, trained, and evaluated iteratively. The Evalu-
ation step complements the CRISP-DM loop by veri-
fying whether the goals defined in the business under-
standing step have been achieved. If the requirements
are satisfied, next steps are discussed in the Deploy-
ment phase to deploy the models to production.
3 METHODOLOGY
3.1 Knowledge Bottleneck and Potential
for Automation
CRISP-DM requires various roles—namely business
analyst, data scientist, big data developer, and busi-
ness owner (De Mauro et al., 2018)—to conduct a
project. Yet, the role of a data scientist, which covers
most of the data understanding, data preparation, and
modeling steps of the CRISP-DM process, is often not
filled in SMEs. To give a clear separation between
tasks that can be performed by domain experts and
tasks for which ML expertise is needed, we divided
these steps, including their associated sub-tasks, into
a Data Processing Phase and an ML Phase, as high-
lighted in Figure 1. Furthermore, the tasks in the two
phases can be assigned ML knowledge levels that are
required to perform them. A higher level corresponds
to more required expertise. We propose the following
knowledge levels for the data processing phase:
Level 1. Collect, describe and explore data: The
users can collect and store business data. They
understand the data and can explore it.
Level 2. Verify, select and clean the data: The users
understand the implications of data distributions,
outliers, and missing values.
Level 3. Construct and integrate data: The user can
construct new features out of existing data, which
are potentially meaningful for the expressiveness
of the dataset.
In contrast, the ML phase requires knowledge lev-
els with a profound ML expertise:
Level 4. Format data, select a model and generate
test design: The user knows how to prepare the
data for ML methods, knows the difference be-
tween problem classes like classification and re-
gression, and can use established ML libraries.
Level 5. Model assessment: The user knows the
functionality and meaning of different models
DATA 2023 - 12th International Conference on Data Science, Technology and Applications
32

and can assess the impact of their hyperparam-
eters. They must also have an understanding of
the different performance metrics in regard to the
dataset.
Level 6. Model creation: The user has a deep ML un-
derstanding, can create new models from scratch,
and can optimize them via different search algo-
rithms like grid or random search (Bergstra and
Bengio, 2012).
After splitting the ML pipeline into an ML and a
non-ML phase, we analyze how AutoML can replace
the manual labor in the ML phase. This may enable
data domain experts to use ML techniques and, con-
sequently, speed up the development of ML solutions
within the organization significantly. AutoML is sup-
posed to handle as many of the more sophisticated
knowledge levels as possible. Therefore, in the next
sections, we explain the individual steps in more de-
tail in the context of the residual value case study.
3.2 Data Processing Phase
Collect, Describe & Explore Data. The initial data
was obtained by regularly collecting all advertise-
ments from seven major construction equipment mar-
ket portals
1
over a time period of seven months. In
total, 11 606 162 entries from different manufacturers
have been collected. The collected features, selected
by data domain experts a priori, are shown in Table 1.
Verify Data Quality. A drawback of collecting data
automatically by web-scraping is the resulting dataset
quality. Regular collection of advertisements from
web portals leads to duplicated data points, as the
same construction machine can be offered on differ-
ent platforms and for longer periods. Furthermore, the
quality and completeness of the dataset depend on the
input of the portal users, which may lead to incorrect
or missing attributes. Outliers were primarily present
Table 1: Collected dataset features with types and examples.
Feature Type Example
Brand Categorical Caterpillar
Model Categorical M318
Series Categorical E
Construction year Numerical 2018
Working hours Numerical 8536
Location Categorical Germany
Price Numerical 59.000 C
1
The market portals are Mascus, Catused, Mobile, Ma-
chineryLine, TradeMachines, Truck1, and Truckscout24.
0 2 4 6 8 10
Working hours
10
4
0
2
4
6
8
10
Price in Euros
10
5
Data points
Outliers
Figure 2: Working hours versus price where detected out-
liers are highlighted.
in the attributes working hours and price, as displayed
in Figure 2.
Select & Clean Data. Duplicate entries are elimi-
nated by an iterative comparison of different feature
combinations. In the Working hours feature, outliers
were identified through reviews by the respective do-
main experts, considering the average number of op-
erating hours for the given model and year of manu-
facture. For instance, some machines were advertised
with operating hours much larger than their expected
lifetime. For outliers regarding the price feature, the
main source of noise was traced back to a missing cur-
rency conversion for one of the biggest dealers from
Poland. These outliers were detected by a plausibility
check—namely, removing values outside a 99% con-
fidence interval—considering the working hours and
price. Errors in the series attribute are also mainly
caused by incorrect inputs by the selling dealer. If the
underlying reason for errors or outliers could not be
determined, the sample was dropped.
Dealing with missing values depends on the at-
tribute. Samples are dropped if a value of the fea-
tures model, construction year, or location is miss-
ing. Missing values for the working hours attribute
will be substituted via stochastic regression imputa-
tion (Newman, 2014). Values for the series attribute
are optional. The entries for brand and price are
mandatory on all portals for creating advertisements.
Construct & Integrate Data. Finally, to ensure
sufficient data for each construction machine model,
only model types with more than 150 samples were
added to the dataset, resulting in 10 different machine
models and 2910 samples in total. As all remaining
machine models are manufactured by Caterpillar, the
brand feature, depicted in Table 1 is thus obsolete. An
Benchmarking Automated Machine Learning Methods for Price Forecasting Applications
33
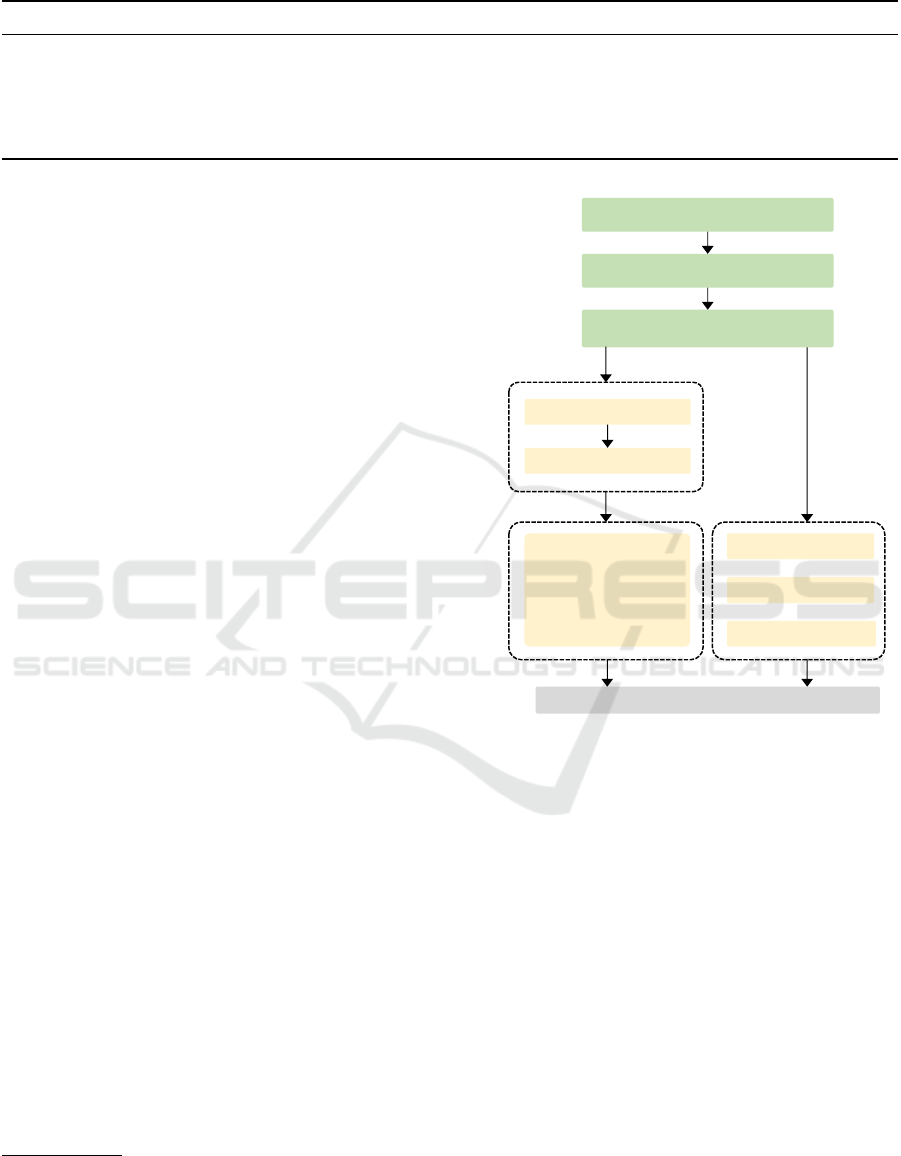
Table 2: Excerpt of the final dataset.
Brand Model Series Construction year Working hours Location Price
Caterpillar 308 D 2010 4865 BE 38500
Caterpillar D6 T 2016 11851 NL 112000
Caterpillar 330 F 2015 4741 CH 126056
Caterpillar M318 F 2016 8920 PL 99000
Caterpillar 966 K 2012 10137 FR 82000
excerpt of the resulting dataset is shown in Table 2. To
also account for and investigate the impact of single
features, data subsets with individual feature combi-
nations are created. The subset consisting of the ma-
chine model, working hours, and construction year is
used as the baseline feature set (subsequently referred
to as basic subset). In addition, this basic subset was
extended by the series and/or location feature, result-
ing in four data sets.
3.3 ML Phase
As we want to test whether AutoML can be a po-
tential substitution for manual ML, we describe the
manually implemented pipeline and selected AutoML
frameworks in more detail below. An overview of the
whole ML pipeline for the case study is depicted in
Figure 3 and the source code is available on Github
2
.
3.3.1 Manual ML
The manually created pipeline closely resembles a
best-practice pipeline (Géron, 2022). All features are
pre-processed using one-hot encoding for categori-
cal features and standard scaling for numerical fea-
tures. Next, seven different state-of-the-art and well-
established ML methods are used for predicting the
residual values:
• Polynomial Regression
• Tree-based regression: decision tree, random for-
est (RF) & adaptive boosting (AdaBoost)
• Kernel-based regression: support vector regres-
sion (SVR) & k-nearest neighbors (kNN)
• Deep learning: multi-layer perceptron (MLP)
For each of those methods, selected hyperparameters
are tuned via random search
3
. For more information
on those ML methods, we refer the interested reader
to (Géron, 2022).
2
See https://tinyurl.com/4wt2hp2y.
3
The list of hyperparameters is available within the on-
line source code.
Clear dataset of duplicates
Remove outliers
Generate dataset with different
feature combinations
One-hot encoding
Standard scaling
auto-sklearn
FLAML
manual ML:
Polyn. Regression,
Decision Trees, RF,
AdaBoost, SVR,
kNN, MLP
AutoGluon
Evaluate models and document results
for each feature combination
Format Data
Train Models
Figure 3: The case study pipeline illustrates the steps of the
data processing phase in green and the ML phase in yellow.
One-hot encoding and standard scaling are only applied to
the manually implemented ML methods.
3.3.2 Automated ML
The manual approach is compared with the three
open-source AutoML frameworks AutoGluon (Erick-
son et al., 2020), auto-sklearn (Feurer et al., 2020),
and FLAML (Wang et al., 2022). We chose those
AutoML frameworks as they are 1. simple to use,
2. well documented, 3. easy to integrate, 4. have
achieved good performances in the past (Gijsbers
et al., 2019), and 5. have a broad user base and,
therefore, good support. To ensure a fair compari-
son, we restricted the selection of algorithms to the
ones with implementation in the same underlying ML
library, namely scikit-learn (Pedregosa et al., 2011),
and omitted, for example, Neural Network Intelli-
gence (NNI) (Microsoft, 2021) as it uses additional
frameworks, e.g., PyTorch (Paszke et al., 2019).
DATA 2023 - 12th International Conference on Data Science, Technology and Applications
34

The selected frameworks promise an end-to-end
creation of ML pipelines, including all necessary pre-
processing steps, for tabular regression tasks. Conse-
quently, data is not manually pre-processed.
3.4 Criteria
To determine the relative performance of the models,
we define a novel benchmarking scheme. In literature
and practice, a multitude of commonly used evalu-
ation criteria—such as mean absolute error (MAE),
root mean squared error (RMSE), and mean abso-
lute percentage error (MAPE)—are well known and
widely adopted to assess the performance of an ML
regressor. To account for industrial requirements,
these technical metrics have to be complemented by
further non-technical ones. Consequently, multiple
factors have to be integrated into the algorithm selec-
tion process. Following (Ali et al., 2017), we define
quality metrics with application-based meanings that
domain experts can understand:
Correctness (s
corr
) measures the predictive power of
an ML model. This corresponds to typical metrics
used in supervised learning. In the context of this
work, the MAPE
MAPE =
1
n
n
∑
i=1
|y
i
− ˆy
i
|
|y
i
|
is used to calculate the performance, with y
i
be-
ing the true value, ˆy
i
the predicted value and n the
number of samples.
Complexity (s
comp
) measures the training complex-
ity of an ML model. In this work, we use the CPU
wall-clock time as a proxy for this metric.
Responsiveness (s
resp
) measures the inference time
of an ML model by determining the CPU wall-
clock time required to create a single prediction.
This aspect may be especially important for inter-
active and real-time systems. Following (Nielsen,
1993), runtimes are mapped into a real-time (un-
der 0.1 seconds), fast (under 1 second), and slow
(above 1 second) category.
Expertise (s
exp
) measures the knowledge level, as in-
troduced in Section 3.1, required to be able to cre-
ate the according ML solutions in the first place.
Reproducibility (s
repr
) measures the stability of the
ML model regarding the other criteria by deter-
mining the standard deviation if retrained on the
exact same data again.
These criteria are combined into a novel score to
create a ranked list of ML models. It is, therefore,
mandatory to normalize all criteria values to [0, 1] us-
ing min-max scaling. Furthermore, the actual met-
rics in each criterion have to be compatible with each
other by having identical optimization directions; in
our case smaller values being better. Preferences re-
garding the weighting of individual criteria should be
incorporated into the final score. This can be done
by assigning weights w
c
to each criterion leading to
the final method evaluation score (MES) using the
weighted average
MES =
∑
c∈C
w
c
˜s
c
∑
c∈C
w
c
(1)
with C = {corr, comp, resp, exp, repr} and ˜s
c
being the
normalized values. By design, the MES is bound to
[0, 1], where zero indicates a perfect and one the worst
performance with regard to all individual metrics. To
ensure reliable results and make the calculation of re-
producibility even possible, models need to be fitted
multiple times.
4 RESULTS
This section presents the results of the experiments.
For a better overview, we only present the two best
(in terms of correctness) ML models, RF and MLP,
out of the seven examined manual methods and use
them as a baseline for comparison against the investi-
gated AutoML frameworks. All measurements were
performed on a Ubuntu Linux 20.04.5 LTS system
with 32 GB RAM and an Intel i7-4790 Processor. We
conducted five independent measurements with fixed
90% / 10% holdout training/test split.
4.1 Correctness
The correctness, in form of the MAPE, of the differ-
ent approaches is depicted in Figure 4. AutoGluon
delivers the best results for all feature combinations.
For the rest of the methods, there is no clear trend
or order. Thus, concerning the prediction quality, the
AutoML methods are comparable to or even better
than the manual ML methods. The best results with
respect to minimal predictive error for all methods are
achieved with the entire feature set.
4.2 Expertise
Implementing and tuning the seven manual ML meth-
ods presumes expertise of level 5 and requires ap-
proximately 50 lines of code (LOC) on average. The
manual approaches must be implemented and config-
ured by hand and require a profound understanding
Benchmarking Automated Machine Learning Methods for Price Forecasting Applications
35
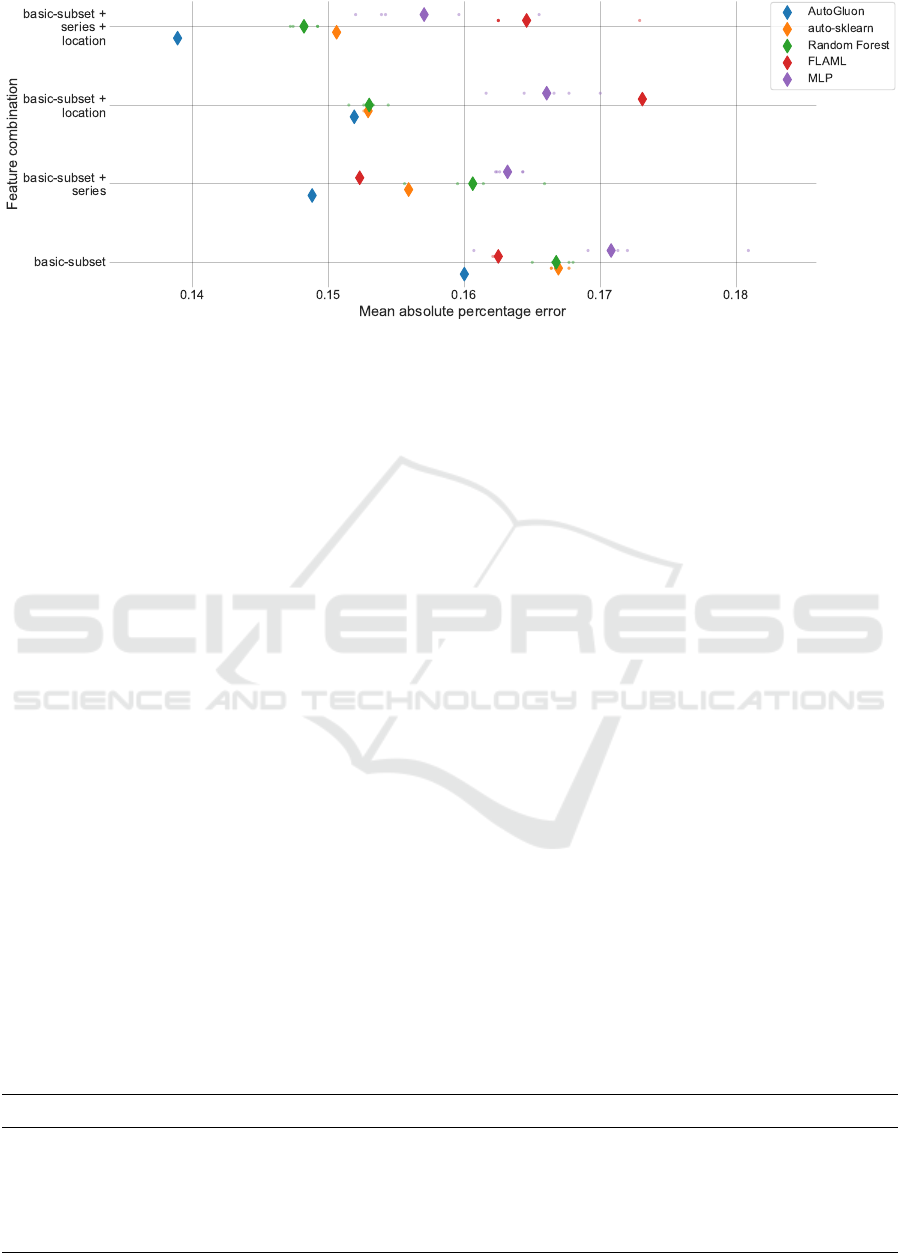
Figure 4: Correctness, in form of MAPE. Diamonds depict the average results over 5 repetitions. Single measurements are
displayed as dots. Due to low variance, single measurements are often not visible. For better visibility, only the winning RF
method is shown for the set of the manual ML methods.
of the different ML libraries, their functionalities, and
when and how to use them. On the other hand, train-
ing and predicting using AutoGluon, auto-sklearn, or
FLAML can be implemented within 5 LOC and with-
out any ML expertise. This demonstrates that ba-
sic programming knowledge is sufficient to use the
AutoML frameworks. Yet, generating and storing the
data is still necessary (knowledge level 1). The same
holds true for verifying and cleaning the data (knowl-
edge level 2). Thus, the knowledge demands for the
AutoML methods, with level 2, and the manual ML
methods, with level 5, are quite different, with a clear
advantage for the AutoML methods.
4.3 Responsiveness
Responsiveness is measured as the average prediction
time over all samples. Predictions of a single sample
are always in a millisecond range. Consequently, all
methods fall in the real-time application category.
4.4 Complexity
The results for the method complexity, in terms of
training duration, are depicted in Figure 5. Auto-
Gluon has the lowest training time with about 15 sec-
onds, being much better than RF coming in second
place. In contrast to all other analyzed methods, Au-
toGluon does not search for an optimized model but
trains only a single predefined ensemble. FLAML
and auto-sklearn fully utilize the specified training
budget of 1800 seconds, whereas the manual ML
methods are controlled by an iteration number and not
by a time limit. The detailed algorithmic analysis of
these findings is further analyzed in a follow-up work.
4.5 Reproducibility
As the values of the expertise (s
exp
) and responsive-
ness (s
resp
) are categorical measurements, we did not
observe any variance making these criteria unsuited.
Both correctness (s
corr
) and complexity (s
comp
) ex-
pressed usable variance. In the context of this work,
we decided to use correctness as the basis for repro-
ducibility (s
repr
). A variance of performance can be
Table 3: MES with unnormalized underlying criteria for all methods on the complete feature set. Smaller values are better.
The best results are highlighted in bold. The observed differences in the results for each criterion were significant according
to a Student’s t-test with α = 0.05. Reproducability, defined as the standard deviation of Correctness, is not depicted as its
own column. Results marked by * did produce constant results.
Method Correctness [MAPE] Complexity [sec.] Expertise Responsiveness MES
MLP 0.1570±0.0049 2308.1±354.70 5 real-time 0.977±0.0130
RF 0.1482±0.0009 1067.6±29.93 5 real-time 0.896±0.0138
auto-sklearn 0.1506 * 1806.1±3.52 2 real-time 0.696±0.0160
AutoGluon 0.1389 * 14.2±0.17 2 real-time 0.583±0.0101
FLAML 0.1646 ± 0.0042 1801.5 ± 0.71 2 real-time 0.738 ± 0.0108
DATA 2023 - 12th International Conference on Data Science, Technology and Applications
36
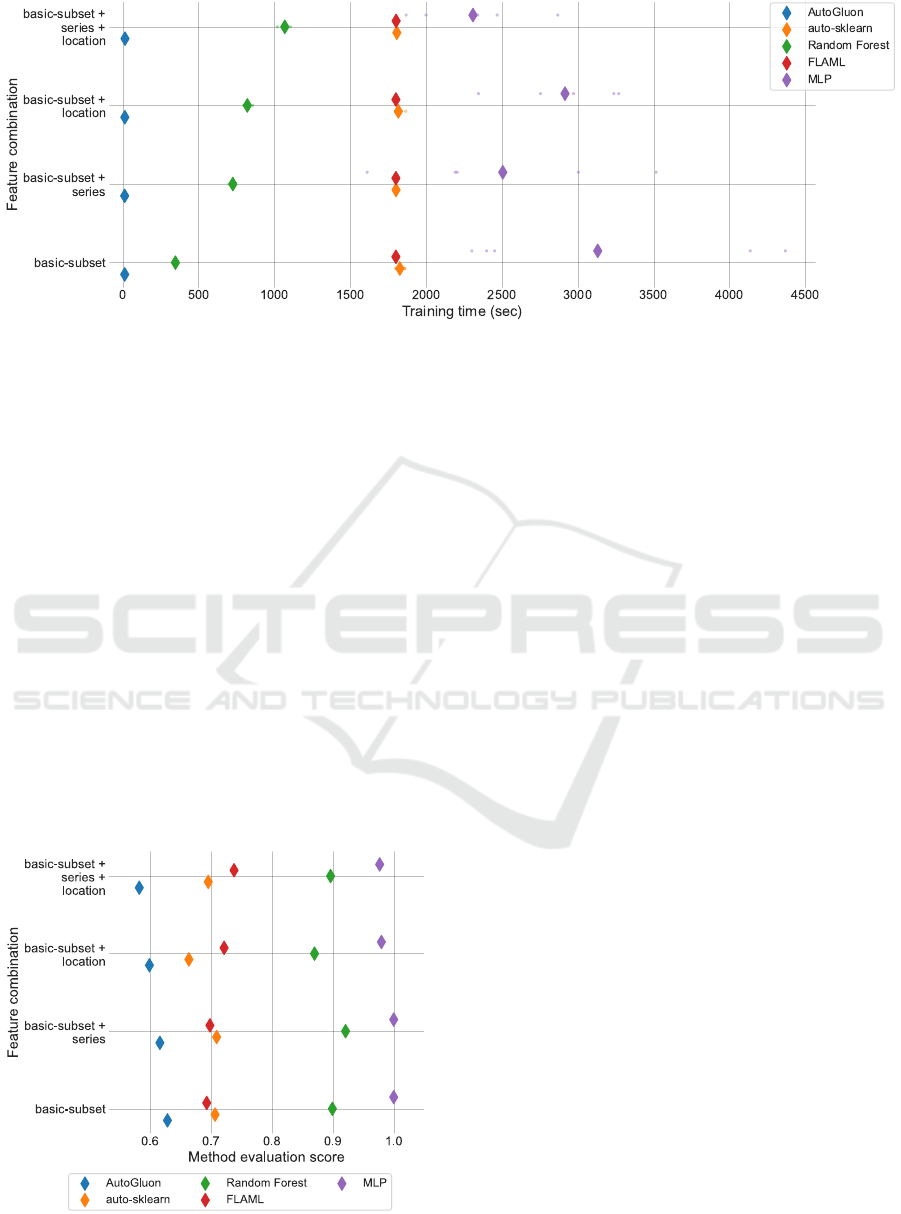
Figure 5: Model complexity, in terms of training duration, for all feature set combinations. The AutoML frameworks are
configured to optimize for 1800 seconds. Diamonds depict average results over 5 repetitions. Single measurements are
displayed as dots. Due to low variance, single measurements are often not visible. For better visibility, only the winning RF
method is shown for the set of the manual ML methods.
observed for FLAML, RF, and MLP, while both auto-
sklearn and AutoGluon produced constant results.
4.6 Method Evaluation Score
We determined the values of the weighting factors for
individual criteria by surveying six domain experts,
averaging the results, and rounding them to the near-
est tens for simplicity. In our case, w
corr
= 50, w
exp
=
40 and w
comp
= 10. While in general, all criteria are
important, w
resp
and w
repr
are set to 0 for the con-
sidered use case because they were deemed unimpor-
tant by the domain experts. The MESs, as defined in
Equation (1), are calculated for each method/feature
combination and depicted in Figure 6. For the fea-
ture subset with the lowest overall MES, the individ-
Figure 6: Method evaluation score for each method and sub-
set combination. Smaller values are better.
ual criteria scores and the final MESs are depicted in
Table 3. The winning method/subset combination is
AutoGluon and the complete subset, with an MES of
0.583. The MES drastically simplifies the methods’
comparability and shows that AutoGluon is perform-
ing best for the given data set and weighting factors.
Based on these findings, AutoML seems to be a good
alternative for this use case.
5 CONCLUSION
This work analyzed the potential of AutoML methods
and their usability for SMEs with limited ML exper-
tise. In our case study, predicting the residual value
of used heavy construction equipment, all evaluated
AutoML methods were shown to outperform man-
ually created ML pipelines regarding the newly in-
troduced method evaluation score (MES), see Equa-
tion (1). Furthermore, they are applicable with only
domain knowledge and basic data processing skills.
We, therefore, showed that separating the data under-
standing, data preparation, and modeling steps of the
CRISP-DM process into a data domain and an ML
part enables companies with limited ML expertise to
tackle ML projects by using AutoML methods. We
introduced ML expertise levels and used the MES to
enable an easy assessment of the different ML and
AutoML methods.
To transfer the results identified in this case study
to other use cases, a qualification of domain experts
for at least knowledge level 2 is necessary. In sum-
mary, the evaluation of the models created by Auto-
Gluon was deemed favorable. The predictions were
Benchmarking Automated Machine Learning Methods for Price Forecasting Applications
37

validated by the domain experts as valid and reli-
able. Consequently, the deployment phase in the
CRISP-DM process can be planned and implemented.
It has to be mentioned that we only examined a
limited number of ML and AutoML methods on four
variations of a single data set, so that general state-
ments are therefore limited by our choice of methods.
In the evaluated use case AutoML was able to pro-
vide results with a good performance, yet it still may
not be applicable for some use cases. AutoML tools
may create models with low predictive power or even
fail to generate a model at all. To resolve some of
these issues, knowledge of ML could be necessary,
which users with knowledge level three or lower do
not have.
In the future, we plan to examine the differences
between the AutoML methods in more detail and ex-
tend their usability for SMEs by adding additional
preprocessing steps like data splitting. In addition to
the MES, we aim to develop a data-centric explana-
tion of the final results to provide more insights for
domain experts. This is intended to explain the model
behavior via the dataset and should enable the domain
experts to validate the quality and reliability of the re-
sults based on the data used to train the models. These
data-centric explanations are crucial in order to gen-
erate confidence in the results and increase the will-
ingness of domain experts to use AutoML methods.
ACKNOWLEDGEMENTS
This work was partly funded by the German Federal
Ministry of Economic Affairs and Climate Action in
the research project AutoQML.
REFERENCES
Ali, R., Lee, S., and Chung, T. C. (2017). Accurate
multi-criteria decision making methodology for rec-
ommending machine learning algorithm. Expert Sys-
tems with Applications, 71:257–278.
Alshboul, O., Shehadeh, A., Al-Kasasbeh, M., Al Mam-
look, R. E., Halalsheh, N., and Alkasasbeh, M. (2021).
Deep and machine learning approaches for forecasting
the residual value of heavy construction equipment:
a management decision support model. Engineering,
Construction and Architectural Management.
Ardic, O. P., Mylenko, N., and Saltane, V. (2011). Small and
medium enterprises: A cross-country analysis with a
new data.
Bauer, M., van Dinther, C., and Kiefer, D. (2020). Machine
learning in sme: an empirical study on enablers and
success factors. AIS Electronic Library (AISeL).
Bergstra, J. and Bengio, Y. (2012). Random search for
hyper-parameter optimization. JMLR, 13:281–305.
Chiteri, M. (2018). Cash-flow and residual value analysis
for construction equipment. Master’s thesis, Univer-
sity of Alberta.
De Mauro, A., Greco, M., Grimaldi, M., and Ritala, P.
(2018). Human resources for big data professions: A
systematic classification of job roles and required skill
sets. Information Processing & Management, 54(5).
Erickson, N., Mueller, J., Shirkov, A., Zhang, H., Larroy,
P., Li, M., and Smola, A. (2020). Autogluon-tabular:
Robust and accurate automl for structured data. arXiv
preprint arXiv:2003.06505.
Fan, H., AbouRizk, S., Kim, H., and Zaïane, O. (2008).
Assessing residual value of heavy construction equip-
ment using predictive data mining model. Journal of
Computing in Civil Engineering, 22(3):181–191.
Feurer, M., Eggensperger, K., Falkner, S., Lindauer, M.,
and Hutter, F. (2020). Auto-sklearn 2.0: Hands-
free automl via meta-learning. arXiv preprint
arXiv:2007.04074.
Frazier, P. I. (2018). A tutorial on bayesian optimization.
arXiv preprint arXiv: 1807.02811, pages 1–22.
Géron, A. (2022). Hands-on machine learning with Scikit-
Learn, Keras, and TensorFlow. " O’Reilly Media".
Gijsbers, P., LeDell, E., Thomas, J., Poirier, S., Bischl, B.,
and Vanschoren, J. (2019). An open source automl
benchmark. arXiv preprint arXiv:1907.00909.
Hutter, F., Kotthoff, L., and Vanschoren, J. (2019). Au-
tomated machine learning: methods, systems, chal-
lenges. Springer Nature.
Kolyshkina, I. and Simoff, S. (2019). Interpretability of
machine learning solutions in industrial decision engi-
neering. In Australasian Conference on Data Mining.
Lucko, G. (2003). A statistical analysis and model of the
residual value of different types of heavy construction
equipment. PhD thesis, Virginia Tech.
Lucko, G. (2011). Modeling the residual market value of
construction equipment under changed economic con-
ditions. JCEMD4, 137(10):806–816.
Lucko, G. and Vorster, M. C. (2004). Predicting the residual
value of heavy construction equipment. In Towards a
vision for information technology in civil engineering.
American Society of Civil Engineers.
Lucko, G., Vorster, M. C., and Anderson-Cook, C. M.
(2007). Unknown element of owning costs - impact
of residual value. JCEMD4, 133(1).
Microsoft (2021). Neural Network Intelligence.
Miloševi
´
c, I., Kova
ˇ
cevi
´
c, M., and Petronijevi
´
c, P. (2021).
Estimating residual value of heavy construction equip-
ment using ensemble learning. JCEMD4, 147(7).
Miloševi
´
c, I., Petronijevi
´
c, P., and Arizanovi
´
c, D. (2020).
Determination of residual value of construction
machinery based on machine age. Gra
¯
devinar,
72(01.):45–55.
Newman, D. A. (2014). Missing data: Five practical guide-
lines. Organizational Research Methods, 17(4).
Nielsen, J. (1993). Usability Heuristics, chapter 5.5 Feed-
back. Morgan Kaufmann.
DATA 2023 - 12th International Conference on Data Science, Technology and Applications
38

Paszke, A., Gross, S., Massa, F., Lerer, A., Google, J. B.,
Chanan, G., Killeen, T., Lin, Z., Gimelshein, N.,
Antiga, L., Desmaison, A., Xamla, A. K., Yang, E.,
Devito, Z., Nabla, M. R., Tejani, A., Chilamkurthy, S.,
Ai, Q., Steiner, B., Facebook, L. F., Facebook, J. B.,
and Chintala, S. (2019). Pytorch: An imperative style,
high-performance deep learning library. In Advances
in Neural Information Processing Systems 32, pages
8024–8035.
Pedregosa, F., Varoquaux, G., Gramfort, A., Michel, V.,
Thirion, B., Grisel, O., Blondel, M., Prettenhofer, P.,
Weiss, R., Dubourg, V., Vanderplas, J., Passos, A.,
Cournapeau, D., Brucher, M., Perrot, M., and Duch-
esnay, E. (2011). Scikit-learn: Machine learning in
python. JLMR, 12:2825–2830.
Ponnaluru, S. S., Marsh, T. L., and Brady, M. (2012). Spa-
tial price analysis of used construction equipment:
The case of excavators. Construction Management
and Economics, 30(11):981–994.
Shearer, C. (2000). The crisp-dm model: the new blueprint
for data mining. Journal of data warehousing, 5(4).
Shehadeh, A., Alshboul, O., Al Mamlook, R. E., and Hame-
dat, O. (2021). Machine learning models for predict-
ing the residual value of heavy construction equip-
ment: An evaluation of modified decision tree, light-
gbm, and xgboost regression. Automation in Con-
struction, 129:103827.
Studer, S., Bui, T. B., Drescher, C., Hanuschkin, A., Win-
kler, L., Peters, S., and Müller, K.-R. (2021). Towards
crisp-ml (q): a machine learning process model with
quality assurance methodology. Machine Learning
and Knowledge Extraction, 3(2):392–413.
Wang, C., Wu, Q., Liu, X., and Quintanilla, L. (2022). Au-
tomated machine learning & tuning with flaml. In
Proceedings of the 28th ACM SIGKDD Conference on
Knowledge Discovery and Data Mining.
Yao, Q., Wang, M., Chen, Y., Dai, W., Li, Y.-F., Tu, W.-
W., Yang, Q., and Yu, Y. (2018). Taking human out
of learning applications: A survey on automated ma-
chine learning. arXiv preprint arXiv:1810.13306.
Zöller, M.-A., Nguyen, T.-D., and Huber, M. F. (2021).
Incremental search space construction for machine
learning pipeline synthesis. In Advances in Intelligent
Data Analysis XIX.
Zong, Y. (2017). Maintenance cost and residual value pre-
diction of heavy construction equipment. Master’s
thesis, University of Alberta.
Zoph, B. and Le, Q. V. (2016). Neural architecture
search with reinforcement learning. arXiv preprint
arXiv:1611.01578.
Zöller, M.-A. and Huber, M. F. (2021). Benchmark and sur-
vey of automated machine learning frameworks. Jour-
nal of Artificial Intelligence Research, 70:409–472.
Benchmarking Automated Machine Learning Methods for Price Forecasting Applications
39
