
Metrics and Metamodels for Mission-Based Assessment of Multi-Aircraft
Force Compositions
Julian Seethaler
a
, Michael Strohal and Peter St
¨
utz
b
Institute of Flight Systems, University of the Bundeswehr Munich, Werner-Heisenberg-Weg 39, 85577 Neubiberg, Germany
Keywords:
Agent-Based Simulation, Constructive Simulation, Metamodeling, Performance Indicators, Systems
Effectiveness.
Abstract:
In this work, metric vectors for the fair quantitative assessment and comparison of multi-aircraft force com-
positions with unmanned aerial vehicles (UAV) and/or manned-unmanned teaming (MUM-T) are proposed
for specific representative missions in the form of imaging intelligence (IMINT) and close air support (CAS)
vignettes. General advantages and disadvantages of force compositions combined with common mission tasks
lead to a hierarchically structured pool of possible metrics, which are also known as performance indicators,
from which suitable measures are selected for the respective mission type(s). These are tested on data from
agent-based constructive simulation. Combining simulation results and the associated expert-derived criteria
weights, which represent the importance of the respective items, yields insights about systems effectiveness
potentials. Additionally, vignette-specific linear regression, support vector regression (SVR), and neural net-
work regression (NNR) metamodels are derived to enable estimation of mission performance of multi-aircraft
force compositions without explicit simulation. These are compared among each other and trialed against test
data.
1 INTRODUCTION
When developing aircraft, making procurement de-
cisions, or planning apportionment, there is a need
to quantitatively assess the performance of the con-
sidered aircraft alternatives. Comprehensive meth-
ods exist for comparing single aircraft based on their
properties (Morawietz et al., 2018) and for single
civil UAV applications with a reconnaissance mis-
sion (Fokina et al., 2018a; Fokina et al., 2018b). But
especially in the future’s increasingly connected bat-
tlespace with manned-unmanned teaming (MUM-T)
(US Air Force, 2016) and/or (semi)autonomous co-
operating entities (US Secretary of Defense, 2005),
considering single air platforms in isolation is insuffi-
cient. This is because there is no direct mapping from
a single entity’s abilities to the mission results due to
the greatly increased interdependency and complexity
in distributed systems. In the past, this was illustrated
e.g. in the determination of “fleet mix mission effec-
tiveness” (Rains, 1999) for naval formations.
For example, if a decisionmaker wants to estab-
lish which of some given alternative force packages
a
https://orcid.org/0000-0002-8400-3254
b
https://orcid.org/0000-0002-6571-4392
of unmanned aerial vehicles (UAVs) is best suited
for a typical reconnaissance assignment, the utility of
the various force compositions in this mission must
be determined. This can be achieved by applying
mission-specific metrics to the data generated from
several mission executions in constructive simulation.
Thus, to determine which aircraft and which combi-
nations of aircraft are best suited for an operation, a
general mission-oriented process for deriving and uti-
lizing metrics, i.e., performance measures, has been
proposed. It was already implemented in demo appli-
cations (Seethaler et al., 2020; Seethaler et al., 2021;
Seethaler et al., 2022). The method is based on view-
ing the performance of cooperating groups of aircraft
purely in terms of operational outcomes.
In this paper, after summarizing said process, an
application to two different mission vignettes yield-
ing quantitative assessments of the used force pack-
ages is presented. Then metamodels for time-saving
performance estimates without extensive simulation
are obtained.
Seethaler, J., Strohal, M. and StÃijtz, P.
Metrics and Metamodels for Mission-Based Assessment of Multi-Aircraft Force Compositions.
DOI: 10.5220/0012054500003546
In Proceedings of the 13th International Conference on Simulation and Modeling Methodologies, Technologies and Applications (SIMULTECH 2023), pages 49-60
ISBN: 978-989-758-668-2; ISSN: 2184-2841
Copyright
c
2023 by SCITEPRESS – Science and Technology Publications, Lda. Under CC license (CC BY-NC-ND 4.0)
49

2 CONCEPT AND METHODS
Figure 1 illustrates the application of metrics in the
context of operational analysis of multi-aircraft force
compositions. These can consist of various possi-
ble homogenous and heterogenous combinations of
manned and unmanned types with certain capabili-
ties and weaknesses. To fulfill the respective mis-
sion, each force package requires a (potentially dif-
ferent) mission execution plan, taking into account
doctrine and rules of engagement (RoE). The mission
itself and its requirements are concretely represented
in a specific vignette. From the vignette, stakeholders
and subject-matter experts (SMEs) select lower-level
measures of performance (MoP) and operation-level
measures of effectiveness (MoE) in a hierarchical tree
structure (more on metric derivation in section 2.1).
These measures can be aggregated to an overall qual-
ity integral J by the application of multi-criteria deci-
sion analysis (MCDA) methods. This composite fig-
ure of merit in turn can be used for judgements, op-
timization, or as a reward function for artificial intel-
ligence applications (Ernest, 2015), based on the data
delivered by simulations of mission runs.
2.1 Metric Derivation and Selection
The goal of the metric derivation process as pro-
posed in (Seethaler et al., 2020; Seethaler et al., 2021)
is to find a scalar, normalized, and unitless (Feger
et al., 2018) total objective function J for the spe-
cific mission. Equation 1 gives a general hierarchical
weighted sum (HWS) (Whitcomb, 1998) form, where
the total effectiveness J is represented as a sum over
all N elementary criteria with respective quality mea-
sure value j, importance weight w, and sign σ (posi-
tive for benefit and negative for effort/cost):
J =
N
∑
k=1
σ
k
w
k
j
k
(1)
As alternatives to HWS, other MCDA methods
such as PROMETHEE (Brans et al., 1986) can be ap-
plied. It is important to note that while the mission
execution plan(s) and the force composition’s capabil-
ities and weaknesses are input and intermediate vari-
ables, for an assessment that is agnostic to number
and type of aircraft, only outcome data from simula-
tion or real mission execution must be considered.
The indicators j are selected from a structured
pool providing candidate metrics which are matched
to mission types. The collection’s hierarchical struc-
ture enables application of MCDA methods.
This pool contains all relevant benefit and ef-
fort/cost items, which are found in the form of mea-
surable elementary criteria, e.g., fuel used, by break-
ing down the respective mission vignette’s require-
ments in a structured decomposition. The selected
metric vector must be transparent, consistent, com-
plete, and expressive. This means that it should de-
liver understandable and traceable results, that high-
light the differences between the mission results of
different force compositions and execution plans. To
this end, it is important to only focus on mission out-
comes and to avoid mixing in input or intermediate
parameters, like several preexisting assessment meth-
ods do, which often are not hierarchically tiered nor
particularly methodically derived.
Strengths-Weaknesses-Opportunities-Threats
(SWOT) analysis (Piercy and Giles, 1989) is used
in support of the decomposition and selection
process. It facilitates viewing internal potential
advantages (strengths) and disadvantages (weak-
nesses) in connection with negative (threats) and
positive (opportunities) external factors. It yields
potential general advantages and disadvantages of
force compositions which serve as basis for more
specific metrics in the operation’s context.
Among the projected advantages of using multi-
ple aircraft are increased sensor quality (perhaps due
to fusion), enhanced flexibility due to distributed ca-
pabilities, robustness versus loss of single entities,
longer time on station or faster mission completion.
Some main challenges for cooperative force packages
are: interruption of communications (e.g. due to jam-
ming), inaccuracies in positioning (e.g. because of
spoofing), detectability by various types of sensors,
reduced payload, and increased cost or effort (e.g.
due to complexity in logistics). Thus, primarily mea-
sures for effect and reconnaissance quality, timing and
duration, vulnerability (especially detectability) com-
munications and required data rates, and monetary
cost are required.
Finally, the established performance indicators j
of course must be normalized to allow for aggregation
along the criteria hierarchy as in equation 1. To assign
priorities to criteria in terms of quantitative weights
w, the Fuzzy Analytic Hierarchy Process (Fuzzy AHP
or FAHP) consisting of pairwise comparison of all
sub-criteria at each decomposition node via linguis-
tic variables is a reliable and practical way (Seethaler
et al., 2020).
2.2 Simulation Considerations
A notional design of experiment (DoE) process for
finding meaningful simulation input parameter sets
has been presented in (Seethaler et al., 2022). Its
first overall step is the selection of one or more rep-
SIMULTECH 2023 - 13th International Conference on Simulation and Modeling Methodologies, Technologies and Applications
50
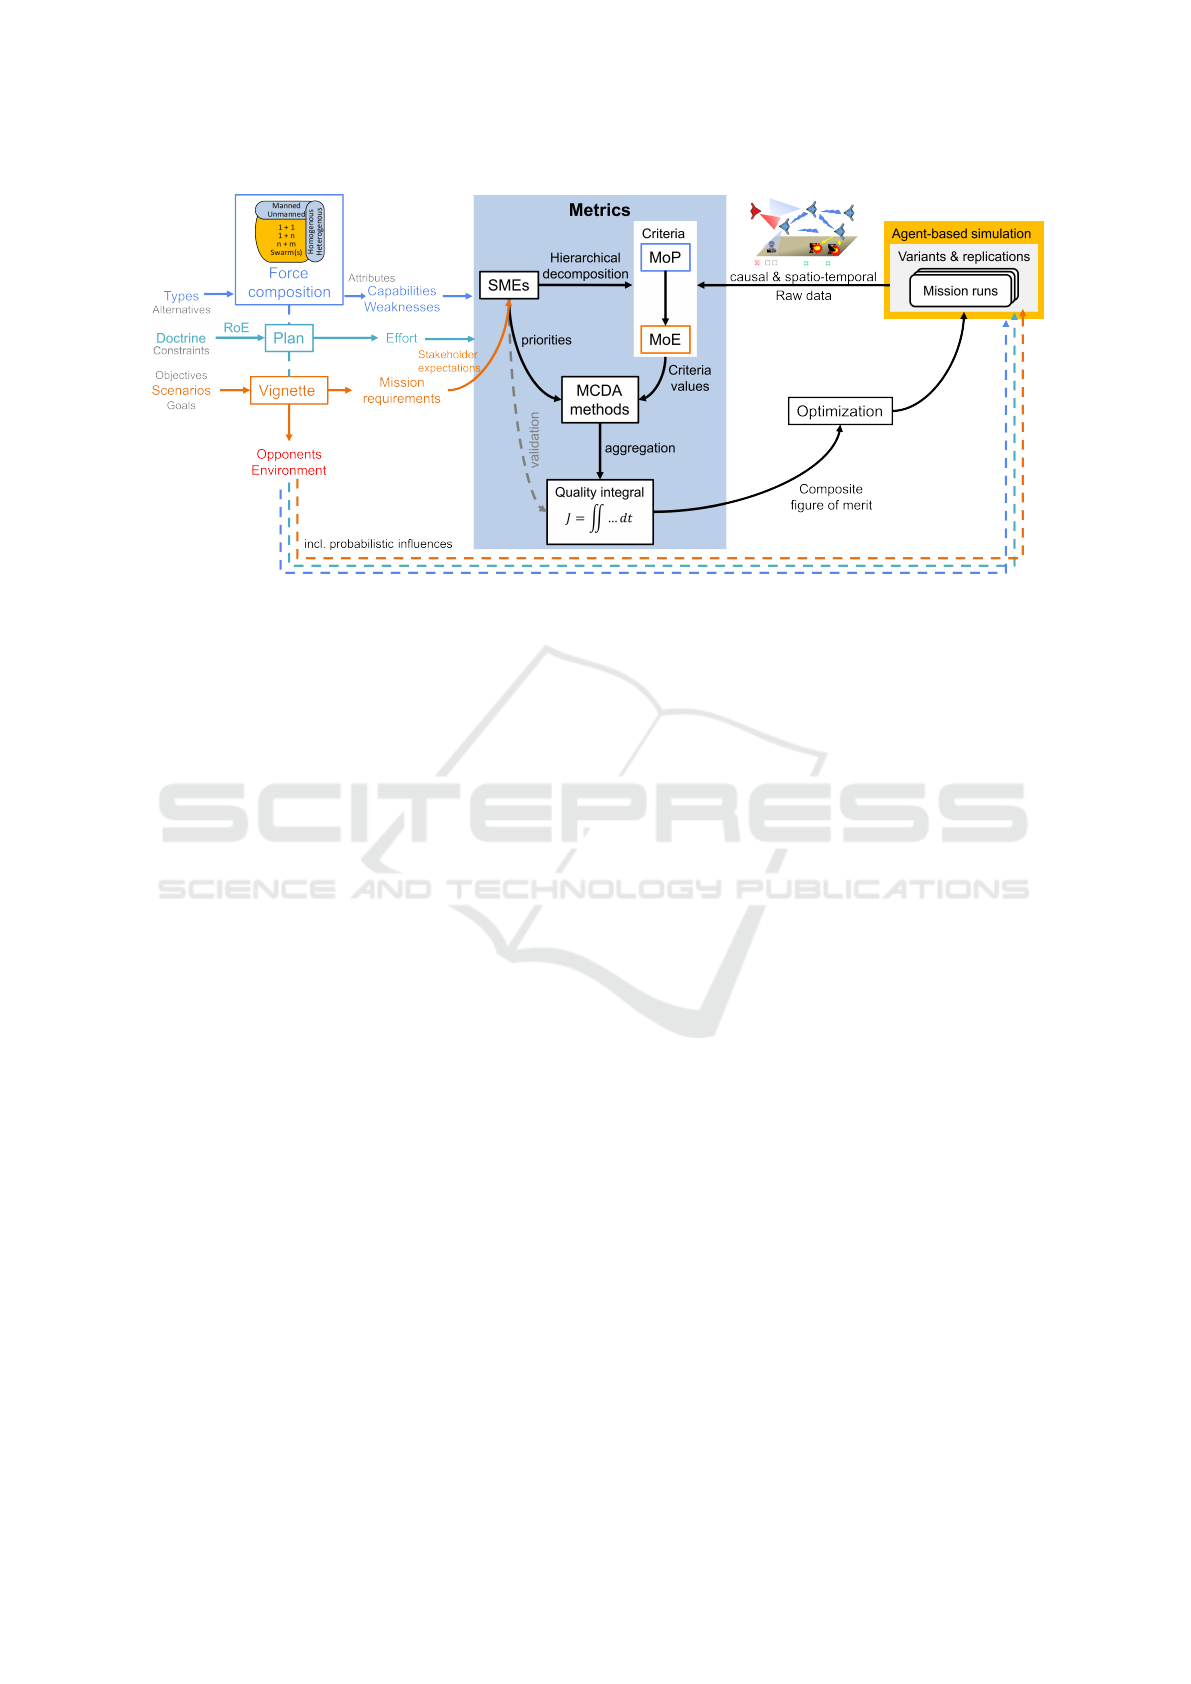
Figure 1: Concept overview: Metrics and metrics derivation process in the context of assessment of multi-aircraft operations.
resentative mission vignettes. Secondly, categories
of aircraft, such as medium altitude long endurance
(MALE) UAV, are represented by archetypes with
well-defined performance characteristics. These are
the basis for the models used in simulation and are
combined to promising force compositions via a mor-
phological approach (Zwicky, 1967). Additionally,
for all variants, which depict options that theoretical
human decisionmakers could directly influence, sev-
eral replications, i.e. repeat simulations, should be
conducted if random variables play a role.
The mission execution plans must match the vi-
gnette’s requirements and the force composition’s ca-
pabilities. Usual concepts and typical ideas can be
collected from literature and SMEs. The fine plan-
ning of waypoints etc. is done by the experimenters
or via automated planning algorithms, which are use-
ful e.g. for coverage path planning, a common plan
for reconnaissance missions (Seethaler et al., 2022;
Stodola et al., 2019).
2.3 Metamodel Development
To deliver an estimate of the expected performance
assessment without conducting time-consuming sim-
ulation experiments, i.e. to predict simulation out-
comes, vignette-specific metamodels can be devel-
oped, that map the most important aircraft and mis-
sion plan properties to the effectiveness J or any other
criterion in the assessment hierarchy. The goal is to
allow predictions of benefits and outcomes in mis-
sions, but also to draw inferences on desirable prop-
erties of multi-aircraft force compositions.
Previously, simple linear-quadratic regression
analysis was applied to derive a surrogate model in
the form of an analytical equation specific to a coop-
erative imaging intelligence vignette (Seethaler et al.,
2022). However, the model was unsatisfactory, be-
cause it was too simplistic. More elaborate multivari-
ate methods such as Kriging (Kleijnen, 2009) – also
known as Gaussian Process Regression (GPR) –, Sup-
port Vector Regression (SVR) (Smola and Sch
¨
olkopf,
2004), and Neural Network Regression (NNR) (Awad
and Khanna, 2015) can better capture more complex
relations between inputs and outputs.
In the model creation process (see section 3.4),
model hyperparameters are selected based on ap-
propriate measures of model fit for each method.
Then, validation of the constructed metamodels is
conducted by comparing predictions to test data, i.e.,
simulation results.
3 EXPERIMENT
In the experiment, metric vectors for different aerial
operations are presented and evaluated for their use-
fulness, expressiveness, sensitivity, and transparency.
Their objective validation is conducted by simulation
yielding realistic mission data to demonstrate the use
of the metrics’ value range and how they differentiate
distinct mission outcomes. To this end, two mission
vignettes, and according hierarchically structured cri-
teria and sub-criteria are required.
3.1 Metrics and Weights
The hierarchical metrics pool and the mission types
on which the respective criteria bear relevance are
shown (slightly simplified for illustration) in table 1.
Metrics and Metamodels for Mission-Based Assessment of Multi-Aircraft Force Compositions
51
Normalized aggregated criteria values can be given
in terms of System Performance Potential (SPP) be-
tween 0 for the lower and 100% for the upper bounds.
The benefit MoE and its criteria have positive σ.
The information gain measure aggregates the obser-
vation of entities, i.e. ground targets (GTs) or surface-
to-air missile (SAM) sites, in terms of the Johnson
criteria for optical detection, recognition, and iden-
tification (Harney, 2004), the area covered by sensor
footprints, and battle damage assessment (BDA). The
effect metric counts the lethal hits on adversary enti-
ties and measures the delays effected on the enemy by
nonlethal actions. The experience component quan-
tifies the knowledge gained from the mission execu-
tions for different areas of expertise (Seethaler et al.,
2021).
All effort items then have σ < 0. The risk metric
consists of measures of the aircraft’s own detectabil-
ity – being an important component of susceptibil-
ity (Ball, 1985) –, quantifications of being in the en-
gagement zone(s) of the enemy, and the risk allied
entities, e.g. ground forces, are exposed to during the
mission execution. Often overlooked but significant
(US Secretary of Defense, 2005) for detectability is
acoustic perceivability, which is used as a major crite-
rion that should be minimized during reconnaissance
and other operations. Further effort items are mone-
tary cost, e.g. for consumed fuel and spent armament,
own and allied losses of personnel and materiel, data
transmission and storage requirements, and logistics
effort. Times are usually desired to be low, e.g. obser-
vations and kills should happen as early as possible.
The criteria weights w
k
were adapted
from (Seethaler et al., 2020; Seethaler et al.,
2022), having been derived via FAHP (also see
chapter 2.1). While applying these metrics to data
from the simulation yields a measure of capability, a
measure of total systems effectiveness can be gained
by also considering reliability and availability by
probabilistic modelling (Habayeb, 1987).
3.2 Vignettes
Representative vignettes for important mission types
have been developed, each containing specific infor-
mation about adversaries and allies.
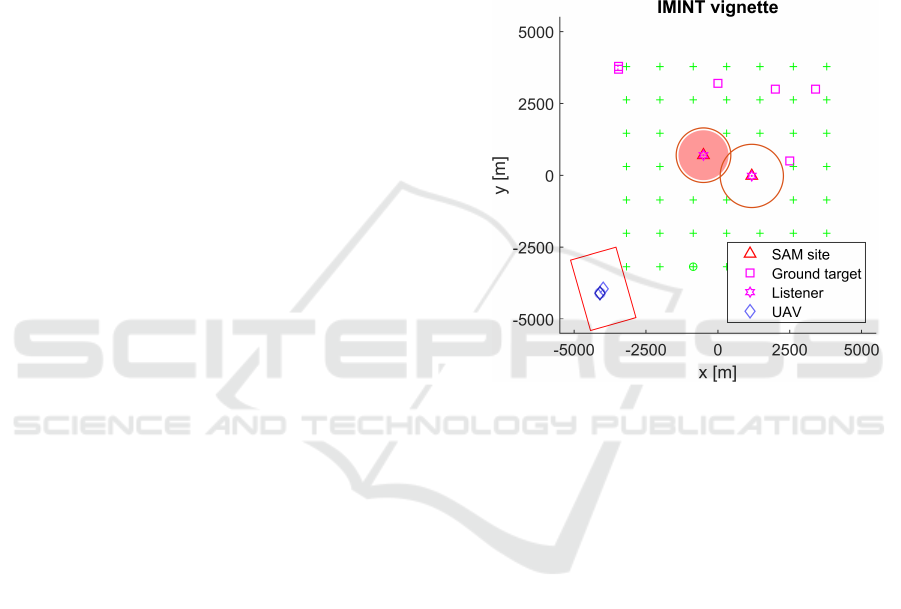
3.2.1 IMINT Vignette
The first vignette depicts a classic airborne Imaging
Intelligence (IMINT) mission, i.e. a reconnaissance
task, where a given area of interest is to be surveyed.
Its general setup is shown in figure 2. There are sev-
eral moving ground targets, mainly due north, which
are to be observed. Furthermore, there a two centrally
located SAM sites potentially threatening any aircraft.
At their position there also are “listeners”, accounting
for the acoustic detectability of aerial forces.
The concept of operations (CONOPS) prescribes
a coverage path plan over the area of interest, which is
generated by a travelling salesmen algorithm. All par-
ticipating aircraft, e.g. UAVs, have an electro-optical
(EO) sensor with a defined resolution and fixed field
of view (FOV) for the observation of the ground tar-
gets. This vignette has already been validated by
SMEs (Seethaler et al., 2022).
Figure 2: IMINT vignette setup: UAVs and sensor foot-
print, coverage path waypoints, adversary ground entities,
and SAM sites.
3.2.2 CAS Vignette
The second vignette is a Close Air Support (CAS) sce-
nario as depicted in figure 3. Here, the task of the
aircraft is to protect the ground allies moving to the
south-west from being destroyed due to coming into
contact range of adversary ground entities approach-
ing from the east. Initially all aircraft are assigned
waypoints of pre-planned circular holding patterns,
from which they can deviate when detecting a target
and/or being ordered by another aircraft. RoE only al-
low effects on opponent ground targets inside a spec-
ified killbox area and require BDA after any effector
release.
All aircraft are equipped with an EO sensor, some
possess a laser target designator, while others are
armed with air-to-ground missiles, which in turn re-
quire laser target designation. This requires coordina-
tion and communication between the differently out-
fitted aircraft, i.e. either requesting target illumination
or calling for an effector when having discerned an el-
igible target.
SIMULTECH 2023 - 13th International Conference on Simulation and Modeling Methodologies, Technologies and Applications
52

Table 1: Metrics vector overview: hierarchy of performance indicators.
MoE Criteria and sub-criteria Associated mission(s)
Benefit
Data exchanged IMINT, CAS, SEAD
Information gain
Entities
GTs detected, recognized, id’d
IMINT
SAMs
Area
Relative area
IMINT
Area per time
Battle damage assessment CAS, SEAD
Effect
Lethal
Ground targets CAS
SAMs SEAD
Nonlethal
Ground target time CAS
SAM time SEAD
Experience
AI
Planning
IMINT, CAS, SEAD
Operative
Human
Planning
Operative
Maintenance
Effort
Risk
Detectability
Instantaneous maxima
IMINT, CAS, SEAD
Time-integrated
Engagement Zone
In range
Evasive maneuvers
Others’ risk
Contact time ground CAS
Contact time air SEAD
Cost (monetary)
Preparation
IMINT, CAS, SEAD
Execution
Collateral CAS, SEAD
Losses
Own
Human
IMINT, CAS, SEAD
Machine
Allied
Human
CAS, SEAD
Machine
Data
Required data rate
Peak, average, min.
IMINT, CAS, SEAD
Latency
Required storage
Time
Mission duration
Operating time
First observation
Ground targets
SAMs
Last observation
Ground targets
SAMs
First kill
Ground targets
CAS, SEAD
SAMs
Last kill
Ground targets
SAMs
Logistics
Off-mission
Training
IMINT, CAS, SEAD
Logistics personnel
On-mission
Supplies
Support personnel
3.3 Simulation
For testing the measures, they are applied to data
from executions of the selected missions in a met-
rics testbed simulation environment (Seethaler et al.,
2021; Seethaler et al., 2022). This constructive simu-
lation environment is agent-based, which means every
entity is calculated with its individual observe-orient-
decide-act (OODA) loop (Boyd, 2018). Each agent’s
decisions are made by its own Behavior Tree (BT),
Metrics and Metamodels for Mission-Based Assessment of Multi-Aircraft Force Compositions
53
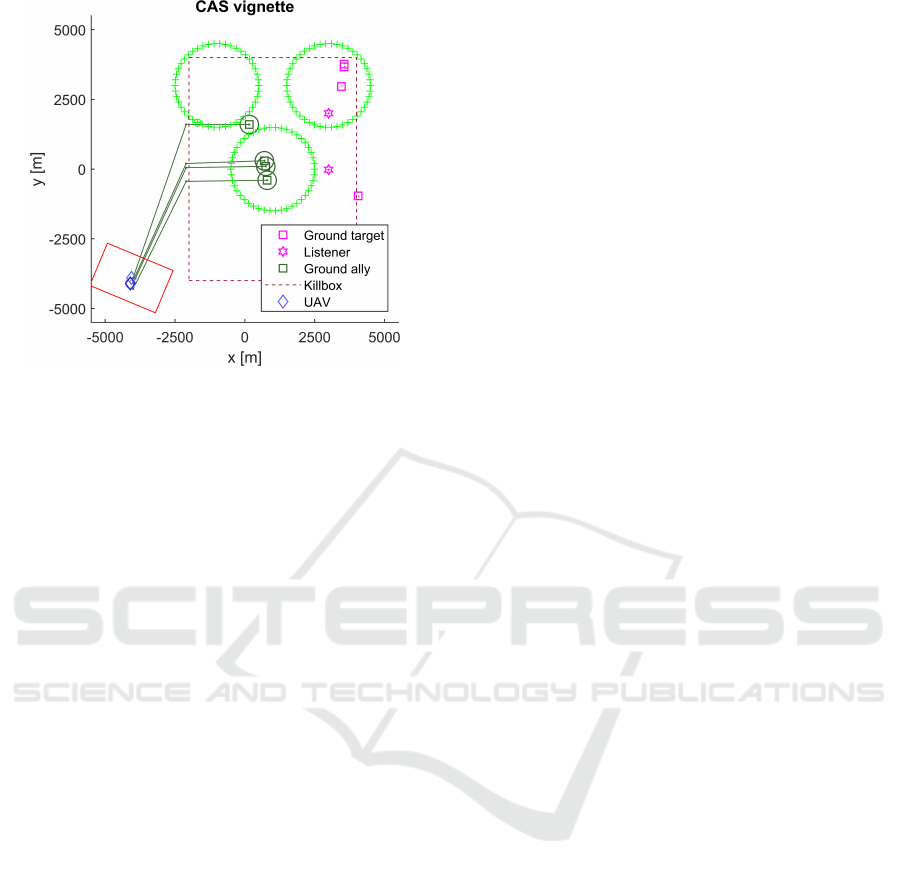
Figure 3: CAS vignette setup: UAVs and sensor footprint,
holding pattern waypoints, allied and adversary ground en-
tities, and killbox area limits.
which is customized for each vignette.
Aerodynamics (drag polars etc.) and engine fuel
flow and power data is provided for each aircraft type,
so fuel consumption is calculated – as in reality –
dependent on mass, altitude, and speed. Extra air
resistance, weight, and increased radar cross-section
(RCS) is introduced when an aircraft is equipped with
payload. Thus, when firing a missile, drag, weight,
and RCS is reduced.
The environment also allows Monte Carlo (MC)
runs. In these, mission execution variants with
specified force compositions and CONOPS can be
repeated in replications accounting for effects of
(pseudo)randomness, such as Global Positioning Sys-
tem (GPS) imprecision, missile hit probabilities, or
jamming impact on communications.
The software can provide overviews of intermedi-
ate and final mission result data in various diagrams,
e.g., heatmaps of the surveyed ground area. In addi-
tion to situational overview plots such as in figures 2
and 3, Tacview (Raia, 2023) is used for live and replay
3D visualizations, which are useful for SMEs retrac-
ing the progress of the respective operation.
3.3.1 Variants for IMINT
The variant specifications used for the IMINT mission
executions are listed in table 2. In all IMINT simula-
tion runs, homogenous force composition of MALE
UAVs were employed. All UAVs were equipped with
an EO sensor of the same focal length and the same
cruise altitude was set for all variants. The team sizes
ranged from one to five aircraft; 13 different sensor
resolutions were included in the training data set. The
training data set was completed by manually adding
the appropriate assessment values for zero UAVs and
zero-resolution sensor to the simulation results.
3.3.2 Variants for CAS
Table 3 shows the variants for the CAS mission runs.
For the purpose of this experiment, there was only
one configuration (distribution of target designators
and missiles) for each total number of UAVs. Starting
from the two-ship force, the larger teams were created
by alternatingly adding one UAV with a laser target
designator and one equipped with missiles. The test
data set contains mission results for 16 planned cruise
altitudes and four team configurations ranging from
two to five MALE UAVs. Due to the constant FOV of
the EO sensor, its footprint area depends only on the
flight altitude.
3.4 Metamodels
For deriving vignette-specific surrogate models, i.e.
mapping the input variables (variant configurations)
to assessment output, three regression methods were
used and compared. In all three methods several hy-
perparameters must be chosen, which was done in
MATLAB (The Mathworks Inc., 2022) by systemat-
ically modifying them while searching for the min-
imum estimated cross-validation loss. The resulting
metamodels were evaluated by checking their predic-
tions against a test data set generated by simulation
and measurement.
Based on the variants in tables 2 and 3, the pre-
dictor variables for the IMINT vignette model are the
number of UAVs and sensor resolution, whereas for
the CAS case the number of UAVs and cruise altitude
was considered. Discrete-valued variables were as-
sumed as continuous for simplification, but for those
any metamodel should only be evaluated at allowed
discrete values (Barton, 2020).
The following methods were tested:
3.4.1 Linear Regression
The Linear regression (LinR) model is a least squares
fit resulting in an analytical equation. It was derived
in a stepwise fashion using up to third degree polyno-
mials for each predictor.
3.4.2 Support Vector Regression
Support Vector Regression (SVR) is a supervised ma-
chine learning method popular for real-value func-
tion estimation (Awad and Khanna, 2015). Its gen-
eralization accuracy depends on parameter and kernel
choice (Cherkassky and Ma, 2004).
SIMULTECH 2023 - 13th International Conference on Simulation and Modeling Methodologies, Technologies and Applications
54

Table 2: Variant specifications overview for IMINT vignette simulation runs (training and test data).
Training data Test data
No. variants 54 10
No. replications 8 each 8 each
No. UAVs 1, 2, 3, 4, 5 1, 2, 3, 4, 5
Altitude [m] 3000 3000
EO sensor [Pixel] 1000x750 to 9000x6750 1500x1125, 5500x4125
Table 3: Variant specifications overview for CAS vignette simulation runs (training and test data).
Training data Test data
No. variants 64 16
No. replications 8 each 8 each
No. UAVs 2, 3, 4, 5 2, 3, 4, 5
Altitude [m] 1000 to 5000 750, 2625, 3625, 4750
EO sensor [Pixel] 4000x3000 4000x3000
The input data was standardized, the kernel was
Gaussian. Hyperparameters were chosen by Bayesian
optimization: The kernel scale and the box constraint
for the α coefficients were sampled on a logarith-
mic scale in the interval [e
−3
, e
3
], the half-width of
the ε-insensitive band in the range [e
−3
, e
3
]
iqr(y)
1.349
(with
iqr(y) being the interquartile range of the response
variable).
3.4.3 Neural Network Regression
Neural Network Regression (NNR) uses an artificial
neural network as a function approximator (Ertel,
2011). Feed-forward fully connected neural networks
were trained on standardized data using different acti-
vation functions (rectified linear unit, hyperbolic tan-
gent, sigmoid, and identity) with one, two, or three
hidden layers with one to 300 neurons each, sam-
pled on a logarithmic scale. The regularization term
strength λ was logarithmically sampled in
[e
−5
,e
5
]
n
observations
.
4 RESULTS
4.1 Results of Measurements on the
Simulation
Measurement results of relevant indicators from ta-
ble 1 on simulation data of the IMINT vignette are
shown in figure 4 grouped over the number of simu-
lated UAVs. The IMINT mission gives only minute
differences between replications, so the spread of the
boxplots is mainly due to the differences between the
variants specified in table 2.
Clearly, in the given mission time limit, more
ground entities are detected and more of the area of
interest is covered when more UAVs are used. How-
ever, target recognition and identification are also
massively dependent on EO sensor resolution as in-
dicated by the Johnson criteria. Detectability also in-
creases with the number of aircraft, as their – espe-
cially acoustic – emissions add up at the observation
points. Interestingly, the path planning in some cases
with three UAVs results in significantly higher peak
reflected radar power, as the outlier markers show in
this plot. The required data storage capacity increases
with the number of sensors, i.e. number of UAV plat-
forms, but also with the camera resolution. Cumu-
lative operating time only depends on the number of
employed aircraft.
Figure 5 then gives several higher level effective-
ness measures as normalized SPP rating, aggregated
by HWS. The overall assessment J (“Criteria Tree”)
indicates that for only one UAV the expected mis-
sion performance consistently is quite low, while for
higher numbers of aircraft the median, i.e. typical,
performance increases, but also the wider the perfor-
mance corridor becomes. The results at the “benefit”
SPP level reiterates that. The required effort also in-
creases with the number of UAVs, thus this rating is
almost linearly lower for higher n
UAV
. Information
gain, which aggregates the observations of entities
and scanned area, benefits from more aerial platforms
in the mission, but also depends on the used EO sen-
sor(s). Risk consists of observability and being too
close to SAMs’ engagement zones. The risk medians
for all amounts of UAVs are really close, but for five
UAVs it is apparently easier to plan coverage paths
around SAM engagement zones. Lastly, the mone-
Metrics and Metamodels for Mission-Based Assessment of Multi-Aircraft Force Compositions
55

tary cost component of effort has very little spread,
because it mainly depends on how many aircraft are
used.
The results for the CAS vignette simulation runs
are given in figure 6. Its boxplots show the cri-
teria data of training variants and replications de-
scribed in table 3 grouped over planned cruise alti-
tudes. Generally, the CAS mission executions yield
wider value spreads due to pseudo-random elements
in the replications probabilistically affecting commu-
nications and missile hits. The sensor footprint in-
creasing with cruise altitude not only results in more
targets properly assessed for battle damage, but also
in a larger ratio of covered area. The median num-
ber of ground targets destroyed also profits from the
higher altitudes via the larger sensor footprints, how-
ever even in lower altitudes some outliers also reach
higher numbers of destroyed ground targets. Also,
increasing the flight altitude reduces the acoustic de-
tectability by increasing the distance to the listeners.
However, there is no trend visible regarding the length
of time during which the force was acoustically de-
tectable, so it can be assumed to be quite independent
of the planned cruise altitude. The risk to the allied
ground entities directly corresponds to their respec-
tive losses. For these metrics, higher altitudes only
result in fewer losses in outliers, which in turn indi-
cate that more enemy ground entities were killed in
those simulation runs. The higher altitudes also ben-
efit the time from mission start to first/last kill, where
lower is better.
HWS-aggregated SPP ratings for the CAS mis-
sion executions are displayed in figure 7. The over-
all mission assessments J, the benefit and effect-level
SPP are low for lower altitudes, then increase, and for
higher altitudes they plateau again. The altitude vari-
able has little impact on the effort SPP, which mainly
depends on the number of UAVs. The boxplots for
gained experience are the same for all cruise alti-
tudes, as that choice does not have an impact on this
metric. In terms of cost there is a minimal decrease
because of better fuel economy at higher altitudes.
The overall risk assessment shows no trend over the
cruise altitude, except of a few outliers, also shown
in the “other’s risk” plot, as that corresponds to the
enemy contact times of the ground allies. The infor-
mation gain assessment is lower for higher altitudes,
because the sensor resolution remained constant, so
target identification and recognition decreased with
increasing distance.
4.2 Metamodels
The derived models are illustrated by partial depen-
dence plots in figures 8 and 9 for the IMINT and CAS
vignettes, respectively. These figures also show test
and training data values projected on the selected di-
mension in compact boxplots. Comparison of predic-
tions to test data using normalized root-mean-square
error (NRMSE) and Spearman’s rank correlation co-
efficient ρ yields the results given in tables 4 and 5.
NRMSE is defined as in equation 2 with ˆy
i
being the
predicted values and y
i
the true values with mean ¯y for
n test samples (Rocha et al., 2007):
NRMSE =
RMSE
¯y
=
q
1
n
∑
n
i=1
( ˆy
i
− y
i
)
2
1
n
∑
n
i=1
y
i
(2)
4.2.1 IMINT Metamodels
Linear regression on the IMINT training data yields
a polynomial with linear, quadratic, and cubic terms
with an intercept. It overestimates the performance of
zero (which should be zero) and five UAVs, slightly
underestimates the benefit assessment of one and four
aircraft, but is very near the median values for two and
three UAVs.
For the Gaussian kernel SVR, the plot indicates a
slight overfit, but still is a smooth curve. However, it
also fails the “sanity check” at zero UAVs.
The NNR uses hyperbolic tangent (tanh) activa-
tion functions, and has two hidden layers with eleven
and five neurons. It captures very well that only start-
ing at one UAV there can be any value to the mission,
then gives an almost linear increase in benefit with the
number of used aircraft.
NRMSE and ρ indicate acceptable fits for all
methods in the IMINT case, given the spread of the
input data. The NNR model has the lowest NRMSE
here.
4.2.2 CAS Metamodels
In the CAS case, the linear regression and SVR with
a Gaussian kernel give a similarly shaped curve with
unrealistic (non-zero) values for zero altitude and a
benefit turning point above 4500 m.
The NNR uses tanh activation functions, and three
hidden layers with two, one, and 76 neurons. Its “S”-
shaped curve in the CAS case indicates that a min-
imum cruise altitude is required, but gains in mis-
sion effectiveness are only to be made up to a certain
higher flight level. This gives it the most realistic in-
terpretation.
The ρ and especially NRMSE values are worse for
the CAS models than for the IMINT models, because
the CAS training and test data is significantly more
scattered.
SIMULTECH 2023 - 13th International Conference on Simulation and Modeling Methodologies, Technologies and Applications
56
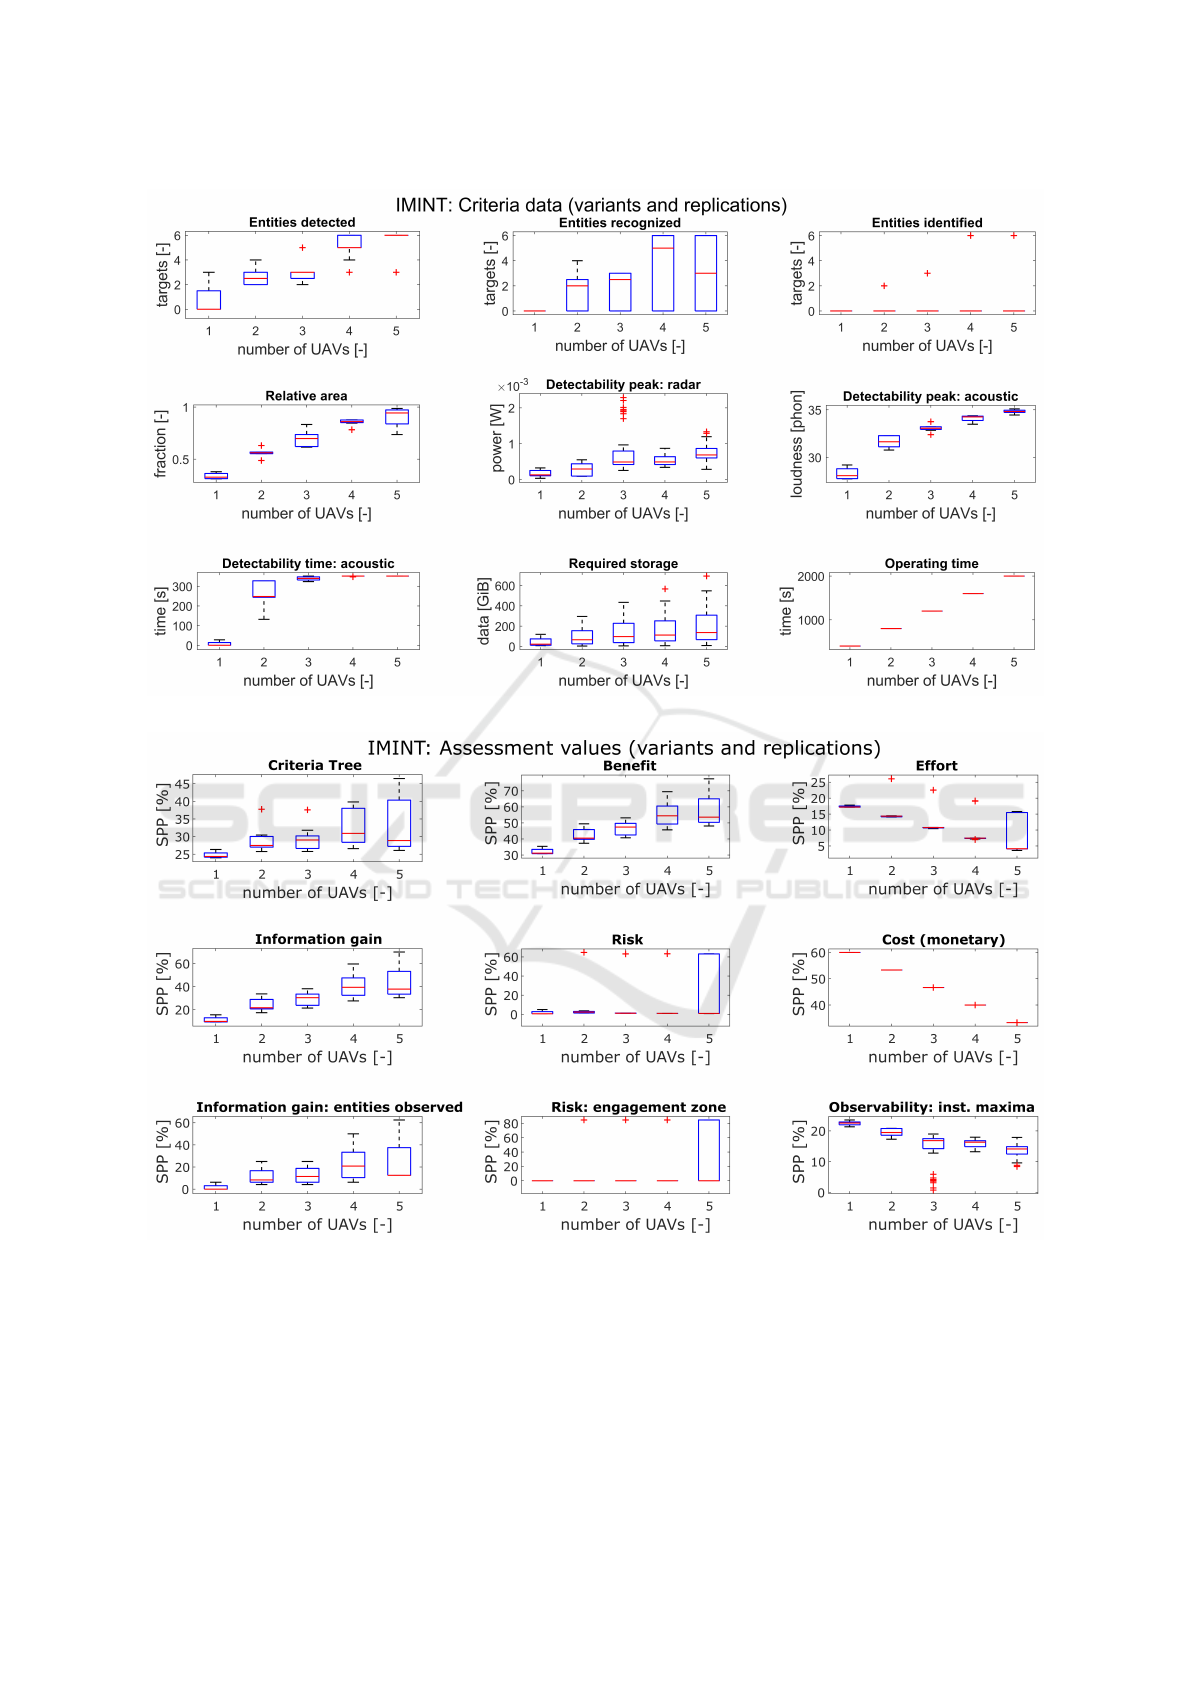
Figure 4: IMINT criteria measurement results. For criteria structure see table 1.
Figure 5: IMINT results for aggregated metrics. For criteria structure see table 1.
5 DISCUSSION
5.1 Metrics Evaluation
The application of the proposed metrics on data from
the simulation runs prove that they allow measuring
and visualization of how the overall mission effective-
ness (and its sub-criteria) depends on the force com-
position (e.g. number of UAVs and their equipment)
and mission plan (e.g. flight altitude). They trans-
Metrics and Metamodels for Mission-Based Assessment of Multi-Aircraft Force Compositions
57
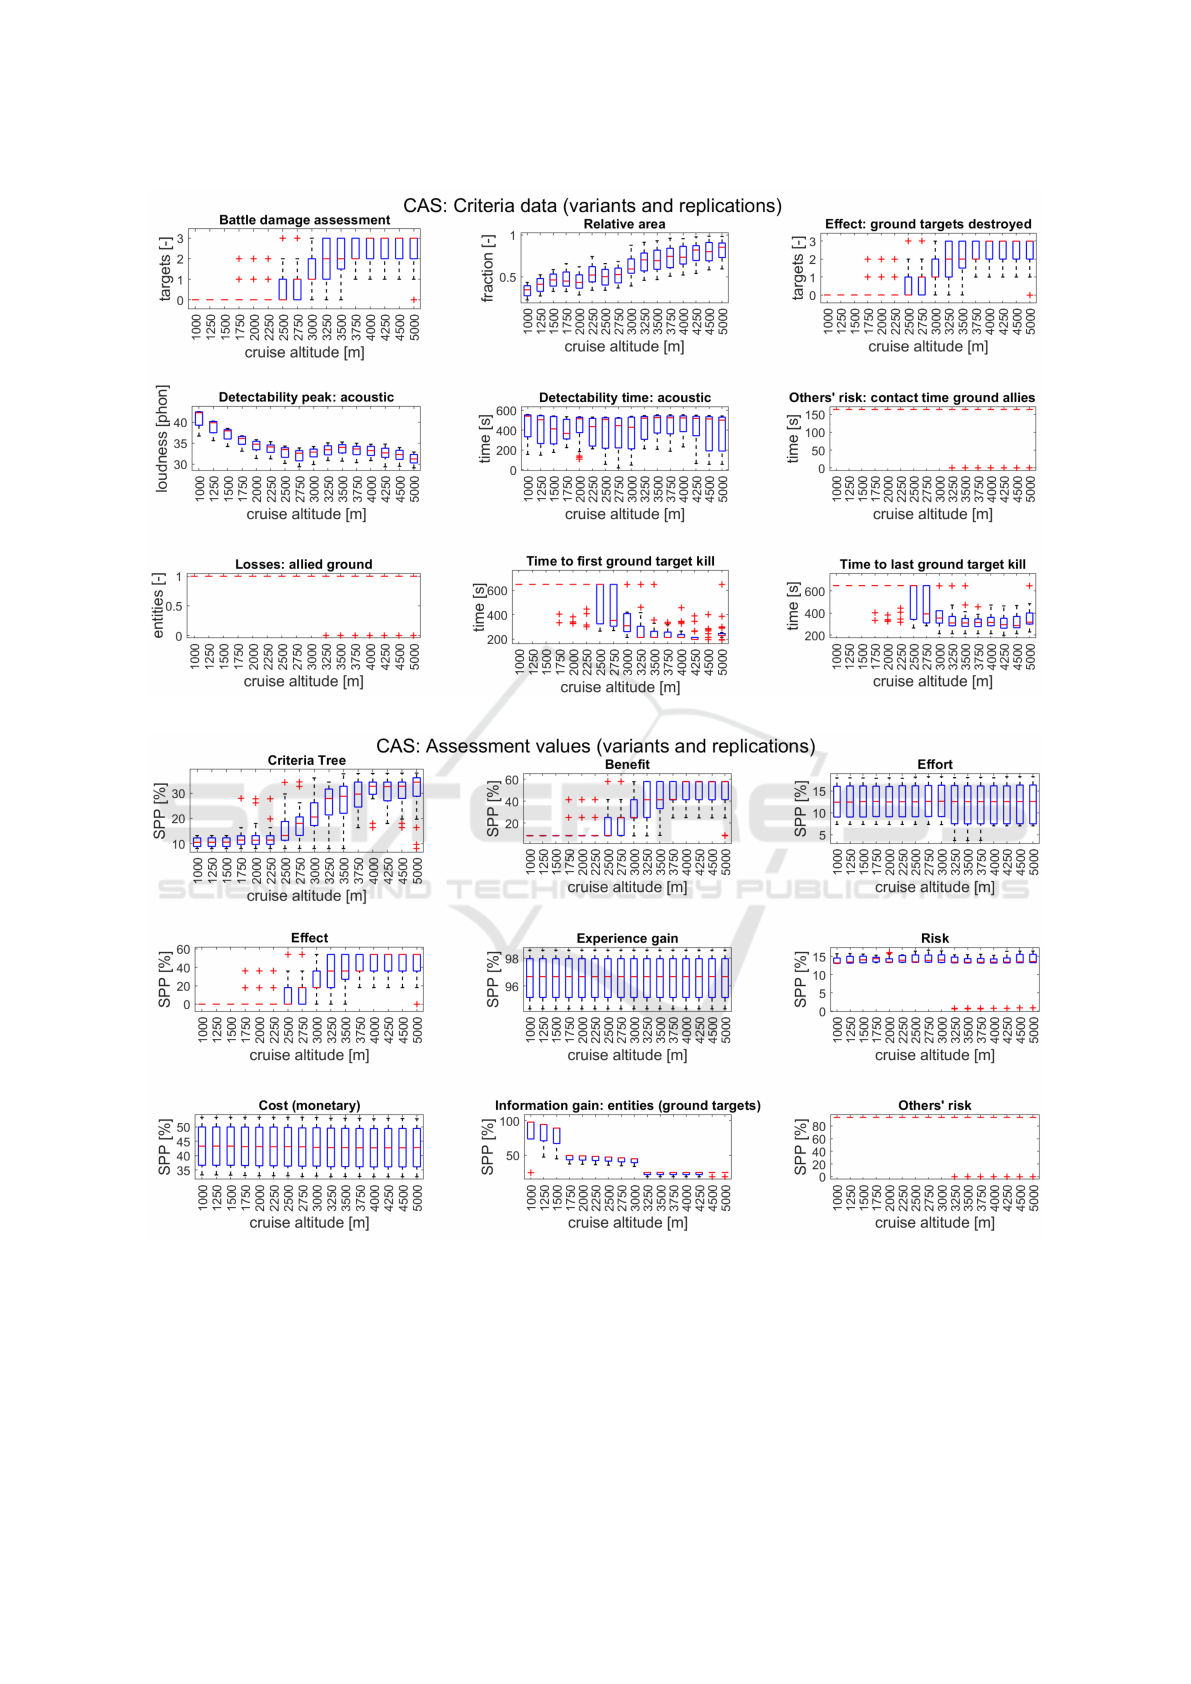
Figure 6: CAS criteria measurement results. For criteria structure see table 1.
Figure 7: CAS results for aggregated metrics. For criteria structure see table 1.
parently show the differences between force compo-
sitions and mission plans in terms of mission success
on all levels of the criteria hierarchy.
In both test vignettes, trends in SPP can be made
out and thus conclusions can be drawn, e.g. for
the IMINT mission a higher number of UAVs with
higher-resolution sensors should be chosen. For suc-
cess in the CAS mission, a minimum cruise altitude is
required, but it does not matter if the aircraft are not
able to go above a certain altitude.
SIMULTECH 2023 - 13th International Conference on Simulation and Modeling Methodologies, Technologies and Applications
58
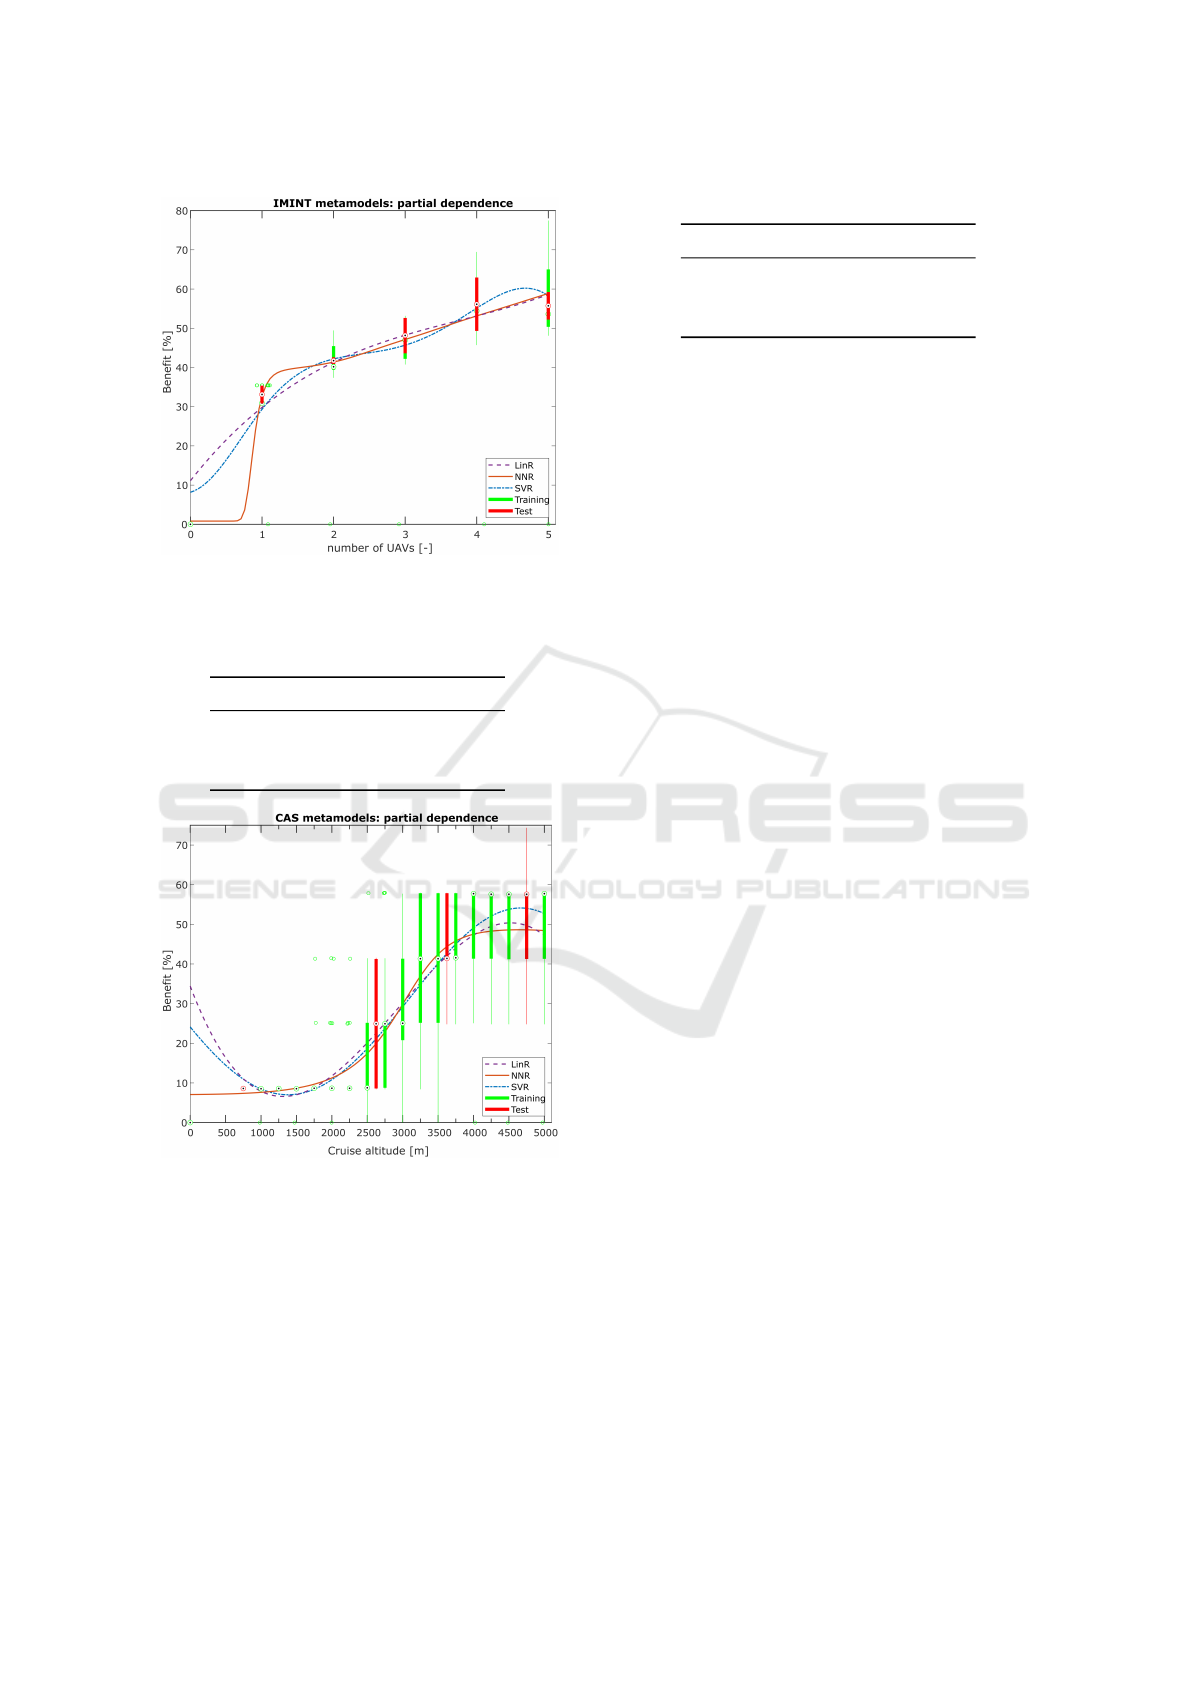
Figure 8: Partial dependence on number of UAVs of IMINT
vignette LinR, NNR, and SVR metamodels at “benefit”
node. Training and test data is shown as boxplots.
Table 4: IMINT vignette: metamodel measures for test data.
Metamodel NRMSE ρ
LinR 0.1084 0.9468
SVR 0.1151 0.9468
NNR 0.0791 0.8986
Figure 9: Partial dependence on cruise altitude of CAS vi-
gnette LinR, NNR, and SVR metamodels at “benefit” node.
Training and test data is shown as boxplots.
5.2 Metamodel Evaluation
The metamodels enable interpolation and to a degree
also extrapolation, but do not allow exact predictions.
Especially for the CAS case, they exhibit significant
expected deviations as indicated by the high NRMSE,
but broad trends are visible, certainly giving an idea
whether improvements can be expected from a change
Table 5: CAS vignette: metamodel measures for test data.
Metamodel NRMSE ρ
LinR 0.3467 0.8028
SVR 0.3496 0.8398
NNR 0.3558 0.8361
in force composition or mission plan. These trends
can also be confirmed from the SPP result boxplots
quite intuitively.
Overall, the obtained models seem acceptable,
but more optimized fits can certainly be obtained by
larger training data sets and further fine-tuning of hy-
perparameters, whilst avoiding overfitting. Generally,
the validity of metamodels is highly dependent on
generation of sufficient data points and thus DoE. Fur-
thermore, some caution is to be heeded when drawing
conclusions regarding the real world from these mod-
els, as their responses are heavily dependent on the
weights w
k
prioritizing the criteria, which in principle
can be arbitrarily set by decision makers/SMEs.
6 CONCLUSION AND
PERSPECTIVE
The presented concept enables the comparison of
teams of multiple aircraft in terms of capability as
part of total systems effectiveness, indicating which
of the force packages and/or mission execution plans
should be chosen. Concrete metrics for specific vi-
gnettes have been proposed to this end in this paper.
Using these, measurement results from constructive
simulation can be interpreted regarding the utility of
the respective multi-aircraft force compositions in the
vignettes.
Acceptable performance metamodels for the given
vignettes have been derived. These surrogate mod-
els can be useful tools to see trends in the data and
predict assessment results without explicit simulation,
but generalizing beyond the specific vignettes is not
recommended. In the given test cases, the NNR mod-
els should be preferred over the linear regression and
SVR fits.
In future research, the methodology should still be
validated by SMEs on a larger scale., i.e., over several
missions and including respective metamodels with
appropriate DoE. One approach would be to com-
pare their a priori estimates to results from simulation
and measurement. To introduce further interaction
complexity and interdependence in the force compo-
sition, a Suppression/Destruction of Enemy Air De-
fense (SEAD/DEAD) vignette has already been de-
signed and implemented as an additional test case. In
Metrics and Metamodels for Mission-Based Assessment of Multi-Aircraft Force Compositions
59

this, some or all UAVs possess an emitter-locator sys-
tem (ELS) and/or carry missiles, which may or may
not require laser target designation. Also, the metrics
pool could be expanded to more mission types and the
metrics could be tested for use in optimization.
REFERENCES
Awad, M. and Khanna, R. (2015). Efficient learning ma-
chines. The expert’s voice in machine learning. Apress
Open.
Ball, R. E. (1985). Fundamentals of Aircraft Combat Sur-
vivability. American Institute of Aeronautics and As-
tronautics.
Barton, R. R. (2020). Tutorial: Metamodeling for simula-
tion. In Bae, K.-H., editor, 2020 Winter Simulation
Conference (WSC), pages 1102–1116. IEEE.
Boyd, J. R. (1987, 2018). A Discourse on Winning and
Losing. Air University Press.
Brans, J. P., Vincke, P., and Mareschal, B. (1986). How to
select and how to rank projects: The PROMETHEE
method. European Journal of Operational Research,
24(2):228–238.
Cherkassky, V. and Ma, Y. (2004). Practical selection of
SVM parameters and noise estimation for SVM re-
gression. Neural Networks, 17(1):113–126.
Ernest, N. D. (2015). Genetic Fuzzy Trees for Intelligent
Control of Unmanned Combat Aerial Vehicles. Dis-
sertation, University of Cincinnati.
Ertel, W. (2011). Introduction to Artificial Intelligence. Un-
dergraduate Topics in Computer Science. Springer.
Feger, J., Fokina, E., and Hornung, M. (2018). An inte-
grated design process for mission optimized design of
unmanned aerial vehicles. In 2018 AIAA Aerospace
Sciences Meeting. American Institute of Aeronautics
and Astronautics.
Fokina, E., Feger, J., and Hornung, M. (2018a). A Mis-
sion Performance Evaluation Approach for Civil UAS
Applications. MATEC Web Conf., 221:05006.
Fokina, E., Feger, J., and Hornung, M. (2018b). An In-
tegrated UAS Design Optimization based on Mission
Assessment and Evaluation. In Deutscher Luft- und
Raumfahrtkongress 2018. Deutsche Gesellschaft f
¨
ur
Luft- und Raumfahrt - Lilienthal-Oberth e.V.
Habayeb, A. R. (1987). Systems Effectiveness. Elsevier
Science.
Harney, R. C. (2004). Combat Systems. Volume 1. Sensor
Elements. Part I. Sensor Functional Characteristics.
Kleijnen, J. P. (2009). Kriging metamodeling in simulation:
A review. European Journal of Operational Research,
192(3):707–716.
Morawietz, S., Strohal, M., and St
¨
utz, P. (2018). A deci-
sion support system for the mission-based evaluation
of aerial platforms: Advancements and final valida-
tion results. In 18th AIAA Aviation Technology, Inte-
gration, and Operations Conference 2018. Curran As-
sociates Inc.
Piercy, N. and Giles, W. (1989). Making SWOT Analysis
Work. Marketing Intelligence & Planning, 7(5/6):5–
7.
Raia, F. (2023). Tacview – The Universal Flight Data
Analysis Tool. https://www.tacview.net/, retrieved
24.04.2023.
Rains, D. A. (1999). Fleet mix mission effectiveness analy-
sis. Naval Engineers Journal, 111(1):65–81.
Rocha, M., Cortez, P., and Neves, J. (2007). Evolution of
neural networks for classification and regression. Neu-
rocomputing, 70(16-18):2809–2816.
Seethaler, J., Strohal, M., and St
¨
utz, P. (2020). Finding
Metrics for Combat Aircraft Mission Efficiency: An
AHP-Based Approach. In Deutscher Luft- und Raum-
fahrtkongress 2020. Deutsche Gesellschaft f
¨
ur Luft-
und Raumfahrt - Lilienthal-Oberth e.V.
Seethaler, J., Strohal, M., and St
¨
utz, P. (2021). Multi-UAV
Mission Efficiency: First Results in an Agent-based
Simulation. In Mazal, J., Fagiolini, A., Vasik, P., and
Turi, M., editors, Modelling and Simulation for Au-
tonomous Systems, number 12619 in Lecture Notes in
Computer Science, pages 169–188. Springer.
Seethaler, J., Strohal, M., and St
¨
utz, P. (2022). Measur-
ing Multi-UAV Mission Efficiency: Concept Valida-
tion and Enhanced Metrics. In Mazal, J., editor,
Modelling and Simulation for Autonomous Systems,
number 13207 in Lecture Notes in Computer Science,
pages 158–179. Springer.
Smola, A. J. and Sch
¨
olkopf, B. (2004). A tutorial on
support vector regression. Statistics and Computing,
14(3):199–222.
Stodola, P., Drozd, J., Nohel, J., Hodicky, J., and Proch
´
azka,
D. (2019). Trajectory optimization in a cooperative
aerial reconnaissance model. Sensors, 19(12):2823.
The Mathworks Inc. (2022). MATLAB 9.13.0.2166757
(R2022b Update 4).
US Air Force (2016). Small Unmanned Aircraft Systems
(SUAS) flight plan: 2016-2036.
US Secretary of Defense (2005). Unmanned Aircraft Sys-
tems Roadmap 2005-2030.
Whitcomb, C. A. (1998). Naval ship design philosophy im-
plementation. Naval Engineers Journal, 110(1):49–
63.
Zwicky, F. (1967). The morphological approach to dis-
covery, invention, research and construction. In
Zwicky, F. and Wilson, A. G., editors, New Methods
of Thought and Procedure, pages 273–297. Springer.
SIMULTECH 2023 - 13th International Conference on Simulation and Modeling Methodologies, Technologies and Applications
60
