
Production Quality Control Analysis
in Battery Product Quality Improvement Efforts
Sajiyo, Jaka Purnama, Siti Mundari,
,
Hery Murnawan and Elvia Defitriana
Industrial Engineering, University of 17 August 1945, Surabaya, Indonesia
1412000189@srel.untag-sby.ac.id
Keywords: Quality, Control, Repair, Batteries.
Abstract: Product quality improvement is carried out continuously to reduce defective products. Many factors affect the
quality of battery products not in accordance with the desired planning in the production department. Quality
control is used to measure the requirements that must be met in forming product specifications according to
actual standards. The process of controlling the quality of battery products is used to measure the quality
characteristics of the products produced and compare them with the specifications or product quality
requirements set by the company, as well as to analyse the quality of the products produced using statistical
methods. Analysis of product quality control is able to improve quality improvement. Data patterns from
statistical methods show patterns that can be used as a basis for determining battery product standards. Based
on the analysis of the data on the factors that affect the cause of product defects, the machine factor has a
probability of 66.25%, the human factor has a probability of 27.50%, the material factor has a probability of
3.75% and the method factor has a probability of 2.25%. Improvements in battery product quality control that
need to be prioritized are machine and human factors.
1 INTRODUCTION
PT. TBA is a company engaged in the manufacturing
industry that produces battery products. These battery
products can be used for industrial and motor vehicle
purposes. Battery production activities are carried out
on Jl. Raya Trosobo Krian-Sidoarjo. Production
results are used to meet local and international
markets in the form of exports to several countries.
After the end of the Covid 19 pandemic, orders for
battery products have increased.
Increasing orders from several countries has
forced companies to increase battery production, K.
Turcheniuk, (2021). In fulfilling the demand for
ordering battery products, the company added a lot of
new workers. Most of the new workers do not have
good skills in the field of battery production so that
many reject (defective) products are found.
According to Kampker, (2012), the product quality
control section pays little attention to the
specifications required for the product. According to
product standardization that is not going well, the
product that has been sent to the customer must be
returned to the company and must be re-processed.
According to Rahul Panat, VD (2014), the re-
production process makes product prices cheaper and
has an impact on reducing profits that will be received
by the company.
PT. TBA is a company that manufactures
batteries. Starting in 2022 the export market will
increase, but many buyers complain, because the
product quality is not as expected. From the
observation results it is known that the data on
production defects shows a positive trend (tends to
increase).
Analysis of production quality control is carried
out by companies in an effort to improve the quality
of battery products, Pearn WL, Shu MH, Hsu BM,
(2005) . The factors that influence the rejected
product are carried out to improve production results.
Factors that affect production in producing defective
products include humans, machines, methods,
materials and the environment. The company
conducts analysis and looks for the root causes of the
increase in the number of defective products, so that
in the coming year it is expected that sales can be
increased. According to M. Duquesnoy, (2021), that
presumption was that before carrying out the analysis,
an evaluation was carried out that the main cause of
product defects was due to equipment that needed to
Sajiyo, ., Purnama, J., Mundari, S., Murnawan, H. and Defitriana, E.
Production Quality Control Analysis in Battery Product Quality Improvement Efforts.
DOI: 10.5220/0012101900003680
In Proceedings of the 4th International Conference on Advanced Engineering and Technology (ICATECH 2023), pages 285-291
ISBN: 978-989-758-663-7; ISSN: 2975-948X
Copyright
c
2023 by SCITEPRESS – Science and Technology Publications, Lda. Under CC license (CC BY-NC-ND 4.0)
285

be repaired, a large number of new workers, and work
methods that were not yet well standardized. The
company seeks to find out the main causes of
defective products by using the cause and effect
diagram method.
Based on the problems that occurred in the
company, it shows that the increase in the production
time period experienced an increase in rejects that
occurred even though it was still within control limits.
Many factors that affect the cause of product defects
when carrying out production activities have not been
identified in detail. The company is trying to take
action to reduce the number of rejected products
which continues to increase. The company strives to
be able to fulfil all product requests according to
consumer needs.
The company continuously improves the quality
of battery products according to the set targets, K o
lmel A , (2014) . Many problems occur in improving
product quality in accordance with consumer
expectations. The research objectives to be achieved
are to analyze rejects that occur even though they are
still within control limits, find out the factors that
cause defective products, and improve production
activities in an effort to reduce the number of rejects.
2 RESEARCH METHODS
2.1 Quality
Quality is basically conformity to requirements or
requests, suitability for use, continuous improvement
or improvement, and something that can satisfy
customers. Many also define that quality is the totality
of features and characteristics of a product or service
that has the ability to satisfy needs, either stated
explicitly or impliedly. The term requirements are
defined as the specifications stated in the contract as
well as the criteria that must be defined beforehand.
Quality also means fitness for use. Quality is anything
that fulfills a want or satisfies a customer's need.
According to Goodenough J.B., Kim Y., (2009),
quality is conformity with market or consumer needs.
A quality company is a company that controls market
share because its production results are in accordance
with consumer needs, resulting in consumer
satisfaction. If consumers are satisfied, they will be
loyal in buying the company's products in the form of
goods or services.
Product quality needs to pay attention to the
production process, to guarantee the resulting product
is free from defects. According to J. Schmitt et.al.,
(2014) , there are several dimensions of quality as
follows: (a) Performance is the suitability of the
product with the main function, (b) Features are
product characteristics, (c) Reliability is customer
trust in the product, ( d) Conformance is the
suitability of the product with certain requirements or
sizes, (e) Durability is the level of product durability
or product longevity, (f) Servicebility is the ease of
the product to be repaired, (g) Aesthetics is the beauty
or attractiveness of the product, (h) Perception is
consumer fanaticism or product reputation
2.2 Factors Affecting Quality
According to Suyadi (2002: 16) product quality is
determined by several factors, including: (a) Design,
(b) Raw materials, (c) Manufacturing methods or
processes, (d) Shipping and packaging methods, (e)
Technological developments and service method.
The various levels of quality standard control must
conform to the planned quality standard. According
to Suyadi (2002: 7) product quality standards can be
determined as follows: (a) raw material quality
standards, (b) process quality standards, (c) semi-
finished goods quality standards, (d) finished goods
quality standards, and (e ) Standard administration,
packing, and product delivery.
The objectives of quality control in general are (a)
The final product has specifications in accordance
with established quality standards, (b) So that design
costs, inspection costs, and process costs become
more efficient. According to Kampker , (2012),
inspection or checking is an important part of quality
control. Inspection includes determining whether
inputs or outputs meet company quality standards.
The purpose of inspection is to stop processes that
cause defective products, stop services (services) that
are not useful. Inspections can be carried out at the
workplace (floor inspection) or at a central inspection
site.
2.3 Quality Improvement Techniques
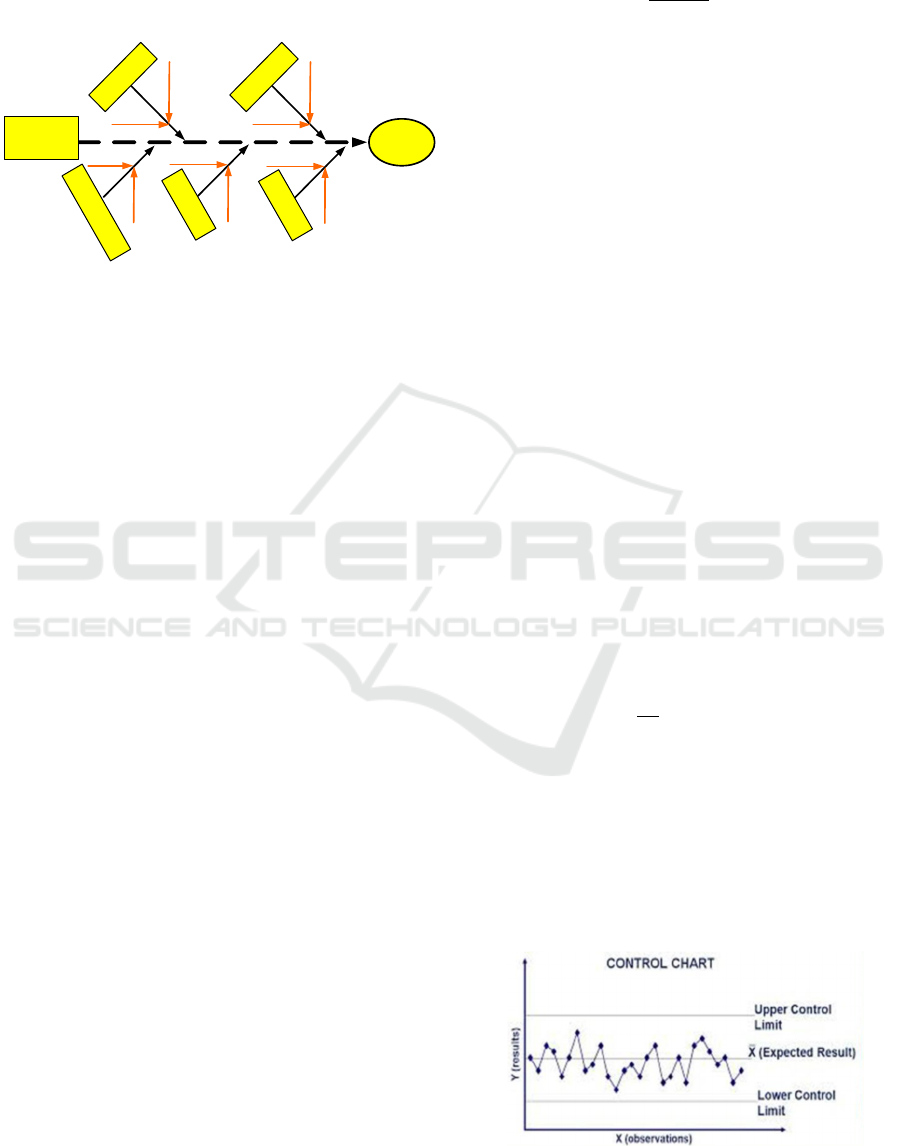
A causal diagram, also known as a fishbone chart, is
a tool for identifying process elements (causes) that
might influence outcomes, Sakti A, (2015) This
diagram depicts a diagram (shaped like a fishbone)
for the everyday quality control problems of a
dissatisfied company customer. Each "bone"
represents a source of error. The Operations Manager
starts with five categories, namely Man (people),
Machine (equipment), Material, Method, and
Environment referred to as 5M which is the cause.
A fishbone diagram is a method/tool that helps
identify, sort, and display various possible causes of
ICATECH 2023 - International Conference on Advanced Engineering and Technology
286
a problem or certain quality characteristics. The
fishbone diagram illustrates the relationship between
the problem and all the causal factors that influence
the problem that occurs.
M
a
n
Reason
Reason
M
a
n
Reason
Reason
E
n
v
i
r
o
n
m
e
n
t
Reason
Reason
M
e
t
h
o
d
Reason
Reason
M
a
t
e
r
i
a
l
Reason
Reason
Quality
Problem
Conse-
quence
Figure 1: Cause and effect diagram.
The function of the fishbone diagram is to identify
and organize the possible causes of a specific effect
and then isolate the root causes. The causal conditions
that may be carried out in the analysis are to enlarge
or reduce the desired result.
The manufacturing industry in production
activities greatly benefits by conducting a hypothesis
using a fishbone diagram, Shinde, VM (2014).
Classic problems that often occur will be more visible
including: production delays, high product defect
rates, production machines often experience trouble,
unstable production line output which results in
chaotic production planning, productivity that does
not reach targets and customer complaints which
keeps repeating.
2.4 Process Capability
Process Capability is the ability of a process to
produce a product/service that meets consumer
needs/requirements or expected specifications. So
process capability analysis is a step that must be taken
when carrying out process quality control.
Requirements for the implementation of process
capability analysis. If we already know how our
process is (voice of process), of course we want to
compare it with the specifications set by the customer
(voice of customer). According to Shinde, VM (2014)
, process capability analysis describes process
performance in producing products according to the
desired specifications. Process capability analysis can
be expressed as the probability of producing
unsuitable characteristics when the process is in
control.
Process capability analysis using the "Process
Capability Ratio". A symmetrical process capability
ratio has a symmetrical distribution which is
calculated by the following formula:
𝐶𝑝
(1)
The results of the analysis are known for Cp =
process capability, USL = Upper Specific Limit, LSL
= Low Specific Limit, σ = process standard deviation
value, µ = process average value, if Cp value > 1
means the natural tolerance limit is still within control
limits.
2.5 Data Collection
The research was conducted at a battery production
company, PT. TBA domiciled in Sidoarjo, research
was conducted for 2 months starting from September
1
st
2022 to October 30
th
2022. Data collection was
carried out by observation and interview methods to
obtain data about the general description of the
company, the production process, the amount of
production, and the number of defective products at
each stage of work.
2.6 Data Analysis Methods
Analysis of data uniformity is also called data
distribution analysis, to determine data uniformity,
Zhang ZJ , et.al., (2013) . Data is called uniform if the
spread of data does not exceed predetermined control
limits, both upper control limits, Rifan Hariri, RA
(2013). To find out whether the data is uniform or not,
the "P-Chart Diagram" formula is used as follows:
UCL X
kδ (2)
X
∑
(3)
LCL X
kδ (4)
The control limit of the graph is known from the
value of UCL = upper control limit, LCL = low
control limit, X ̅= average measurement data, k =
adjustment constant for the confidence level of the
data, if the data confidence level is 99% then k =
3.95% then k = 2 , and below 95% then k = 1. Data
distribution is controlled by an X-Chart Diagram as
shown in Figure 2. as follows:
Figure 2: X–diagram.
Production Quality Control Analysis in Battery Product Quality Improvement Efforts
287
According to Zhang ZJ , et.al. (2013), the percentage
of damage (reject) is analyzed using a pareto chart, if
it turns out from the results of the X-Chart diagram
the data is outside the control limits, then the data
needs to be analyzed using a pareto chart to sort.
based on the level of proportion of damage, starting
from the highest level of damage to the smallest.
According to Rukmana, PW (2015), This pareto plan
will help to focus on the more common and
significant product defect issues or those that will
provide major benefits. The data is processed to
determine the percentage of damage which is
calculated by the formula:
Tk =
𝑥 100% (5)
The value of Tk = Damage level, Σkj = Total
damage of a certain type, ∑k = total damage. If the
damage level is Tk ≤ 2.5% = Mild, Tk > 2.5 - 5.0 =
Moderate, Tk > 5.0 – 7.5 = High, Tk > 7.5 = extreme.
Causal analysis of a quality problem using a
causal diagram. cause and effect diagram is used as a
technical guideline for the operational function of the
production process to maximize the success value of
the quality level. Cause and Effect Diagram or often
referred to as a cause and effect diagram.
This analysis is to determine the process potential
index or known as Process Capability (Cp) which is
obtained by comparing the specification range with
the process range with the following formula:
Cp
(6)
The analysis is carried out by knowing the value,
Cp = symmetric process capability ratio value, UCL
= upper specification limit, LCL = lower specification
limit, δ = process standard deviation value. If the Cp
value > 1 means that the natural tolerance limits are
within the UCL and LSL, or within the control limits.
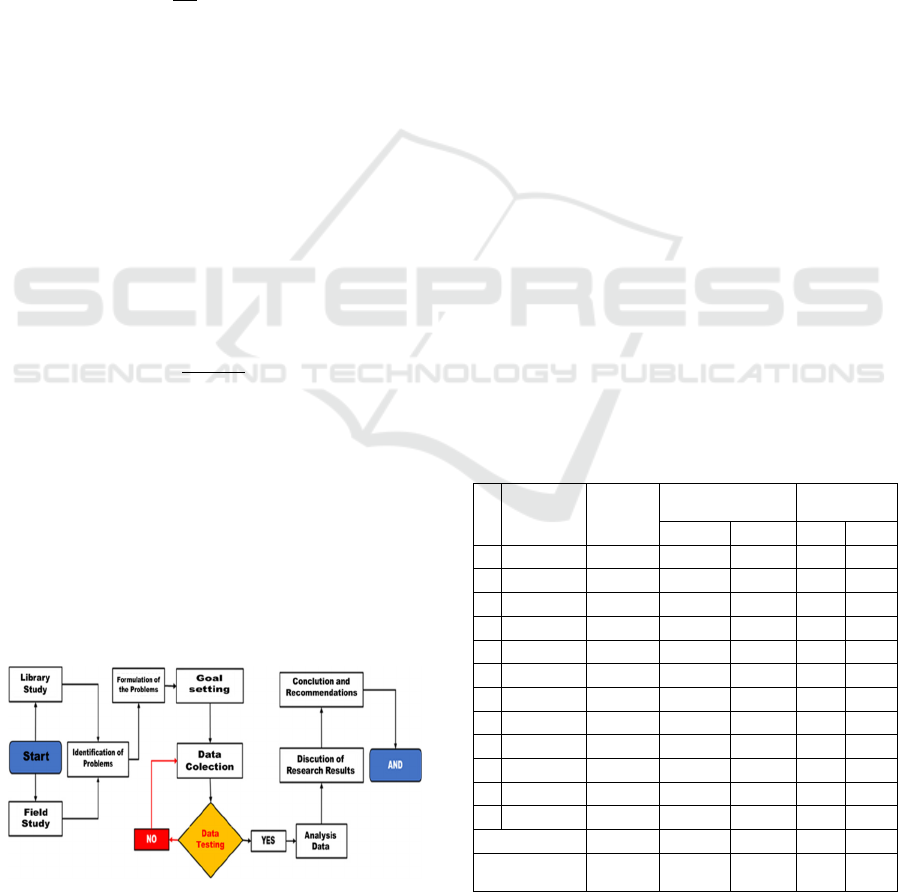
2.7 Research Flow Chart
Research Flowchart to find out the flow of research
implementation as shown below:
Figure 3: Research flowchart.
Before data analysis is carried out, the data taken
from the observations is tested to find out whether the
amount of data is sufficient and uniform, as a
reference for fact indicators, if the numbers are
considered not representative of facts, then additional
observation data. added, as well as if the data
distribution is not normal or not. If the data is
uniform, then data that is outside the control limits is
considered defective data and must be discarded and
replaced with new ones.
3 RESULTS AND DISCUSSION
Data analysis based on production output obtained
from data processing shows that the total production
output, including the number of good products and
the number of defective products is shown in the
following table 1.
Based on the data in table 1. above, it can be
concluded that the average production yield is
54,237/month, the average number of defective
products is 515 (0.94%)/month. Analysis of the Trend
of Defective Products based on data on the number of
defective products as shown in the following figure 4.
Based on Figure 4 above, it can be concluded that
the average defective product is 0.94%, in terms of
the relatively small percentage of defects, but the
number of defects tends to form a positive trend
(increases every month). Means there is a process
change that causes an increase in the number of
defects.
Table 1: Production data.
N
o.
Product
Period
Number
of
Product
Good
Produc
t
Product
Defects
Total % Total %
1 january 33862 33706 99.54 156 0.46
2 February 43754 43457 99.32 297 0.68
3 march 63577 63097 99.25 480 0.75
4 April 56643 56206 99.23 437 0.77
5 may 66325 65772 99.17 553 0.83
6 june 57874 57354 99.10 520 0.90
7 July 45673 45256 99.09 417 0.91
8 August 65276 64662 99.06 614 0.94
9 September 57802 57151 98.87 651 1.13
10 October 62975 62249 98.85 726 1.15
11 November 43826 43233 98.65 593 1.35
12 December 53255 52528 98.63 727 1.37
Total Product 650842 644671 1188.75 6171 11.25
Average
Produc
t
54237 53722.58 99.06 515 0.94
ICATECH 2023 - International Conference on Advanced Engineering and Technology
288
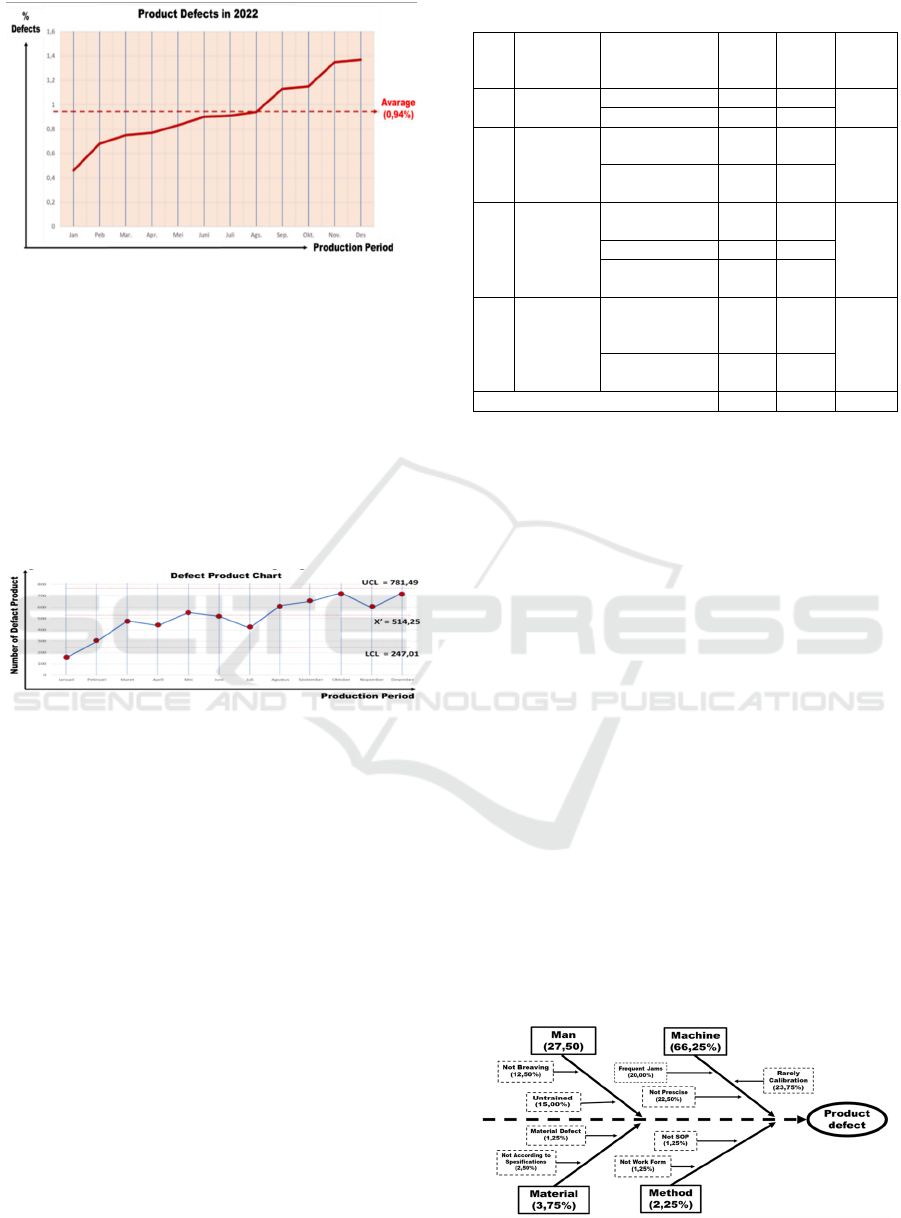
Figure 4: Graph of defective product trends.
Based on Figure 4 above, it can be concluded that
the average defective product is 0.94%, in terms of
the relatively small percentage of defects, but the
number of defects tends to form a positive trend
(increases every month). Means there is a process
change that causes an increase in the number of
defects.
Analysis of Defective Product Control Limits
based on data on the number of defective products as
in table 1. above, then analysed with an X-Chart
diagram as shown in the following figure 5.
Figure
5: X -chart
diagram
.
Based on the X-Chart Diagram above, it can be
seen that the average number of defective products =
515, Upper Control Limit (UCL) = 781.49 (782),
Lower Control Limit (LCL) = 247.01 (248), there is
1 (one) data that is outside the control limits, and the
chart shows a positive (increasing) trend. This
indicates a continuous change of process equipment
which causes product defects. For this reason, product
quality control needs to be improved in the
production process tool.
Analysis of the Causes of Product Defects based
on the fishbone diagram (Ishikawa) is used to explore
the causes of defects in detail, the data on the causes
of product defects as shown in table 2 below.
Table 2: Causes of Product Defects.
No
Causative
factor
Type
Because
Score
(0–
100)
%
Score
%
Factor
Score
1 Man
Untrained 60 15.00
27.50
No briefing 50 12.50
2 Ingredients
Not according to
specifications
10 2.50
3.75
Raw material
defects
5 1.25
3 Machine
Breaks
frequently
80 20.00
66,25 Not exactly 90 22.50
Rarely
calibrated
95 23.75
4 Method
Not Standard
Operational
Process
5 1.25
2.50
No form of
activity
5 1.25
TOTAL 400 100 100
Based on Table 2. it can be concluded that there
are 4 factors that cause product defects, namely: the
human factor consists of 2 variables that cause many
product defects, namely an untrained workforce and
no breaving/coordination before work. Material
factors consist of 2 variables that cause product
defects, namely materials not according to
specifications, and raw materials used in defective
conditions. The engine factor consists of 3 variables
that cause product defects, namely the machine often
jams, the machine placement is not precise, and the
machine is not calibrated. The method factor consists
of 2 variables that cause defective products, namely
there is no Standard Operating Procedure (SOP), and
there is no work form.
Based on the analysis, it shows that work
environment factors do not have much effect on
production results. A work environment that meets
predetermined standards, so that the workforce is able
to carry out production activities properly. The work
environment does not affect the use of work
equipment and materials used to make battery
products.
The Fishbone Diagram is used to explore the
causes of defects in detail as shown in Figure 6 below:
Figure 6:
Fishbone
Diagram
Production Quality Control Analysis in Battery Product Quality Improvement Efforts
289

Today Ishikawa diagram analysis can be
concluded that of the 4 causes of product defects the
biggest causes are machines with a probability value
of 66.25% and humans with a probability value of
27.50%. Improvements are a priority scale in the
process of product quality control, it is necessary to
increase machines and humans. Machine and human
factors have the greatest probability of causing
defective products.
Product quality control is carried out by
improving machine factors, namely minimizing the
occurrence of machine stops when carrying out
production activities, setting the machine according
to the desired product standard so that production
results have a high precision value. The next engine
factor improvement is to periodically re-calibrate
(calibrate) so that the size of the machine is always
precise. Product quality control is carried out by
treating the workforce to training and direction from
leaders every time they do work in the form of
coordination. The human factor requires high work
experience so that production results get better by
increasing skills, motivation, and selecting foremen
who are able to influence subordinates to improve
product quality.
4 CONCLUSIONS
The total production yield is 650,842/year with an
average of 54,237/month, good products are
644,671/year with an average of 53,723/month, and
defective products are 6,171/year with an average of
515/month. Based on the data, it can be seen that total
production in 2022 has not been achieved, and every
production period (every month) there are always
defective products with an average of 514.25
(0.94%). The trend of defective products shows an
average percentage of good products at 99.06%, and
defective products at an average of 0.94%. Judging
from the percentage of defective products of 0.94%,
it can still be tolerated, because the tolerance for the
number of defective products <2% is relatively small,
but the number of defects tends to form a positive
trend (increases every month). Means there is a
process change that causes an increase in the number
of defects
Control of Defective Products from the X-Chart
diagram shows the average number of defective
products = 514.25 (515), Upper Control Limit (UCL)
= 781.49 (782), Lower Control Limit (LCL) = 247.01
(242) , there is 1 (one) data that is outside the control
limits, and the chart shows a positive trend
(increasing). It was concluded that there was a
continuous change of process equipment which
caused product defects. For this reason, product
quality control needs to be improved in the
production process tool.
The biggest causes of product defects are the
machine factor with a probability of 66.25% and the
human factor with a probability of 27.50%. The
product quality control process needs to be improved
on machines and humans. Controlling product quality
by carrying out machine repairs, namely carrying out
repairs and calibrating machines on a regular basis.
Product quality control is carried out by treating the
workforce, namely training and directing each time
they carry out work.
REFERENCES
Gooddenough JB, Kim Y. (2009). Challenges for
rechargeable Li batteries. Chemisty of Materials 22
(2009) 3, 587-603.
J. Schmitt, A. Raatz, F. Diatrich, K. Droder, J. Hesselbach.
(2014). Process and performance optimization by
selective assembly of battery electrodes. CIRP Annals-
Manufacturing Technology 63, 2014, Pages 9-12.
K. Turcheniuk, D. Bondarev, GG Amatucci G. Yushin
(2021). Battery material for low-cost electric
Transportation Mater Today, 42 (2021), pp. 57-72.
Kampker, A.; burggraf, P.; deutskens, C.; Heimes, H.:
Schmidt, M. (2012): Process alternatives in the battery
production. Electrical Systems for Aircraft, Railway
and Ship Propulsion (ESARS). Bologna, Italy, 1-6.
Kolmel A, Sauer A, Lanza G. (2014). Quality-oriented
production planning of battery assembly system for
electric mobility. Procedia CIRP 23 149-154.
M. Duquesnoy, I. Boyano, G. Larraitz, P. Cereijo, A.
Alixabete, A. Franco (2021). Machine Learning-Based
on Assessment of the Impact of the Manufacturing
Process on Battery Electrode Heterogeneity Energy AI,
5 (2021).
Pearn WL, Shu MH, Hsu BM. (2005). Monitoring
Manufacturing Quality for Multiple Li-BPIC processes
based on capability index Cpmk. International Journal
of Production Research 43 (2005) 12, 2493-2512.
Rahul Panat, VD (2014). The Application of Lean Six
Sigma to the Configuration Control in Intel's
Manufacturing R&D Environment. International
Journal of Lead Six Sigma Vol. 5 444.
Rifan Hariri, R.A (2013). Application of the Six Sigma
Method as a Remedial Effort to Reduce
GREENFIELDS Milk Pack Defects. Journal of
Agricultural Technology Vol. 14. No. 2, 141-150.
Rukmana, PW (2015). Product quality control with a Six
Sigma Approach and Kaizen Analysis and New Seven
Tools as an Effort to Reduce Product Defects. Journal
of Technology, Vol. 8 No. 1, 65-74.
ICATECH 2023 - International Conference on Advanced Engineering and Technology
290

Sakti A, Michalek JJ, Fuchs ER, Whitacre J F. (2015) A
Techno-economic Analysis and Optimization of Li-ion
Batteries for Light-ducty Passenger Vehicle
Electrification. Journal of Power Sources 273 (2015),
966-980.
Shinde, VM (2014). Application of 7 Quality Control Tools
for Continuous Improvement of Manufacturing
Processes. International Journal of Engineering
Research and General Science Vol 2 Issue 4, 364-371.
Zhang ZJ, Ramadass P. (2013) Lithium-Ion Battery
Systems and Technology. In: Brodd R J. Batteries for
Sustainability. New York, NY: Springer New York.
319-357. ISBN: 978-1-4614-5790-9.
Production Quality Control Analysis in Battery Product Quality Improvement Efforts
291
