
Scientometric Analysis of Fake News Detection and Machine Learning
Based on VOSviewer
Lumbardha Hasimi and Aneta Poniszewska-Mara
´
nda
a
Institute of Information Technology, Lodz University of Technology, Ł
´
od
´
z, Poland
Keywords:
Fake News Detection, Machine Learning, Scientometrics, VOSviewer.
Abstract:
This study presents a comprehensive analysis of recent research patterns and progress in the field of fake
news detection and machine learning. By examining 2209 publications from 2015 to 2022, the study aims
to identify the most fre-quently developed topics and explore the involvement of publications, authors, and
institutions. Using the network visualizing tool VOSviewer, a quantitative analysis is performed to investi-
gate research productivity, patterns, and keyword distribution. This study contributes to the understanding of
the current state of research in fake news detection and machine learning, and offers valuable in-sights for
researchers, policymakers, and technology developers seeking to ad-dress the challenges posed by fake news
and disinformation. The findings indi-cate that fake news detection research is still in its early stages and
primarily focuses on social media and social contexts. There is a growing interest in the subject, as evidenced
by increasing attention from the research community, whereas the network of interconnected research clusters,
highlights the multidis-ciplinary nature of fake news detection.
1 INTRODUCTION
The spreading potential of fake news has become one
of the biggest challenges in recent years. The massive
dissemination of information has emerged as a fright-
ening issue worldwide. The prevalence of fake news
has been present for a long period, however with the
advancements of mass media, it has come to be one of
the biggest concerns of the online world. According
to new Central Statistics Office (CSO) data, almost
two-thirds of Internet users have been exposed to on-
line content they considered to be not true or doubtful
in 2021 (CSO, 2020). Fake news creates an adverse
impact in every area, be it defaming, changing pub-
lic opinion on political opinion, or simply financial,
entertainment, and/or personal gain (Choras, 2020).
Initiatives of considerable significance have
started from a worldwide perspective. The Interna-
tional Grand Committee (IGC) on Disinformation and
Fake News is among the created boards focused on
technology and media companies, and accountability
in fake news issues (Tavares et al., 2017). The prob-
lem of fake news has grown into a major challenge
for many societies. This phenomenon reaches poli-
tics, organizations, and individuals having an impact
a
https://orcid.org/0000-0001-7596-0813
in different spheres. The most recent example of the
proliferation and risk of fake news dissemination is
the spread of anti-vaccination misinformation or the
rumours regarding the incorrectly compared number
of registered voters in 2018 to the number of votes
cast in US Elections 2020 (Reuters, 2021). Its preva-
lence has shown certain patterns, especially during
certain periods. For instance, elections, outbreaks etc.
Therefore, it is critically important to stop the spread
of fake news at an early stage.
However, with the ongoing technological ad-
vancements, the format of fake news is advancing as
well. In recent times, the detection of multimodal for-
mat is becoming an issue on the rise. Visual and video
propagation are new domains concerning the research
community (Rohman et al., 2021; Jain and Kasbe,
2018). False information also attracts the attention
of academia from various disciplines. Current knowl-
edge bases struggle to validate false news effectively
when it is linked to time-critical events as there is a
lack of supporting claims or facts (Vinhas and Bastos,
2022). Furthermore, the nature of the data and the
structure of the raw fake information, does not fol-
low a particular pattern. Researchers have attempted
in recent years to uncover problems with false news
and offer solutions, especially regarding social media
and dissemination. Nevertheless, according to (Paor
548
Hasimi, L. and Poniszewska-MaraÅ
ˇ
Dda, A.
Scientometric Analysis of Fake News Detection and Machine Learning Based on VOSviewer.
DOI: 10.5220/0012128300003538
In Proceedings of the 18th International Conference on Software Technologies (ICSOFT 2023), pages 548-555
ISBN: 978-989-758-665-1; ISSN: 2184-2833
Copyright
c
2023 by SCITEPRESS – Science and Technology Publications, Lda. Under CC license (CC BY-NC-ND 4.0)

and Heravi, 2020) not only the online solutions are a
tool to fight fake news, the literacy and education are
also essential in combating the spreading of false in-
formation. The academic community has risen up to
the challenge, investigating the causes, the scope and
scale, the detection method, and how they spread to
avoid their dramatic impacts (Wang, 2020; Gerbina,
2021).
With the rapid increase in the spread of fake news,
the research community most prominently observed
AI use in the cause against fake news dissemination.
Particularly, the use of machine learning as a promis-
ing solution, especially regarding the real-time fac-
tor. Machine learning can be used to track and anal-
yse information that can be validated by a legitimate
medium and this way automate the review process,
without human intervention (Alharbi et al., 2021). Al-
though it is difficult to prevent the creation and spread
of fake news articles, machine learning algorithms
can be employed to detect anomalies and patterns
(Khalil et al., 2021; Agrawal et al., 2021) that can lead
to the prevention of fake news spreading. The use of
a machine learning approach against fake news and
disinformation can not only increase the efficiency
against the scalability of fake news but also speed up
the prevention/detection process. Many researchers
have tackled the issue of fake news detection in terms
of machine learning methods (Tavares et al., 2017;
Khalil et al., 2021; Agrawal et al., 2021; Biwalkar
et al., 2021; Abdulrahman and Baykara, 2020; Babu
et al., 2022). To analyse further such contributions,
through the scientometric analysis method it is possi-
ble to investigate the quantity and quality of research
on this topic. Articles related to fake news detection
have attracted interest, and given the numbers, last
five years the topic of fake news detection has shown
a rapid increase. Thus, this study aims to delve into
existing sources in order to provide a comprehensive
and objective analysis of fake news detection, under
different criteria and analysis.
The objective of this study is to ultimately help
in the selection and identification of core literature in
the field, the latest trends, and developments in fake
news detection, while comprehensively investigating
the most recent advancements in academia and the re-
search community.
The paper is structured as follows: Section 2
presents the overview of methodology used for the
conducted research and experiments. Section 3 de-
scribe the details of analysis of publishing patterns,
while section 4 deals with the research productivity
and research impact in the area of fake news and dis-
semination.
Table 1: PICO strategy – Keywords and synonyms.
Keyword Synonyms Related to
detection classification Intervention
identification
verification
fake news disinformation Population
fake information
false news
misinformation
machine
learning
supervised methods, unsupervised
methods, reinforcement learning
Intervention
2 METHODOLOGY
The study utilizes data from the Scopus dataset as one
of the largest scientific databases of multi-disciplinary
publications (Schotten et al., 2017). The collection
of relevant publications and citations establishes the
foundation for a scientometric analysis of a specific
research area (Mazov et al., 2020; Khokhlov, 2020).
This study covers a big number of peer-reviewed ar-
ticles published in the last six years. Through this,
we seek to attain evidence regarding fake news de-
tection and machine learning. To achieve the objec-
tive of this study we processed indexed publications
of the highest quality. For the scientometric study,
formalized keywords are of crucial importance in the
process of data collection. After the formalization of
keywords, we designed and ran the following search
query: TITLE-ABS-KEY ( ( ”fake news” OR ”disin-
formation” OR ”fake information” OR ”false news”
OR ”misinformation” ) AND ( ”detection” OR ”clas-
sification” OR ”identification” OR ”verification” ) )
AND ( ”machine learning” ) AND PUBYEAR ¿ 2014
AND PUBYEAR ¿ 2014. The final query was ob-
tained considering the keywords and synonyms using
PICO model – search strategy presented in table 1.
Considering that the collection of relevant pub-
lications and citations is the foundation for a sci-
entometric analysis, we gathered data for a specific
span of years, from 2015 to 2022. All the available
results from the executed query had been exported
and recorded as a dataset file. The data visualiza-
tion constructions, network assessments, and cluster-
ing performed are conducted with the support of the
VOSviewer program (van Eck and Waltman, 2010;
(SMU), 2020). VOSviewer is developed as a power-
ful software for constructing and visualizing biblio-
metric networks and keyword occurrences, allowing
manipulations with a large number of data extracted
from some of the most-known databases (van Eck and
Waltman, 2010). The program allows data visualiza-
tion that makes it possible to have a fully detailed ex-
amination of specific data. To achieve a fuller and
Scientometric Analysis of Fake News Detection and Machine Learning Based on VOSviewer
549

Table 2: Results of number of publications per year.
Year Documents RGR
2022 606 0.11
2021 685 0.66
2020 352 0.49
2019 215 0.89
2018 88 0.84
2107 38 1.24
2016 11 0.32
2015 8 -
more complete map it was aimed in getting as greater
number of connections as possible. To ensure consis-
tent analysis, we focused on parameters such as the
type of publication, citation patterns per author and
institution, research productivity, and keyword analy-
sis.
2.1 Data Processing
The data collected from Scopus resulted in 2017 pub-
lications. Besides the query parameters, no other fil-
ters were applied, as the quantity of the publications
is sufficient for the scientometric analysis. The scien-
tific input in the database through the observed years
is presented in table 2. As seen from the results, the
highest increase in publications. Moreover, Scopus
with the new version offers even more advanced func-
tionality to export structured data. In order to investi-
gate the research productivity, several attributes of the
collected data were utilized to analyse various aspects
of publications.
To ensure the data is all accurate with no informa-
tion missing, the final number of publications retained
2003, containing 7413 keywords in all keyword’s unit
analysis. The most productive year in terms of impact
and the number of papers published, resulting also in
the highest relative growth rate (Baskaran, 2022) from
year to year, is 2021 with almost double the number
of records compared to 2020 (Equation 1).
Equation 1. The calculation of relative growth
rate
RGR = (lnN
2
− lnn
1
)/(t
2
− T
1
)
Selection of inappropriate form of publication has
an influence in the visibility of research, hence its im-
pact as well. For this reason, we decided to analyse
which type of publication venue, the majority of the
researchers in this study convey their insights.
Table 3 indicates that conference papers make
the most of the document types, with an average of
57.8%, whereas an average of 98.9 percent of these
studies are written in the English language. In this
surely has an influence on the fact the majority of re-
search is from the Computer Science discipline, and
as well the most dominant having conference papers
Table 3: Publications and language.
Type Percentage
Document
type
Conference Paper (57.9%), Article (32%),
Book Chapter (3.2%), Conference Re-
view (3.3%), Review (2.2%), Book (0.1%),
Data Paper (0.1%), Letter (0.1%), Re-
tracted, Editorial, Note, Short Survey, oth-
ers (0.1%)
Language English (98.9%), Chinese (0.4%), Por-
tuguese (0.4%), Others (0.3%)
as the primary means of publication (Heilig and Vob,
2014). Nevertheless, another explanation lies in the
fact that the topic is quite novice, and the timely pre-
sentation is important to consider, especially when
dealing with a rapidly growing issue.
2.2 Research Patterns and Units
In order to measure the research impact, we imple-
mented citation analyses, specifically the number of
current citations per author, document, and institu-
tion. The scientometric approach of the article is de-
signed to explore such interactions at the levels of
topics, publication venues, disciplines, and institu-
tions. Similarly, co-citation analyses were also exe-
cuted, in order to observe a relational dimension of
the research network. This resulted in the formation
of connections between authors, articles, and institu-
tions, which are the foundations of this study. The
option of citation-based clustering in VOSviewer of-
fers visualised groups of data that share significant
similarities. This helps to draw connections and dif-
ferentiations of the data into separate categories. To
have even more comprehensive overview, the overlay
option builds maps representing the timeline with dif-
ferent colours. In particular, this approach allows to
identification of research fronts based on relationships
between the data and follows the evolution of the re-
search by means of spatial connotations such as dis-
cipline, fields and other parameters, visualized across
time (van Eck and Waltman, 2010).
Keyword Analysis and Other Relevant Aspects
To further explore key topics and aspects of fake
news detection and machine learning we implemented
the co-occurrence analyses, in order to build key-
word clusters and observe the most frequent keywords
against intersections with other fields. To clearly ob-
serve the spectrum of keywords, we used full calcula-
tion methods to obtain a theme map of author key-
words and all keywords. The data were extracted
from the title and abstract and processed using the full
counting method.
ICSOFT 2023 - 18th International Conference on Software Technologies
550

3 ANALYSIS OF PUBLISHING
PATTERNS
To have a wider view in the basic structure of fake
news in machine learning research we analysed the
data from different perspectives. The analysis con-
sists of a distribution of the involved research disci-
plines, the contributing institutions, the number of au-
thors and the distribution of documents.
3.1 Academic Disciplines
We start with analyses of academic disciplines in or-
der to obtain an understanding of the general structure
and the development of the subject. The distribution
of publications for the entire period of six years is pre-
sented in figure 1.
It is evident the contribution in the Computer Sci-
ence subject is nearly constant throughout the years,
whereas the number of contributions in other disci-
plines slightly changes, especially last three years.
This indicates that the effects of fake news detection,
and its intersection with other disciplines is still at a
developing point.
The results reveal the strict inclusion of three main
subjects in the topic of fake news detection, namely
Computer Science, Engineering, and Mathematics.
However, in 2021 there was a slight trend of Decision
Sciences to take over Mathematics, especially if such
results are compared to 2015 and 1016. In particular,
the peak popularity of the subject is distinct during the
Covid-19 pandemic, which had a huge impact on the
research output (Raynaud, 2021). According to the
search result on the title and abstract content, out of
the whole number, 153 of the publications are Covid-
19 related to fake news, dissemination, datasets, etc.
This implies that research activities during this period
were partially affected by the ongoing situation.
To further evaluate research productivity, it is cru-
cial to identify the most active research institutes in
the field. Such insight is useful in building research
collaborations and reflecting on a global scale con-
cerning the distribution of research (Srainternational,
2020).
Figure 2 shows the rankings of research institutes
ordered by the number of publications. Evidently,
the numbers demonstrate a dominance of publications
from Indian institutions. Delhi Technological Univer-
sity, as one of the most reputable institutions in India,
has the highest number of publications. Followed by
Arizona State University and the Chinese Academy
of Sciences. Most of these institutions have an ex-
cellent reputation in research and attract some of the
best scientists in the field with broad knowledge and
expertise.
In order to observe the research productivity,
while considering the limitations of the methods used,
we focus on the number of papers per author, along-
side citation patterns and numbers.
3.2 Co-Authorship Distribution
Analysis
To obtain a deeper insight into contribution patterns,
we further investigate the distribution of publications
per citation and authorship patterns. The majority of
the research on fake news detection is carried out by
researchers from India, given the individual produc-
tivity.
To provide sufficient insight into the relevance of
the contributions we also run the co-authorships anal-
ysis, alongside the citation analysis – presented in the
next section. We analysed co-authorship with units of
analysis of authors using the full counting method to
get the authors’ collaboration network.
Figure 3 shows 11 clusters of constructed patterns
in the authors’ collaboration network. The criteria of
a minimum number of documents per author was set
to 2, and to ensure the selection of high-impact data,
the number of citations per author was set to 50. Thus,
out of 4798 authors, only 74 are presented in the map
creation. The largest clusters of collaboration patterns
are between researchers of clusters 1 and 2, both con-
taining 13 items. As seen from the figure, inter-cluster
collaboration is more common among the leading au-
thors. These authors have collaboration in wide as-
pects of fake news detection and machine learning.
Some of the authors with various collaborations are
Nakov, P., Shu, K., Liu, H., Da San Martino, G.,
Alam, F. Collaborative work is very important, espe-
cially in the case of an issue with the interdisciplinary
outcome. Hence, through collaborative work not only
productivity is affected, but also author and publica-
tion visibility is influenced by positive network mem-
bership, given the case of influential outlets.
3.3 Frequent Keywords and Keyword
Clusters; Co-occurrence Network of
High-Frequency Keywords
Keywords indicate the core fields of concern and
represent an effective instrument in the classifica-
tion of the content of scientific work. From a
meta-perspective, keywords are the foundation for
analysing the key topics and aspects representing a
particular research area (Heilig and Vob, 2014). Co-
occurrence analysis of keywords, not only help in
Scientometric Analysis of Fake News Detection and Machine Learning Based on VOSviewer
551
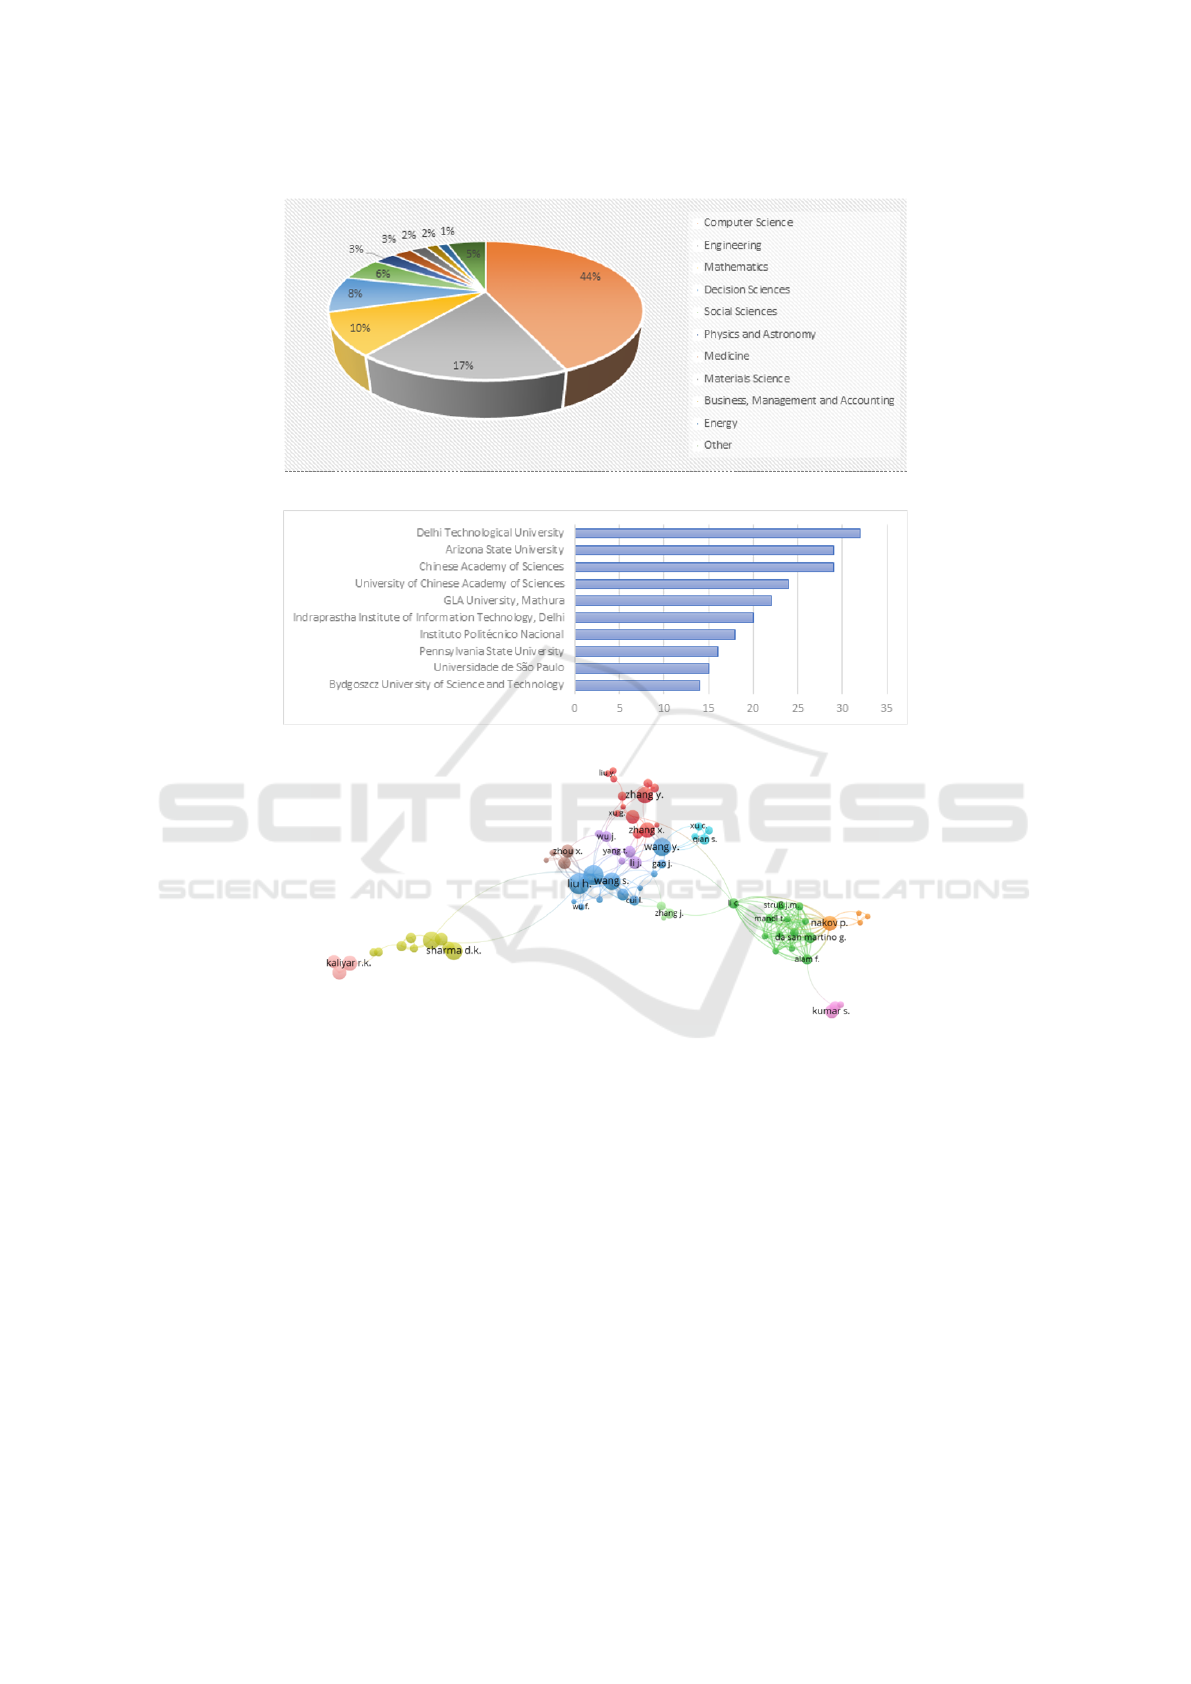
Figure 1: Distribution of documents per discipline.
Figure 2: Distribution of documents per affiliation.
Figure 3: Co-authorship analysis map per author unit.
quick identification of popular topic within a time-
frame but also help in pointing out aspects and topics
related to each other. For this reason, we decided to
observe closely the distribution of keywords, in both
units: all are indexed (Fig. 4).
The observed papers comprising research related
to fake news detection machine learning provide 7413
keywords in total. The most often cited expressions
are: ”social networking (online)” (711), ”fake de-
tection” (711), ”fake news” (697), ”social media”
(613), ”fake news detection” (474), ”machine learn-
ing” (411). According to (Guo et al., 2017), using
the relevant formula, the number of high-frequency
keywords recommended for further analysis of co-
occurrence should include 100 high-frequency key-
words. On the other hand, for the 7 clusters ob-
tained out of 314 words, as classified by VOSviewer,
have the following dominant key-words per cluster:
the first cluster shows the foremost keyword ”social
network online” and ”fake news”, the second cluster
”fake news detection”, the third cluster ”fake detec-
tion”, the fourth cluster ”natural language process-
ing”, the fifth cluster ”social media”, the sixth clus-
ter ”embeddings”, the seventh cluster ”machine learn-
ing”. The results of the keyword analysis further re-
vealed that the there is a tendency of approaching fake
news detection mainly through the lenses of social
media and social context.
Nevertheless, using VOSviewer, out of the to-
tal number of keywords, only 314 met the threshold
of the minimum occurrences per keyword set to 10,
while being classified in 7 clusters. In the map pre-
ICSOFT 2023 - 18th International Conference on Software Technologies
552
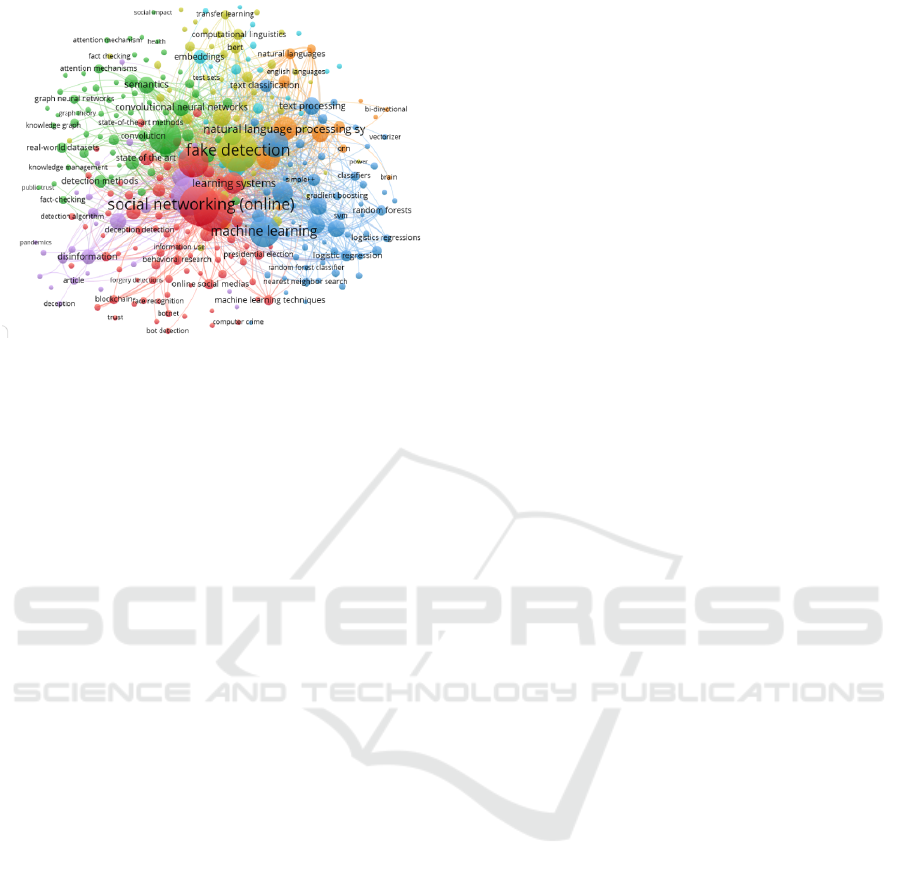
Figure 4: Co-occurrence analysis – all keywords.
sented, the size of nodes manifests the frequency of
keyword’s occurrence, while lines show relationships
among keywords (Table 4).
4 RESEARCH PRODUCTIVITY
AND RESEARCH IMPACT
Having the numbers that provide insights into pub-
lishing patterns alone is not sufficient to clarify the
impact of research. One of the primary concerns of
a scientometric study is to assess the impact of such
contributions. A measure for analysing the impact of
contributions is the aggregated number of citations a
publication receives (Heilig and Vob, 2014). To mea-
sure the research impact, we applied citation and co-
citation analysis at individual and institutional level
(Fig. 5).
For citation analysis using the author unit, out of
4798, 64 meet the threshold. To create the map of
citations per author, the minimum number of doc-
uments per author was set to 5, and the minimum
number of citations per an author was set to 50. As
a result, a network of 58 items (the largest set of
connected items) was created, consisting of 8 clus-
ters (Fig. 5). The biggest cluster, consists of 12 au-
thors, depicted in red colour, and shows the network
of some of the most productive authors such as Liu,
H., Sharma D.K., Shu, K.
To receive the co-citation analysis of institutions,
the minimum contribution was set to 1, and the min-
imum number of citations to 50. In return, 56 items
were mapped (Fig. 6). Out of the overall number of
items, 9 clusters were obtained, with the first cluster
being the largest – consisting of 12 items, whereas the
smallest the last one consisting of 3 items.
Reference co-citation analysis is one of the most
important tools to analyse and reflect the evolutionary
process in a particular scientific activity (Ding et al.,
2021). We received overall 57, 355 cited references,
for the co-citation network, out of which only 26 are
represented below in the network, following the 20
citations per reference criteria. Figure 7 shows the
mapping on the co-citation of references.
The red colour cluster indicates the first cluster,
which through network lines identifies the references
cited in the common paper. The frequency is depicted
through the size of the dot – in this case, the reference
point. From this network, 4 clusters were acquired,
having the first cluster consisting of 9 items, and the
smallest cluster 4, consisting of 5 items. The first
cluster encompasses research regarding techniques,
perspectives, and methods of fake news and its de-
tection. The second cluster concentrates on fake news
detection in social media and its detection within the
social context. The third cluster investigates infor-
mation credibility and fake news spreading patterns.
The fourth cluster focuses on the machine learning
approach, results, and efficiency of models. These re-
sults indicate that there is rapidly growing research on
the topic of fake news detection and machine learn-
ing, especially in terms of inter-institutional and inter-
disciplinary collaboration.
5 CONCLUSIONS
The latest trends and developments in fake news de-
tection have shown increasing attention from the re-
search community. The subject is gaining a lot of at-
tention from an interdisciplinary scope, posing a chal-
lenge to many research fields. In this study, we con-
duct a scientometric analysis to comprehensively in-
vestigate the trends and developments in fake news
detection and machine learning literature. To analyse
publication patterns, research productivity, and iden-
tify various sources while investigating the biggest
contributions per author and institution, we conducted
a quantitative analysis using the network visualizing
tool VOSviewer. The results of the study revealed
that the research is currently dominated by computer
science and conveyed especially through conference
proceedings. The research activity is mainly influ-
enced by highly recognised scientists and publica-
tions, carried out by some of the most reputable in-
stitutions worldwide. Concerning keyword analyses
it was drawn to conclusion that the current focus of
fake news detection lies mainly on social media and
social contexts of fake news detection.
Furthermore, intersections of fake news detection
and machine learning have shown to be cutting-edge
Scientometric Analysis of Fake News Detection and Machine Learning Based on VOSviewer
553
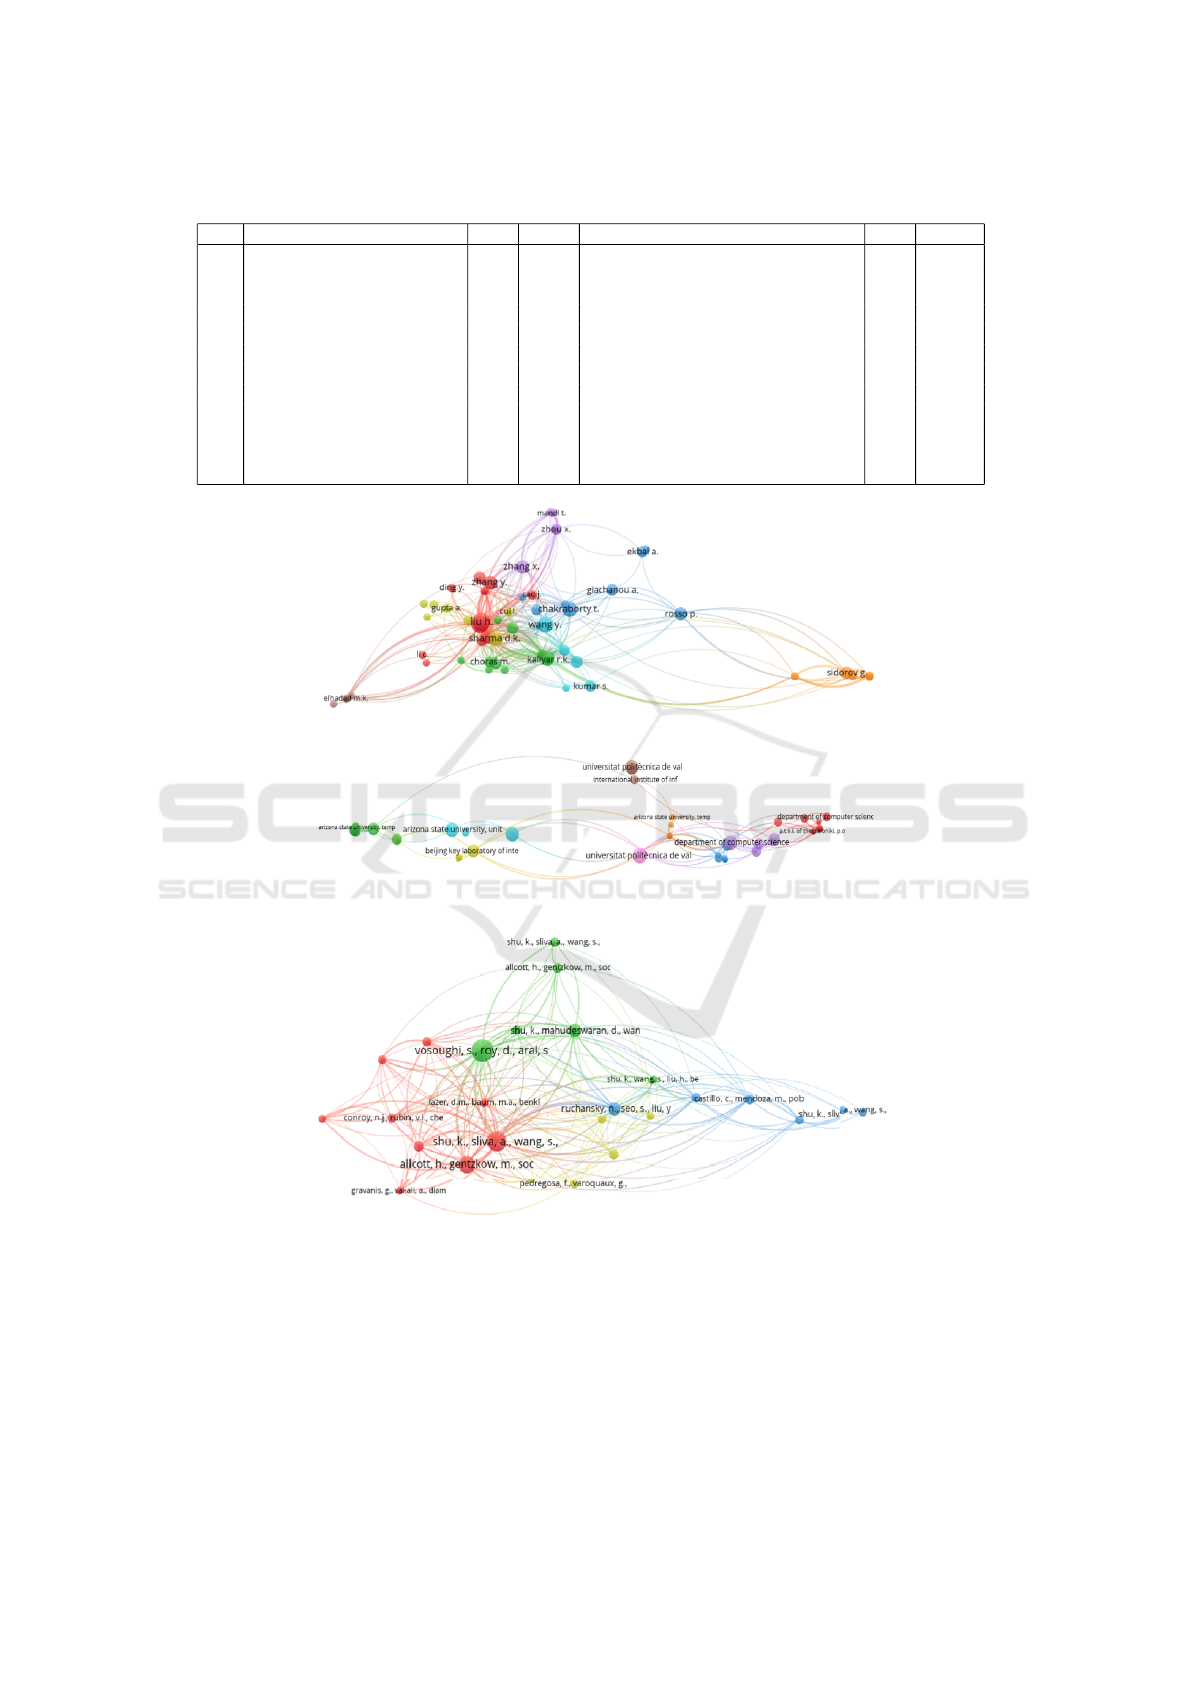
Table 4: Keywords analysis results – author vs. all keywords.
All keywords No. Link Author keywords No. Link
1. fake news 685 1282 fake detection 711 10377
2. fake news detection 474 765 social networking (online) 711 10641
3. machine learning 308 766 fake news 697 8932
4. deep learning 261 680 social media 613 8720
5. social media 243 557 fake news detection 474 6098
6. natural language processing 197 512 deep learning 411 5803
7. misinformation 119 307 machine learning 410 5685
8. covid-19 117 326 classification (of information) 296 4784
9. twitter 80 218 natural language processing 241 3423
10. disinformation 72 191 natural language processing systems 235 3622
11. classification 62 147 learning systems 198 3270
12. bert 57 149 learning algorithms 196 3183
Figure 5: The most cited authors – citation per author.
Figure 6: Citation per institution unit analysis.
Figure 7: Co-citations per reference.
alongside social media, as recent research depicts.
Based on the results, the article concludes with some
general remarks on research productivity, research
patterns, and keyword distribution. Future work can
further explore certain aspects and concepts of fake
news detection separately from social context and so-
cial media. While technological solutions are impor-
tant, education and media literacy play a crucial role
in combating the spread of fake news. Future research
should focus on developing effective educational in-
terventions, media literacy programs, and strategies to
promote critical thinking and information evaluation
skills. Studies related to fake news detection and ma-
chine learning are relatively new, and there is still a
ICSOFT 2023 - 18th International Conference on Software Technologies
554

huge gap related to the fake news detection issue and
cross-disciplinary concepts related to it that can be in-
vestigated in the future.
ACKNOWLEDGEMENTS
The publication was created in the framework of Pol-
ish National Agency for Academic Exchange under
the ”STER Programme – Internationalisation of Doc-
toral Schools” as part of the project ”Curriculum for
advanced doctoral education & training – CADET
Academy of Lodz University of Technology”.
REFERENCES
Abdulrahman, A. and Baykara, M. (2020). Fake news de-
tection using machine learning and deep learning al-
gorithms. In 2020 International Conference on Ad-
vanced Science and Engineering (ICOASE), Duhok,
Iraq, pages 18–23.
Agrawal, C., Pandey, A., and Goyal, S. (2021). A survey on
role of machine learning and nlp in fake news detec-
tion on social media. In 4th International Conference
on Computing, Power and Communication Technolo-
gies (GUCON), pages 1–7.
Alharbi, R., Vu, M., and Thai, M. (2021). Evaluating
fake news detection models from explainable machine
learning perspectives. In Proceedings of IEEE IN-
TERNATIONAL CONFERENCE ON COMMUNICA-
TIONS (ICC 2021).
Babu, D., Sushmitha, G., Lasya, D., Krishna, D., and Ra-
jesh, V. (2022). Identifying fake news using machine
learning. In 2022 International Conference on Elec-
tronics and Renewable Systems (ICEARS), pages 1–6.
Baskaran, S. (2022). Publications trends in big data: A sci-
entometric analysis.
Biwalkar, A., Rao, A., and Shah, K. (2021). Real or fake:
An intrinsic analysis using supervised machine learn-
ing algorithms. In 5th International Conference on
I-SMAC (IoT in Social, Mobile, Analytics and Cloud)
(I-SMAC), pages 372–380.
Choras, M. (2020). Advanced machine learning techniques
for fake news (online disinformation) detection.
CSO, C. S. O. (2020). Information Integrity. Online,
https://www.cso.ie/en/releasesandpublications/ep/p-
isshisi/householdinternetsecurityandinformationintegrity
2021/informationintegrity/.
Ding, Y., Wang, Y., and Wang, Y. (2021). It’s time to con-
front fake news and rumors on social media: A bib-
liometric study based on vosviewer. In 4th Intern.
Conference on Computer and Communication Engi-
neering Technology, pages 226–232.
Gerbina, T. (2021). Science disinformation: On the problem
of fake news.
Guo, D., Chen, H., Long, R., Lu, H., and Long, Q. (2017).
A co-word analysis of organizational constraints for
maintaining sustainability.
Heilig, L. and Vob, S. (2014). A scientometric analysis of
cloud computing literature.
Jain, A. and Kasbe, A. (2018). Fake news detection.
Khalil, A., Jarrah, M., Aldwairi, M., and Jararweh, Y.
(2021). Detecting arabic fake news using machine
learning. In 2nd International Conference on Intelli-
gent Data Science Technologies and Applications (ID-
STA), pages 171–177.
Khokhlov, A. (2020). How scientometrics became the most
important science for researchers of all specialties.
Mazov, N., Gureev, V., and Glinskikh, V. (2020). The
methodological basis of defining research trends and
fronts.
Paor, S. D. and Heravi, B. (2020). Information literacy and
fake news: How the field of librarianship can help
combat the epidemic of fake news.
Raynaud, M. (2021). Impact of the covid-19 pandemic on
publication dynamics and non-covid-19 research pro-
duction.
Reuters (2021). Fact check: ’133 million registered
voters’ argument uses flawed logic. Online,
https://www.reuters.com/article/uk-factcheck-voters-
133-million-idUSKBN296284.
Rohman, M., Khairani, D., Hulliyah, K., Arini, P.,
Riswandi, and Lakoni, I. (2021). Systematic liter-
ature review on methods used in classification and
fake news detection in indonesian. In 9th Interna-
tional Conference on Cyber and IT Service Manage-
ment (CITSM), pages 1–4.
Schotten, M., el Aisati, M., Meester, W., Steiginga, S.,
and Ross, C. (2017). A brief history of scopus: The
world’s largest abstract and citation database of scien-
tific literature.
(SMU), S. M. U. (2020). Using VOSviewer as a
bibliometric mapping or analysis tool in Busi-
ness, Management & accounting. Online,
https://library.smu.edu.sg/topics-insights/using-
vosviewer-bibliometric-mapping-or-analysis-tool-
business-management.
Srainternational (2020). Enabling Collaborative Work
in Higher Education: An Exploration of Enhanc-
ing Research Collaborations Within an Institution.
Online, https://www.srainternational.org/blogs/srai-
jra1/2019/12/08/enabling-collaborative-work-in-
higher-education.
Tavares, B., da Silva, E. S., and de Souza, A. D. (2017).
Risk management analysis in scrum software projects.
van Eck, N. and Waltman, L. (2010). Software survey:
Vosviewer, a computer program for bibliometric map-
ping.
Vinhas, O. and Bastos, M. (2022). Fact-checking misinfor-
mation: Eight notes on consensus reality.
Wang, C.-C. (2020). Fake news and related concepts: Defi-
nitions and recent research developments.
Scientometric Analysis of Fake News Detection and Machine Learning Based on VOSviewer
555
