
Reaction Time Estimation Based on Recursive Short-Term Principal
Component Analysis for Skeletal Information of Badminton Players
Kana Sagawa
1
, Hidehiko Shishido
2a
, Masashi Suita
3
and Itaru Kitahara
2b
1
Master’s Program in Intelligent Mechanical Interaction Systems, University of Tsukuba, Ibaraki, Japan
2
Center for Computational Sciences, University of Tsukuba, Ibaraki, Japan
3
Faculty of Health and Sport Sciences, University of Tsukuba, Ibaraki, Japan
Keywords: Badminton, Reaction Interval Estimation, Time-Series 3D Skeletal Information, Recursive Short-Term,
Principal Component Analysis.
Abstract: The aim of this paper is to measure the shot-reaction intervals of badminton players based on time-series 3D
skeletal information. In competitions where game dominance changes, effective plays and tactics in situations
can be investigated by analyzing the measured reaction intervals. In our proposed method, we estimated shot-
reaction intervals using a badminton player’s motion information and applied a short-term principal compo-
nent analysis to the sequential 3D skeletal information of athletes to extract features useful for motion analysis.
Hit and reaction times were detected by identifying the extrema in the first and second principal component
scores. We estimated a shot’s reaction interval from the hit time to the reaction time at which the player starts
moving in response. We applied the proposed method to the 3D skeletal information of a badminton player
and confirmed that reaction intervals can be estimated. By using the results of this study to provide feedback
to badminton players on the analysis of reaction intervals, players can learn and improve their effective and
ineffective tactics and plays.
1 INTRODUCTION
Data analysis is becoming more important in compet-
itive sports (Bhatnagar & Babbar, 2019). Both perfor-
mance and tactical analysis have investigated effec-
tive plays and the tactics of situations where game
dominance changes, such as soccer (Rein & Mem-
mert, 2019; Mackenzie & Christopher, 2012). For the
purposes of this paper, we use the term “game domi-
nance” as a degree of team dominance that changes
from moment to moment in a game. For such strategic
games as go and shogi, TV programs that stream AI-
based game analysis have emerged since grasping
game situations are difficult for average viewers.
Thus, interests in information provision and data
analysis techniques to help diverse users to better un-
derstand the game situation have been rising.
Competitive badminton is characterized by the
fastest shuttle speed (ball speed for other sports)
(Bańkosz et al. 2013). In a rally, a shuttle is returned
in approximately one second (Cabello & González,
a
https://orcid.org/0000-0001-8575-0617
b
https://orcid.org/0000-0002-5186-789X
2003), requiring that badminton players have the abil-
ity to move and react quickly. Reaction speed, return
position, footwork position, and connection to the
next move significantly impact performance (Kuo et
al. 2020). For example, if the reaction speed is slow
because the opponent's strokes are deceptive, the
game will be at a disadvantage. Therefore, knowing
the length of the reaction interval makes it possible to
know which plays affected the match. Furthermore,
the interval between the changes in a game situation
is very short, less than a second. Therefore, based on
the game situations in go and shogi, the application of
AI decision-making to badminton is impractical be-
cause such situations can change within one second
for each shot. On the other hand, we hypothesize that
information about effective plays and tactics may be
concentrated at specific times when game dominance
changes because these crucial points are related to
shot-reaction intervals. Therefore, the purpose of this
research is to measure the shot-reaction intervals of
badminton players and statistically analyze the inter-
vals to identify effective plays and tactics at the timing
Sagawa, K., Shishido, H., Suita, M. and Kitahara, I.
Reaction Time Estimation Based on Recursive Short-Term Principal Component Analysis for Skeletal Information of Badminton Players.
DOI: 10.5220/0012156900003587
In Proceedings of the 11th International Conference on Sport Sciences Research and Technology Support (icSPORTS 2023), pages 15-22
ISBN: 978-989-758-673-6; ISSN: 2184-3201
Copyright © 2023 by SCITEPRESS – Science and Technology Publications, Lda. Under CC license (CC BY-NC-ND 4.0)
15

Figure 1: Reaction interval estimation using skeletal information of a badminton player obtained by motion capture: Reaction
intervals are estimated as time from opponent's hit time to reaction time where player starts moving in response. By analyzing
reaction interval data, feedback is provided to coaches and players for estimating game dominance.
of changes in game dominance. We believe that the
visualization of such information can provide feed-
back to players and augment their performance.
As shown in Fig. 1, this paper estimates the reac-
tion intervals and reaction movements of badminton
players. Faster reaction speed is a key characteristic
in the reaction intervals of badminton players (Ca-
bello Manrique & González-Badillo, 2003), a theory
that has been confirmed with experiments using force
plates (De et al. 2023). However, it is unrealistic to
measure footwork movements during badminton
competitions with a force plate, because the size of
the equipment limits the movements that can be
measured. Therefore, in our previous work, we ana-
lyzed reaction motions using deep learning, which es-
timated the 3D skeletal poses of players from video
to determine their reaction intervals during badmin-
ton games. We used the acceleration information of
their waists to estimate a shot’s reaction interval.
Three types of movements occur during a game:
stroke movement, reaction movement, and transla-
tion. Separating the reaction movements and the
translation features was difficult using a classification
method based on waist acceleration. In addition, we
confirmed that the difference in the angle of the view
of the camera used in the training dataset and the tar-
get images distorted the estimated human poses. We
also confirmed that the estimation error lowered the
waist acceleration.
As shown in Fig. 1, this paper estimates the reac-
tion intervals and reaction movements of badminton
players utilizing a motion-capture system that ac-
quires more accurate skeletal position information.
The following are the main contributions of this pa-
per:
a method that automatically measures the reaction
intervals of badminton players during games;
a motion-extraction technique tailored for compe-
titions with different time intervals of motion,
such as badminton games;
a method that identifies hit and reaction motions
by detecting the hit and reaction times.
2 RELATED WORKS
Deep learning has been used extensively in the field
of sports and biomechanics (Halilaj et al. 2018). It has
made skeletal pose estimation from images both ro-
bust and reliable (Badiola & Mendez, 2021). Open-
Pose (Cao et al. 2021), which is a representative
method for acquiring skeletal pose information by ap-
plying deep learning, can estimate 25 points of a per-
son's skeleton from input video in real-time. HRNet
(Sun et al. 2019), which maintains high-resolution
representation by connecting high-resolution and
low-resolution subnetworks in parallel, addresses the
problems of OpenPose, including frequent false pos-
itives when occlusion occurs and the low detection
rate of small objects. In both Cao's and Sun's studies,
the output is 2D skeletal coordinates on the input
video.
This research field has been extended by a study
in which a person’s 3D skeletal coordinates are output
from input video (Liu et al. 2021). Although estima-
tion methods for 2D and 3D skeletal positions using
deep learning have made remarkable progress, a
icSPORTS 2023 - 11th International Conference on Sport Sciences Research and Technology Support
16
problem remains: the estimation accuracy drops sig-
nificantly during self-occlusion, which frequently
happens when the arms and legs are hidden by the
subject's body. Therefore, 3D motion-capture sys-
tems are the most commonly used method of acquir-
ing 3D skeletal information in the field of sports bio-
mechanics research (Zhao & Li, 2019).
In this paper, we propose a method that measures
the reaction intervals of players based on highly ac-
curate skeletal information obtained from a motion-
capture measurement taken during games. In the field
of motion analysis using time-series skeletal data, an-
other research (Xu et al. 2010) detected walking and
running rhythms by applying short-term principal
component analysis (ST-PCA) to motion-capture
data. In addition, another work (Federolf et al. 2014)
detected the motion characteristics of skiers by apply-
ing principal component analysis to motion-capture
data. When the entire body rotates while the foot mo-
tion represents the ground timing, we clarified that the
features representing whole-body motion can be ex-
tracted from the first principal component and fea-
tures representing partial motion can be extracted
from the second principal component. In badminton
games as well, whole-body translation occurs when
players hit a shuttle and such partial body movements
as extension and flexion of the hip and knee joints,
abduction and adduction of the hip joint and jumping
occur during footwork. We extract features that rep-
resent the whole-body translation during a hit using
the first principal component and features that repre-
sent partial body movements using the second princi-
pal component and estimate the reaction intervals
based on these features.
3 REACTION INTERVAL
ESTIMATION METHOD USING
RECURSIVE SHORT-TERM
PRINCIPAL COMPONENT
ANALYSIS
A reaction interval is estimated by observing the
player’s movements comprised of whole-body trans-
lation and partial movements. A whole-body transla-
tion is a movement with which a player advances to-
ward a hit point; partial movements include jumping
and swinging while moving toward a hit point. In sec-
tion 3.1 we explain how and why we define a reaction
interval as the pause between two types of keyframes:
hit times and reaction times. In section 3.2 we apply
ST-PCA to our time-series data. In section 3.3 we em-
ploy a preliminary experiment to demonstrate how to
use ST-PCA to detect both types of keyframes and
determine the reaction intervals.
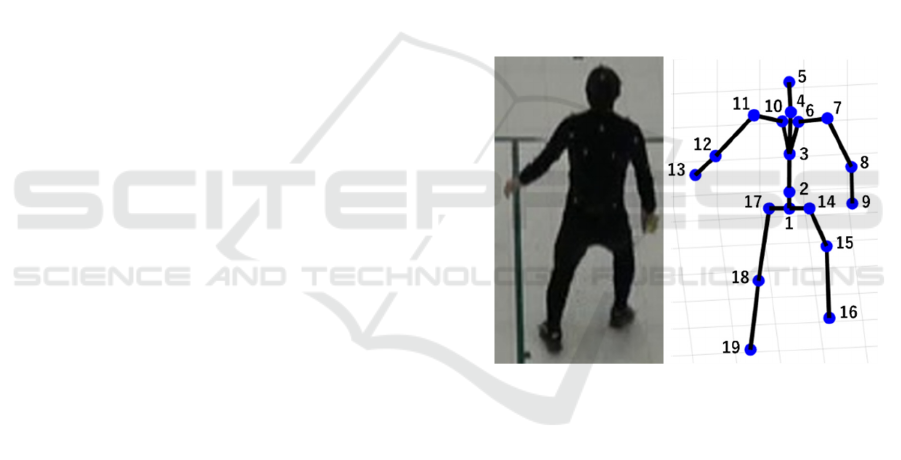
We used an optical motion-capture system to get
the skeletal information of the players. 20 motion-
capture cameras were installed at 8 m to surround the
court. Skeletal information was obtained by a motion-
capture system, comprised of an OptiTrack Prime 41,
which captured images at 120 fps. “Motive: Body”
software was used as the motion capture system. We
attached 37 reflective markers to specified points on
the body of each player. The positions of 37 reflective
markers follow baseline (37) of Entertainment Mark-
ersets. A skeleton model of 19 joint points was
tracked based on the marker positions. Fig. 2 shows
the skeletal information obtained by the motion-cap-
ture system.
Due to the limitation of its temporal resolution,
the skeletal model lacks data during high-speed arm
swings. In such cases, linear interpolation compen-
sated for the missing data.
Figure 2: Skeletal information acquired by motion-capture
system.
3.1 Definition of Reaction Intervals
In badminton, when moving around the court, the fol-
lowing actions are repeated to respond to an oppo-
nent's shot: 1) pushing off from the playing center, 2)
decelerating toward the hitting point, and 3) pushing
off toward the playing center after stroke. Therefore,
in this research, the time of the opponent's hit is de-
fined as the beginning of the reaction interval, and the
reaction time (i.e., the time of pushing off at the play-
ing center to respond to the opponent's shot) is de-
fined as its end (Fig. 3).
Reaction Time Estimation Based on Recursive Short-Term Principal Component Analysis for Skeletal Information of Badminton Players
17
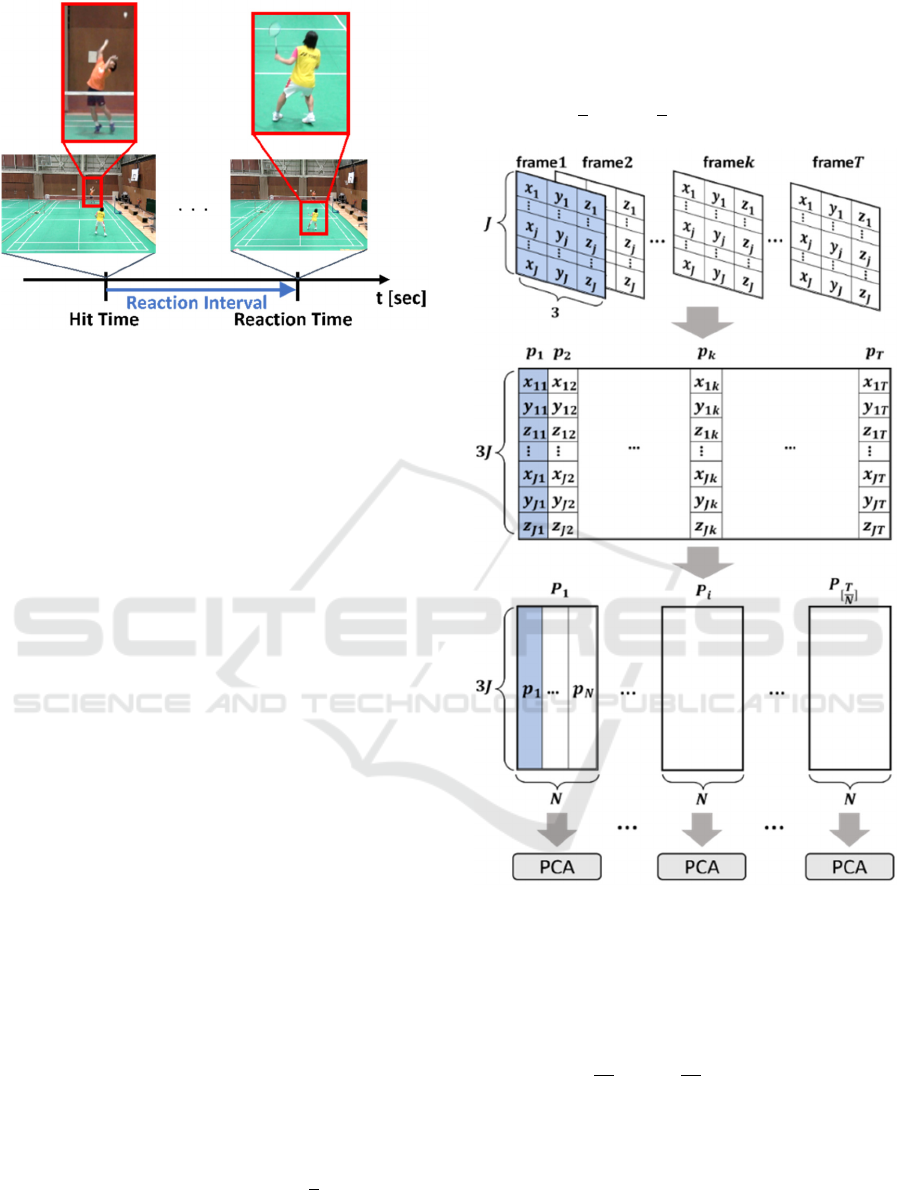
Figure 3: Definition of reaction interval: Time of opponent's
hit is defined as beginning of reaction interval, and reaction
time (i.e., time of pushing off at playing center to respond
to opponent's shot) is defined as end of reaction interval.
3.2 Short-Term Principal Component
Analysis
Short-term principal component analysis (ST-PCA)
is applied to the movements of joints (time-series
skeletal data) acquired by motion capture (Fig. 4).
The skeletal information is 𝐽3 𝑇 dimensional
data, where 𝐽 is the number of skeletal joints and 𝑇 is
the total number of frames included in the analysis
section. The skeletal coordinates are converted to
one-dimensional data for each frame to create 3𝐽𝑇
dimensional data (middle, Fig. 4). The skeletal data
for 𝑘-th frame 𝒑
are expressed as
𝒑
𝒙
, 𝒚
, 𝒛
,…,𝒙
, 𝒚
, 𝒛
𝑘1, … , 𝑇
.
(1)
To apply ST-PCA to the skeletal information, we
divided it into small analysis windows along the time
dimension. Similar to a previous work (Xu et al.
2010), the width of the analysis window is set to N
and the sliding width is set to the same value as the
analysis window width (lower part, Fig. 4). The di-
vided 3𝐽𝑁 dimensional time-series coordinate
vectors are analyzed in each analysis window. For ex-
ample, when applying ST-PCA to the 3D skeletal in-
formation of a badminton player, the 𝑇 frames from
the service to the end of the rally are used as the anal-
ysis section, and each bit of skeletal information is di-
vided into 𝑁 frames. Time-series coordinate vector
𝐏
in the 𝑖-th analysis window can be expressed as
𝑷
𝒑
,… ,𝒑
𝑖1,…,
.
(2)
In the last analysis window where the total num-
ber of frames in the analysis segment is not divisible
by 𝑁, 𝑷
is expressed by
𝑷
𝒑
,… ,𝒑
.
(3)
Figure 4: Application of short-term principal component
analysis to skeletal information: Skeletal information is
converted into 1D data frame by frame, and PCA is applied
to skeletal information for all N frames.
In ST-PCA, we applied ordinary principal com-
ponent analysis (PCA) to the standardized coordinate
vector 𝑷
of each analysis window. 𝑷
is calculated
by 𝑷
𝑷
𝑷
, where 𝑷
is the average posture of
the 𝑖-th analysis window. In PCA, the eigenvectors of
each principal component (PC) are calculated by the
singular value decomposition of the covariance ma-
trix of the input matrix. Each PC score is calculated
by projecting skeletal coordinate vector 𝑷
onto the
partial space on which each eigenvector is based. By
icSPORTS 2023 - 11th International Conference on Sport Sciences Research and Technology Support
18
independently applying PCA to each analysis win-
dow, a discontinuity is created in the time-series of
the PC scores between two neighboring analysis win-
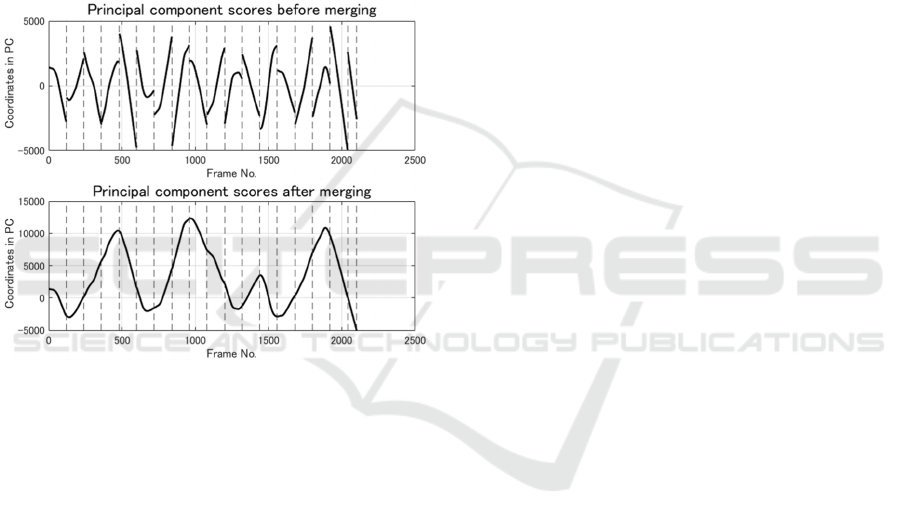
dows. A previous work (Xu et al. 2010) showed that
the coordinates can be smoothly combined by apply-
ing inversion and translation since the bases of the ad-
jacent analysis windows are temporally consistent.
Examples of the first PC scores before and after merg-
ing are shown in Fig. 5. Its top and bottom rows re-
spectively show the PC scores before and after merg-
ing. The time-series data, which have discontinuity
before merging, can be converted to continuous data.
According to a previous work (Federolf, 2016), the
PC scores represent the amplitude of the posture
changes in each principal component space.
Figure 5: (Top) First principal component scores before
merging: (Bottom) First principal component scores after
merging: Data that were discontinuous before merging are
converted to continuous data by inversion and translation.
ST-PCA is applied with 𝑁= 120, and
dashed
lines repre-
sent analysis window width.
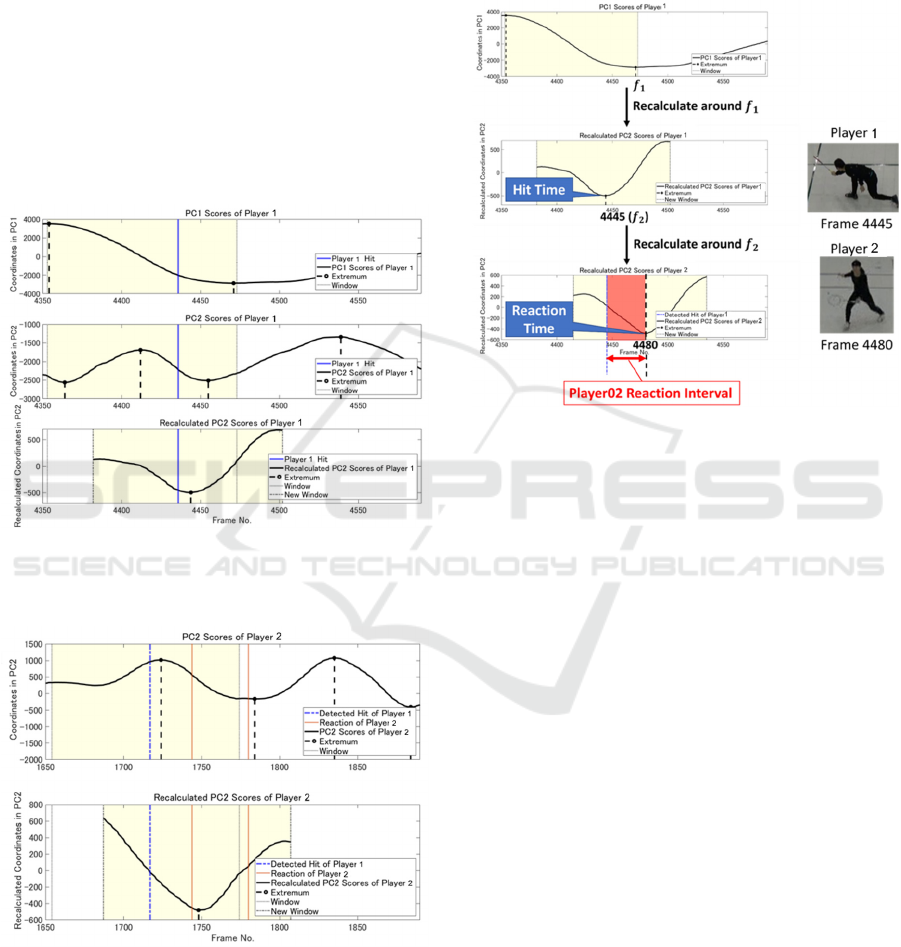
3.3 Reaction Interval Estimation by
Recursive Short-Term Principal
Component Analysis
As described in section 3.1, the reaction interval of a
player is defined as the interval between the oppo-
nent’s hit time and the player’s corresponding reac-
tion time. The procedures to determine the hit and re-
action times are summarized below: 1) Perform ST-
PCA for Player 1 and find frame 𝑓
where the extreme
value of the PC1 score appears. 2) Perform ST-PCA
for Player 1 again but on an analysis window around
𝑓
. 3) From the result of step 2, find frame 𝑓
where
the extreme value of the PC2 score appears and label
it the hit time of Player 1. 4) Perform ST-PCA for
Player 2 on an analysis window around 𝑓
. 5) From
the result of step 4, find the frame where the extreme
value of the PC2 score appears and label it the reac-
tion time of Player 2.
We conducted a preliminary experiment by apply-
ing ST-PCA to the skeletal information of badminton
players. In a badminton singles match, since the play-
ers hit the shuttle in turn about every second [5], 𝑁
120 was set as the width of the analysis window for
the data captured at 120 fps. The ST-PCA results of
the two players are shown in Figs. 6 and 7. The former
shows the PC1 and PC2 scores and the hit times of
Player 1, and the latter shows the PC2 scores and re-
action times of Player 2. The blue lines in Fig. 6 and
the orange lines in Fig. 7 respectively show the actual
hit and reaction times. They were judged visually by
an experienced badminton player. The top and middle
rows of Fig. 6 and the top row of Fig. 7 show the time
series of the PC scores obtained from the ST-PCA re-
sult of a fixed analysis window described in section
3.2. The bottom row of Fig. 6 shows the time series
of the recalculated PC2 score of Player 1, obtained by
conducting a PCA on the 120-frame window around
the time where the extrema of the PC1 scores appear.
The bottom row of Fig. 7 shows the time series of the
recalculated PC2 score of Player 2, obtained by con-
ducting another PCA on the 120-frame window
around the detected hit time of Player 1.
Since the PC1 of the skeletal data represents the
translational and rotational movements of the whole
body within the analysis window, extreme values
were observed during the player’s braking move-
ments. PC2 represents the player's postural changes,
and thus extreme values are observed during arm
swinging, footwork, and at starting/ending of jump-
ing.
The local extrema of the PC1 scores, calculated in
a fixed analysis window, were located around the real
hit time but with a rather significant error (top row,
Fig. 6). The local extreme times of the PC2 scores are
closer to the real hit times compared to those of the
PC1 (middle row, Fig. 6). The error between the local
extremum of the recalculated PC2 scores and the real
hit time is even smaller, indicating a higher estimation
accuracy (bottom row, Fig. 6). Therefore, the time of
the extremum found in the recalculated PC2 score is
defined as the player's hit time.
The PC2 score of Player 2, calculated in a fixed
window in the neighbourhood of the hit time of Player
1, has a local extremum around the real reaction time
but with a large error (top row, Fig. 7). Since the local
extreme values of the recalculated PC2 scores of
Player 2 appear very close to the real reaction time
(lower row, Fig. 7), it is defined as Player 2’s reaction
time.
Reaction Time Estimation Based on Recursive Short-Term Principal Component Analysis for Skeletal Information of Badminton Players
19
In the process of calculating the local extrema,
prominence 𝑝, which represents the degree of promi-
nence of each peak, were calculated to reduce the
false positives caused by small changes (Cox et al.
2020). For the hit time detection, local extreme values
are considered when 𝑝𝑘, and if multiple local ex-
trema are detected in the 𝑡ℎ s, the local extreme value
is adopted with the largest prominence 𝑝. For reaction
time detection, the local extreme value with the larg-
est prominence in the PC2 score recalculated in the
neighborhood of the hit time is adopted. Recursive
principal component analysis was performed with a
window of analysis from frame 𝑏 before the reference
time to frame 𝑎 after it.
Figure 6: First two principal component scores and hit time:
Yellow areas represent analysis window. Blue line repre-
sents actual hit time specified visually.
Figure 7: Second Principal Component Scores and Reaction
times: Yellow Areas Represent Analysis Window. Orange
Lines Represent Actual Reaction Time Tolerance Specified
Visually.
We applied the above algorithm to both players to
estimate their reaction intervals. For example, when
estimating the reaction interval of Player 2, we de-
tected the hit time of Player 1 and the reaction time of
Player 2 and output the interval between them as the
reaction interval. An example of the calculated reac-
tion interval is shown in Fig. 8.
Figure 8: Reaction interval estimation using recursive
short-term principal component analysis.
4 EXPERIMENTS
We verified the effectiveness of our proposed method
through empirical experiments. The data used in the
verification were single matches of 10 innings played
by one female and one male member of the University
of Tsukuba badminton club. A badminton court was
set up in a 25-m-wide, 15-m-deep, 8-m-high space.
The subjects wore motion-capture suits to which 37
reflective markers were attached, and 20 motion-cap-
ture cameras and one fixed RGB camera were in-
stalled at 8 m to surround the court. Skeletal infor-
mation was obtained by a motion-capture system,
comprised of an OptiTrack Prime 41, which captured
images at 120 fps. The fixed camera was a Sony FDR
AX-55, which captured 1440 720 pixel frames at
30 fps. The fixed camera shot the video from the rear
of the court with the net in front of it so that both play-
ers can be seen in the video. “Motive: Body” software
was used as the motion capture system.
Our proposed reaction interval estimation algo-
rithm assumes that the hit times are correctly de-
tected. Therefore, in our experimental demonstration
of the proposed method, after an experiment that ver-
ified the hit time’s detection accuracy, we verified the
icSPORTS 2023 - 11th International Conference on Sport Sciences Research and Technology Support
20

accuracy of the reaction time detection for the reac-
tion times to the correctly detected hit times. In addi-
tion, to verify the recursive principal component anal-
ysis’s effectiveness in the proposed method, we eval-
uated the method using only PC scores in a fixed anal-
ysis window and the proposed method using recursive
principal component analysis.
In experiments that evaluated the accuracy of the
hit time detection, we compared the following three
results: 1) the visual annotation results of the hit
times, 2) the detection results using only PC scores in
a fixed analysis window, and 3) the detection results
using the proposed method. The detection using only
the PC scores in a fixed analysis window is a method
that searches for the extreme times of the PC1 scores
and uses the extreme times of the PC2 scores (calcu-
lated in a fixed analysis window) immediately before
them as hit times. The results are correct if the abso-
lute error is within a threshold value; otherwise, they
are erroneous. Since the stroke times of badminton
players are approximately 0.3 to 0.4 s, the absolute
error threshold is set to 0.3 s.
We evaluated the accuracy of the reaction time de-
tection for the correctly detected hit times by compar-
ing the following three results. We compared the re-
action time detection results using the proposed
method with the reaction time detection results using
only PC scores in a fixed analysis window and visu-
ally annotated the reaction time ranges by experi-
enced badminton players. The annotated tolerance
range was set from the time when the players pushed
off their feet to when they started moving toward the
next hit. For the specified tolerance range, the output
by the proposed method was labeled correct if it was
within the tolerance range and incorrect if it was out-
side of it. If a shot in the hit time is an error and the
opponent does not react, no reaction time was output.
In this experiment, 𝑁 = 120, 𝑝 = 100, and 𝑡ℎ = 0.5,
where 𝑡ℎ was set to 0.5, assuming that in badminton
competitions, two hits by one player are never made
within 0.5 s (Cabello & González, 2003).
Table 1: Results of hit time detection accuracy evaluation.
Method
Recall
(%)
Precision
(%)
F-score
(%)
Simple
ST-PCA
Player 1 77.8 51.2 61.8
Player 2 73.1 52.8 61.3
Total 75.4 52.0 61.5
Recursive
ST-PCA
(a=90, b=30)
Player 1 88.9 68.6 77.4
Player 2 80.8 60.0 68.9
Total 84.8 64.3 73.1
Table 2: Results of reaction time detection accuracy evalu-
ation.
Method Recall (%)
Simple
ST-PCA
Player 1 34.8
Player 2 42.9
Total 38.8
Recursive
ST-PCA
(a=30, b=90)
Player 1 38.1
Player 2 47.8
Total 43.0
5 RESULTS
Table 1 shows the results of the hit time detection’s
accuracy evaluation and Table 2 shows the results of
the reaction time detection accuracy evaluation. Ac-
curacy evaluation showed that recursive ST-PCA out-
performed the simple ST-PCA in all the hit time de-
tection accuracy measures: Recall, Precision, and F-
score. Recursive ST-PCA also outperformed simple
ST-PCA in the precision evaluation of the reaction in-
terval detection. This result seems to be due to the fact
that simple ST-PCA does not allow for an analysis
window for a specific movement, whereas recursive
ST-PCA allows for an analysis window for the time
the hit or reaction movement occurred. In the hit time
detection, the hit times were undetected when the
player hit while jumping and when serving. False pos-
itives were observed at the start and end of a jump and
at the reaction time in the case of hits while jumping.
In the reaction time detection, a detection was made
when the highest point of a hop was reached immedi-
ately before a reaction, resulting in many cases of un-
detected times. When receiving a service, there were
cases where the first step after a push-off was not de-
tected at the time of the push-off, although it was de-
tected when the first foot touched the ground, result-
ing in undetected results.
6 LIMITATIONS
The system proposed in this study has the following
limitations, which still make it difficult to implement
an automatic analysis solution for actual badminton
matches.
Skeletal information is captured using motion
capture with reflective markers on the athlete;
Skeletal information is analyzed offline after ac-
quisition.
Reaction Time Estimation Based on Recursive Short-Term Principal Component Analysis for Skeletal Information of Badminton Players
21

7 CONCLUSIONS
We proposed a method for estimating reaction inter-
vals using recursive short-term principal component
analysis for the 3D skeletal information of players in
badminton games. Our proposed method detected the
extreme times of the second principal component
score near the time of the opponent's first principal
component score as the hit time of a reaction interval.
The extreme times of the other player's second prin-
cipal component scores near the opponent's hit times
were detected as the end of the reaction interval, and
the shot-reaction intervals were estimated. The results
of the detection accuracy evaluation showed that re-
call was 84.8% for the hit time detection and 43.0%
for the reaction time detection. The effectiveness of
recursive short-term principal component analysis
was confirmed in both detection accuracy evalua-
tions. The next step is to examine the relationship be-
tween reaction time and game dominance, and to use
reaction time and other factors as inputs to predict and
visualize game dominance.
REFERENCES
Badiola-Bengoa, A., & Mendez-Zorrilla, A. (2021). A Sys-
tematic Review of the Application of Camera-Based
Human Pose Estimation in the Field of Sport and Phys-
ical Exercise. Sensors. 21(18), 5996. https://doi.org/
10.3390/s21185996
Bańkosz, Z., Nawara, H., & Ociepa, M. (2013). Assessment
of Simple Reaction Time in Badminton Play-
ers. TRENDS in Sport Sciences 2013, 31, 54–61.
Bhatnagar, R., & Babbar, M. (2019). A Systematic Review
of Sports Analytics.
Cabello Manrique, D., & González-Badillo, J. J. (2003).
Analysis of the characteristics of competitive badmin-
ton. British journal of sports medicine, 37(1), 62–66.
https://doi.org/10.1136/bjsm.37.1.62
Cao, Z., Hidalgo, G., Simon, T., Wei, S., & Sheikh,
Y.(2021). OpenPose: Realtime Multi-Person 2D Pose
Estimation Using Part Affinity Fields. IEEE Transac-
tions on Pattern Analysis and Machine Intelligence,
43(1), 172–186.
Cox, B., Van der Perre, L., Wielandt, S., Ottoy, G., & De
Strycker, L. (2020). High precision hybrid RF and ul-
trasonic chirp-based ranging for low-power IoT nodes.
EURASIP Journal on Wireless Communications and
Networking 2020, 1, 187.
De Waelle, S., Robertson, K., Deconinck, F. J. A., & Le-
noir, M. (2023). The Use of Contextual Information for
Anticipation of Badminton Shots in Different Expertise
Levels. Research quarterly for exercise and
sport, 94(1), 15–23. https://doi.org/10.1080/0270
1367.2021.1934378
Federolf P. A. (2016). A novel approach to study human
posture control: "Principal movements" obtained from
a principal component analysis of kinematic marker
data. Journal of biomechanics, 49(3), 364–370.
https://doi.org/10.1016/j.jbiomech.2015.12.030
Federolf, P., Reid, R., Gilgien, M., Haugen, P., & Smith, G.
(2014). The application of principal component analy-
sis to quantify technique in sports. Scandinavian jour-
nal of medicine & science in sports, 24(3), 491–499.
https://doi.org/10.1111/j.1600-0838.2012.01455.x
Halilaj, E., Rajagopal, A., Fiterau, M., Hicks, J. L., Hastie,
T. J., & Delp, S. L. (2018). Machine learning in human
movement biomechanics: Best practices, common pit-
falls, and new opportunities. Journal of biomechan-
ics, 81, 1–11. https://doi.org/10.1016/j.jbiomech.201
8.09.009
Kuo, K. P., Tsai, H. H., Lin, C. Y., & Wu, W. T. (2020).
Verification and Evaluation of a Visual Reaction Sys-
tem for Badminton Training. Sensors (Basel, Switzer-
land), 20(23), 6808. https://doi.org/10.3390/s20236808
Liu, J., Rojas, J., Li, Y., Liang Z., Guan, Y., Xi, N., & Zhu,
H. (2021). A Graph Attention Spatio-temporal Convo-
lutional Network for 3D Human Pose Estimation in
Video. In 2021 IEEE International Conference on Ro-
botics and Automation (ICRA), 3374–3380.
Mackenzie, R., & Christopher, C. (2012). Performance
Analysis in Football: A Critical Review and Implica-
tions for Future Research. Journal of Sports Sci-
ences, 31.
Rein, R., & Memmert, D. (2019). Big Data and Tactical
Analysis in Elite Soccer: Future Challenges and Oppor-
tunities for Sports Science. SpringerPlus, 5(1), 1410.
Sun, K., Xiao B., Liu, D., & Wang, J. (2019). Deep High-
Resolution Representation Learning for Human Pose
Estimation. 2019 IEEE/CVF Conference on Computer
Vision and Pattern Recognition (CVPR), 5686–5696.
Xu, J., Takagi, K., & Yoneyama, A. (2010). Beat Induction
from Motion Capture Data Using Short-Term Principal
Component Analysis. Information and Media Technol-
ogies, 5(4), 1287–1293.
Zhao, X., & Li, S. (2019). A Biomechanical Analysis of
Lower Limb Movement on the Backcourt Forehand
Clear Stroke among Badminton Players of Different
Levels. Applied Bionics and Biomechanics 2019, 1–8.
icSPORTS 2023 - 11th International Conference on Sport Sciences Research and Technology Support
22
