Vertical Launch Angle Measurement of a Golf Ball Using Audio and
Monocular Video Data
Jan-Bernd Menke-Zumbr
¨
agel
a
, Anna Brinkmann
b
and Andreas Hein
c
Assistance Systems and Medical Device Technology, Carl von Ossietzky University of Oldenburg, Germany
Keywords:
Golf, Launch Angle, Computer Vision, Sports.
Abstract:
In golf, several parameters can be measured that describe how the golf ball was hit and how the ball lifts after
impact with the golf club, the so-called launch parameters. In addition to the spin rate or the velocity of the ball
and club head, the launch angle is an important value that describes the vertical component of the ball’s launch
direction. For professional use, there are systems called launch monitors that use either radar-technology,
multiple high-speed cameras or a combination of both to measure the above parameters. Despite their high
accuracy, these systems can suffer from disadvantages such as some inconvenience regarding size, weight or
setup, and an inaccessibility regarding high cost. Therefore we present a method for vertical launch angle
measurement based on monocular low frame rate video and audio data, by detecting the motion blur structure
created by the launching golf ball. This approach allows the vertical launch angle to be measured with a
simple and inexpensive setup that achieves an accuracy of ± 0.74°, which is comparable to a commercial
launch monitor.
1 INTRODUCTION
In golf, there are different types of ball flights used in
different situations on the golf course. They are de-
termined by different parameters and characteristics
of the golf swing and the way how the ball is hit. The
most important parameters are the launch parameters,
which describe how the ball lifts off after impact with
the golf club. The most common launch parameters
are listed and described in Table 1. With these param-
eters it is possible to calculate the outcome of the golf
swing regarding the trajectory of the golf ball.
While learning the golf swing or training for dif-
ferent ball trajectories a numerical feedback on these
launch parameters can be helpful to build consis-
tency and confidence in different situations on the
golf course. In addition, certain combinations of
launch parameter values can be used to detect mis-
takes during the golf swing. The commercial so-
lutions for this type of ball flight measurement are
called launch monitors. They come in a wide vari-
ety of price and accuracy levels, using photometric-
based systems, radar-based systems, or a combination
of both.
a
https://orcid.org/0009-0005-6412-0882
b
https://orcid.org/0000-0001-5228-4947
c
https://orcid.org/0000-0001-8846-2282
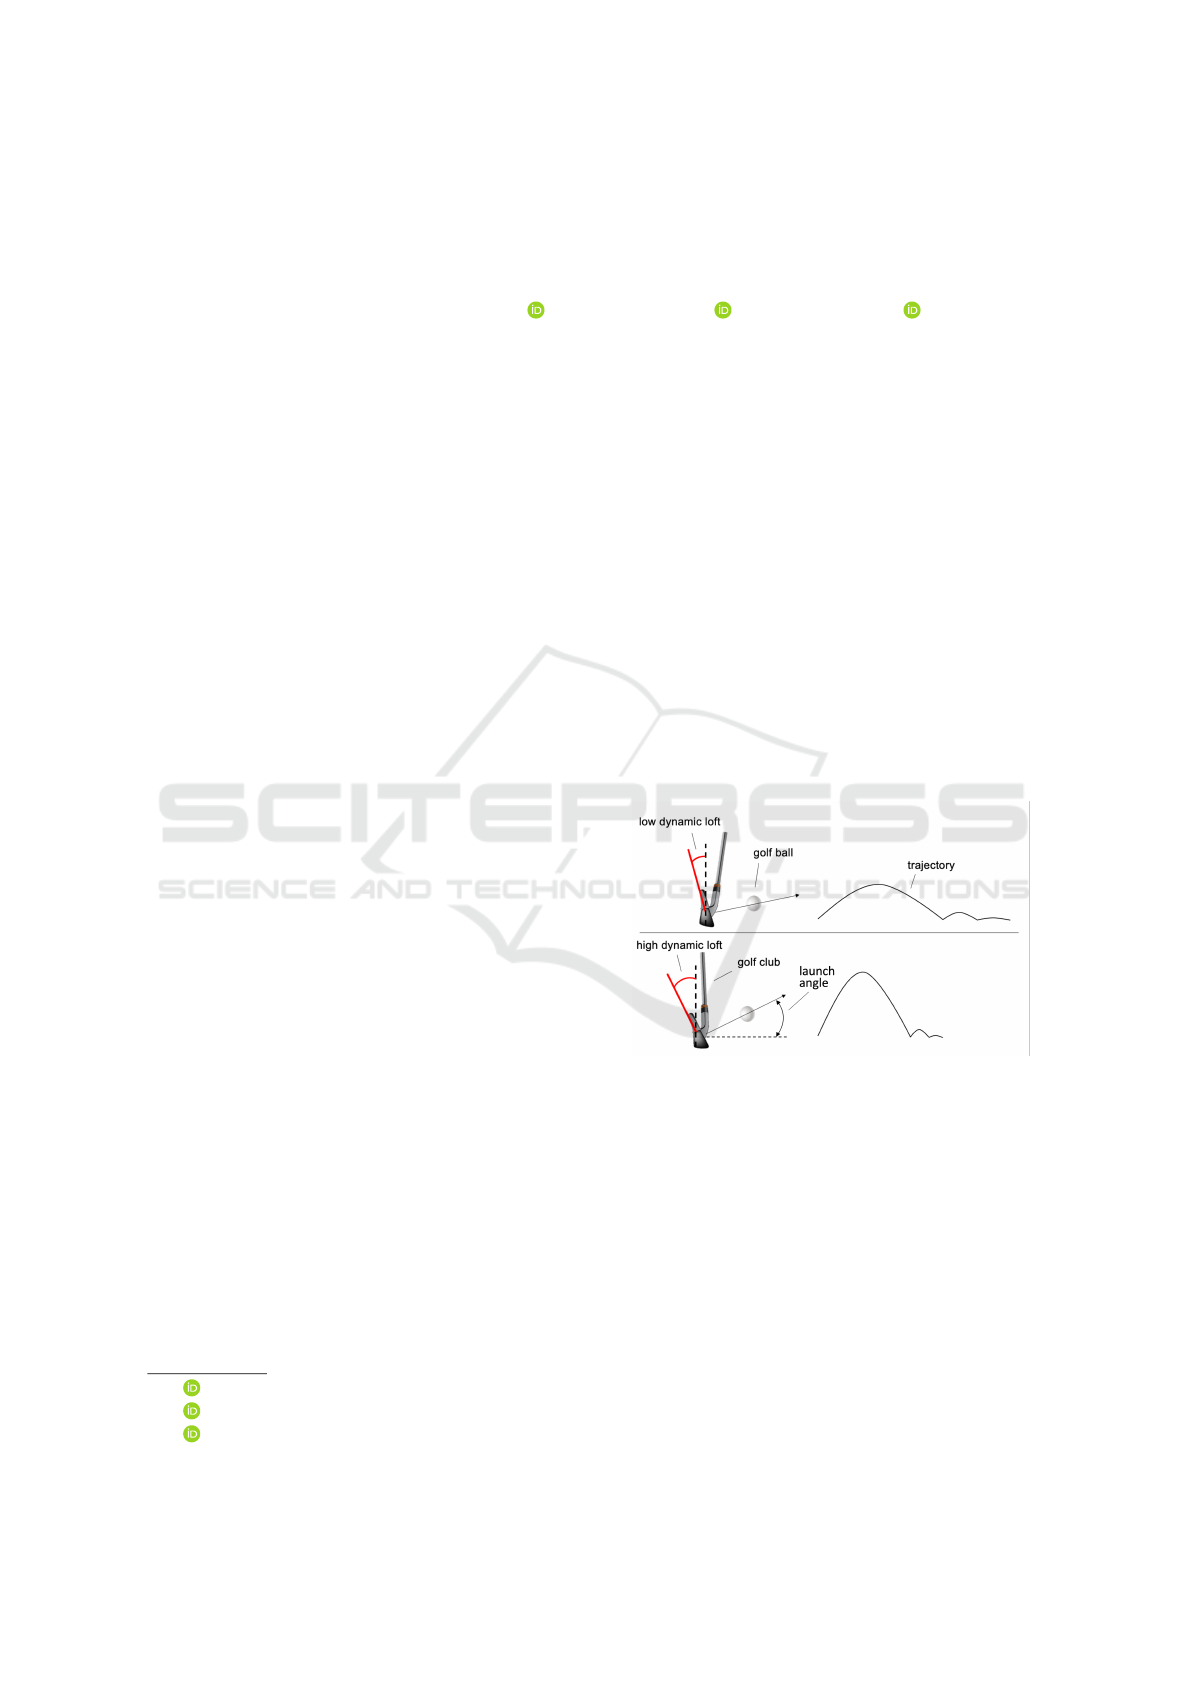
Figure 1: Visualization of a golf ball trajectory using a low
and high dynamic loft.
The radar-based systems, for example Trackman
4 (Trackman A/S, 023a) and Flightscope Mevo+
(FlightScope Mevo LLC, 2023), measure the move-
ment of the ball and club in three-dimensional
space, using the Doppler effect. By emitting radar
waves and measuring the reflection it is possible, for
example, to determine the speed of an object or the
ball spinning rate (Tuxen, 2010). This technology
allows to track a golf ball up to a distance of 365
meters (TrackMan A/S, 023b).
The photometric-based systems, for example GC-
Quad (Optimum Golf Technologies Ltd, 2023) and
Syktrak (GOLFTEC Enterprises LLC, 2023), are
using a set of high-speed cameras working at up to
120
Menke-Zumbrägel, J., Brinkmann, A. and Hein, A.
Vertical Launch Angle Measurement of a Golf Ball Using Audio and Monocular Video Data.
DOI: 10.5220/0012163200003587
In Proceedings of the 11th International Conference on Sport Sciences Research and Technology Support (icSPORTS 2023), pages 120-127
ISBN: 978-989-758-673-6; ISSN: 2184-3201
Copyright © 2023 by SCITEPRESS – Science and Technology Publications, Lda. Under CC license (CC BY-NC-ND 4.0)
Table 1: Launch parameter overview (Johansson et al.,
2015).
Launch parameters Description
Club head speed
The velocity of the golf
club head at impact.
Face angle
The alignment of the
golf club face relative to
the target direction.
Swing path
The direction of the club
movement relative to the
target direction at im-
pact.
Angle of Attack
The vertical component
of the club movement at
impact.
Ball speed
The starting velocity of
the golf ball after impact.
Dynamic Loft
The vertical alignment of
the club face at impact.
Vertical
launch angle
Angle of the ball flight
direction relative to the
horizon.
Horizontal
launch angle
Angle of the ball flight
direction relative to the
target direction.
Spin Rate
The Rotation of the golf
ball per minute after im-
pact.
Spin Axis
The tilt of the spin axis
after impact.
10.000 frames per second, to capture the movement
of the ball and the club at impact from different
angles. By detecting the ball and its movements
in the first few milliseconds of the ball flight, it is
possible to calculate, for example, speed, spin rate or
direction (Kiraly, 2005).
One can divide the launch parameters into two
different categories: Firstly, the ball related param-
eters, such as launch direction, ball speed, spinning
rate. Secondly the club related parameters, such
as dynamic loft, angle of attack or club face angle.
(Leach et al., 2017) shows that in comparison with
an 3D motion capturing system, even though the
two mentioned measurement methods are completely
different, the measured ball related parameters of
both systems are highly consistent with each other.
One of the most important ball related parame-
ters is the launch direction, which can be represented
by horizontal and vertical components. While the
swing path and the club face angle are mainly
determining the horizontal component, the vertical
component is mainly determined by the angle of
attack and the dynamic loft at impact. (Wood et al.,
2018)
By adjusting the dynamic loft, different vertical
launch angles can be achieved. Referring to Figure
1 it can be seen, that by reducing the dynamic loft,
the vertical launch angle is also reduced. This, in
combination with a constant club head speed, results
in a significantly lower ball flight height and an
increased distance the ball rolls on the ground. On
the other hand, a higher launch angle results in a
higher ball trajectory and a shorter roll distance. Both
flight trajectories can be useful in different situations
regarding obstacles on the golf course and are crucial
for achieving a low number of strokes.
When training to achieve a specific vertical launch
angle, a launch monitor can be helpful. Even though
the introduced commercial launch monitors can
achieve a high accuracy of ±0.3° using radar-based
systems and ±0.1° using photometric systems (Leach
et al., 2017), they suffer from certain disadvantages,
depending on the systems used. In addition to some
inconvenience due to size, weight, or setup, most
launch monitors require an additional device, such as
a smartphone or tablet, to display the measurements.
Also, the high cost (up to ∼20.000 $) doesn’t make
them suitable for amateur and beginning golf players.
Figure 2: Diagram of vertical launch angle measurement.
Therefore, we present a new method for vertical
launch angle measurement using only a monocular
low frame rate video in combination with the audio
data, as shown in Figure 2. The vertical launch angle
Vertical Launch Angle Measurement of a Golf Ball Using Audio and Monocular Video Data
121
measurement is performed by detecting the motion
blur created by the launching ball after impact.
Our approach leads to a simple and convenient
set up (shown in Figure 7), allowing to work with
only one device, such as a smartphone or tablet.
Additionally, the video data of the golf swing can
be recorded for further analysis, which has been
shown to have a positive impact on learning progress
(Guadagnoli et al., 2002).
2 METHODS
2.1 Swing Detection
To detect the launch angle of a golf ball after club
head impact from video data, the first task is to detect
in which frame of the video the impact occurred. In
contrast to a method based on ball or club tracking
(Chotimanus et al., 2012; Zhang et al., 2020), where
either the golf ball or the club is observed to detect a
swing, we developed a method using the combination
of video and audio data of a recorded swing sequence
to detect an impact.
Figure 3: Audio data of a recorded training sequence in time
domain.
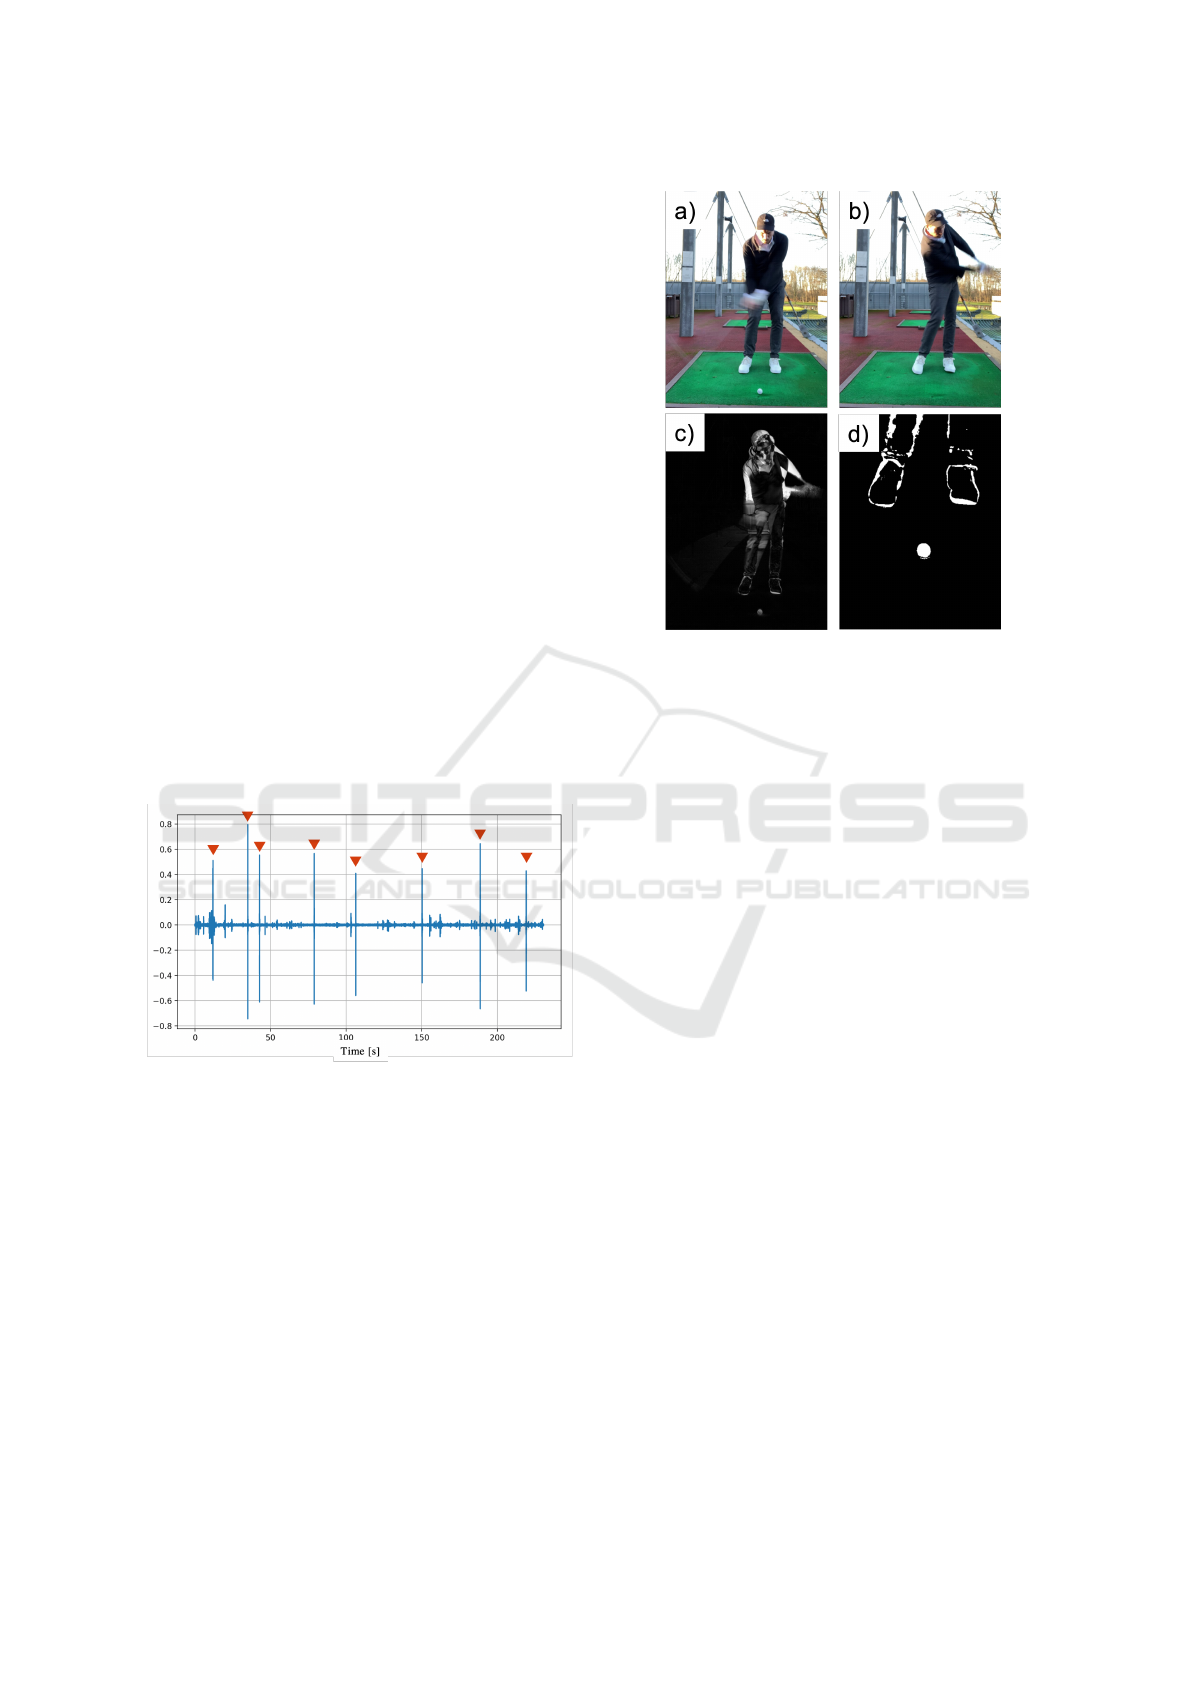
Looking at the audio data in the time domain
(Figure 3), we can detect peaks that indicate that an
event has occurred, such as the impact. The detection
of a peak is done by searching for a maximum value
between a rising and falling flank, using a threshold
value calculated according to (1), where x(t) is the
audio signal in the time domain.
Using the peak time t
event
and the video data
frame rate f ps we can calculate the exact frame f
event
including the event, which created the mentioned
peaks in the audio signal, according to (2).
threshold = max(x(t)) ∗ 0.25 (1)
Figure 4: Visualization of ball detection: a) 3 frames be-
fore impact frame , b) 3 frames after impact frame, c)
grayscale image of the absolute difference between a) and
b), d) cropped and binarized image of golf ball.
f
event
= ⌊t
event
∗ f ps⌋ (2)
However, the detected peaks can also be caused by
different events, such as a practice swing where only
the swing movement was done without the intention
of hitting the ball, while the sound event was caused
by hitting the ground, an impact of a different player
or other non-specific sounds.
To increase the confidence that a real swing oc-
curred at the audio-based detected moment of impact,
we further examine whether a golf ball left the scene
at the detected frame. Therefore, we subtract the
frame a specific time before and after the detected
impact frame from another as shown in Figure 4 a)-c).
To reduce the probability of occlusions in the
assumed area where the golf ball is located caused by
the club itself, the frame difference from the impact
frame at 60 fps is set to 3. That is, if an impact
is detected in frame f
event
, we subtract the frame
f
event
− 3 with the frame f
event
+ 3.
In combination with the assumption that the golf
ball is in the lower third of the image, it is possible
to detect a ball with a particularly high confidence
using established computer vision methods. By
binarizing the image as shown in Figure 4 c) using
a threshold obtained from the Otsu method (Otsu,
1979), a golf ball leads to an explicit pixel structure
with a certain roundness and size. Using the Blob
Detector from OpenCV (OpenCV, 2023b) on the
icSPORTS 2023 - 11th International Conference on Sport Sciences Research and Technology Support
122
Figure 5: Visualization of threshold impact: a) threshold =
10 , b) threshold = 20 c) threshold = 30, d) threshold = 40.
resulting image in Figure 4 d), we get the information
if a ball is included in the image and further the size
and position in pixel values. If the detection of a golf
ball is successful, the impact detection is marked as
valid, if there is no golf ball included in the resulting
image, the detection is marked as false.
In contrast to ball- or club-tracking approach,
using audio-event-triggered swing detection, we
achieve lower computing time and a independence
from possible occlusions of balls, when, for example,
setting up for a swing or other arbitrary movements
in the scene.
2.2 Launch Angle Measurement
With the resulting information from the swing detec-
tion as described above, namely the exact moment
when a swing occurred and the ball position in pixel
values, we address the problem of measuring the
launch angle of the golf ball using monocular video
data. Due to the high velocities that a golf ball can
reach while playing golf, averaging up to ∼270 km/h
(Hahn, Christian, 2017), an exact tracking of the golf
ball during flight requires either a high-speed camera
or other technologies such as those mentioned in
the Introduction section. To solve this problem with
a low frame rate camera (60-120 fps), we use the
motion blur created by the launching ball in the
detected impact frame. The basis for this is a high
contrast between the golf ball and the background,
which is given by the golf sport itself, using mostly
white or yellow golf balls, which are hit either from a
green practice mat or grass.
To detect the motion blur caused by the ball,
we use a method similar to the one we used for swing
detection. Given the impact frame f
impact
, we created
two images f
−
and f
+
by calculating the absolute
difference between the image frame f
impact
and frame
f
impact
− 1 and also between frame f
impact
and frame
f
impact
+ 1. Subsequently, by calculating the addition
of these two resulting images f
−
and f
+
, we get the
resulting image where we perform the ball launch
detection on. In contrast to the previous method, it
is necessary to consider three images due to the low
frame rate combined with a lack of synchronization
between the moment of impact and the moment an
image is recorded. This could lead either to a small
motion blur structure in image f
−
or to the situation
that the ball already left the scene in image f
+
.
Figure 6: Processing steps: a) image subtraction and addi-
tion, b) result of a), c) preprocessed image of b) d) result of
line detection with ROI.
Combining the information included in the images f
−
and f
+
, by adding these two images to one another,
we increase the probability of detecting the desired
motion line, as seen in Figure 5 c).
To separate the motion blur caused by the club from
the motion blur caused by the golf ball, we binarize
the image with a certain threshold. Looking at each
pixel of a grayscale image, we compare the pixel’s
value with the before mentioned threshold. If the
Vertical Launch Angle Measurement of a Golf Ball Using Audio and Monocular Video Data
123
Data: Binary Image I
b
, Ball Position P
b
Result: Angle δ
Apply HoughLinesP from OpenCV and
assign results as list of lines L;
Compute ROI using Ball Position P
b
and
max. angle α =50°;
forall line in L do
if line in ROI then
Compute midpoint m and angle β of
line;
Compute angle γ between m and P
b
;
if D(β,γ) > 3° then
remove line
end
else
remove line;
end
end
Apply RANSAC Algorithm from SciPy on
resulting list of lines L;
Compute angle δ of resulting line;
Algorithm 1: Launch angle detection.
value is below the threshold, the pixel value is set
to 0 (black) and if the value is above the threshold,
the pixel value is set to 255 (white). Figure 5 shows
the effect of different threshold values while creating
a binary image. We can observe that by setting a
threshold to low (<20), the motion blur created by
the club overlays the structures created by the ball
(Figure 5 a)), on the other hand if the threshold is too
high (>30) it occurs, that the motion line created by
the launching ball is erased from the image (Figure
5 d)). The optimal threshold value is observed to be
between 20 and 30, as seen in Figure 5 b) and c), the
line created by the motion blur of the ball is clearly
visible and can be extracted from the image using
computer vision methods.
Algorithm 1 describes our approach for detect-
ing the launch angle, based on the binary image I
b
,
using computer vision methods. First, we specify
a region of interest (ROI), which is defined by the
ball position achieved from the swing detection (2.1)
and an assumed minimum and maximum launch
angle, which is shown in Figure 6 d). To improve
the line detection using the probabilistic hough line
transform from OpenCV (OpenCV, 2023a), we apply
a sequence of computer vision methods including a
morphological opening, a horizontal Sobel filter and
a Canny Edge Detection (6 c)). The following line
detection returns a set of lines, of different length and
direction. By taking into account the minimum and
maximum launch angle condition, and additionally
the constraint that an extension of the lines must pass
the ball’s center position with a defined offset, we
can perform a selection of lines that represent the
golf ball’s line of motion with a high probability.
To detect possible outlier, we ran the Random
Sample Consensus (RANSAC) algorithm (Fischler
and Bolles, 1981) for linear regression using the
endpoints of the selected lines.
The resulting line is considered to represent the
launch of the golf ball, with respect to the x-axis of
the image.
2.3 Experiment
For the evaluation of the presented launch angle mea-
surement approach, we use a radar-based launch mon-
itor, as described in the Introduction section, the
Garmin Approach R10 (Garmin Ltd. , Swiss, ∼600
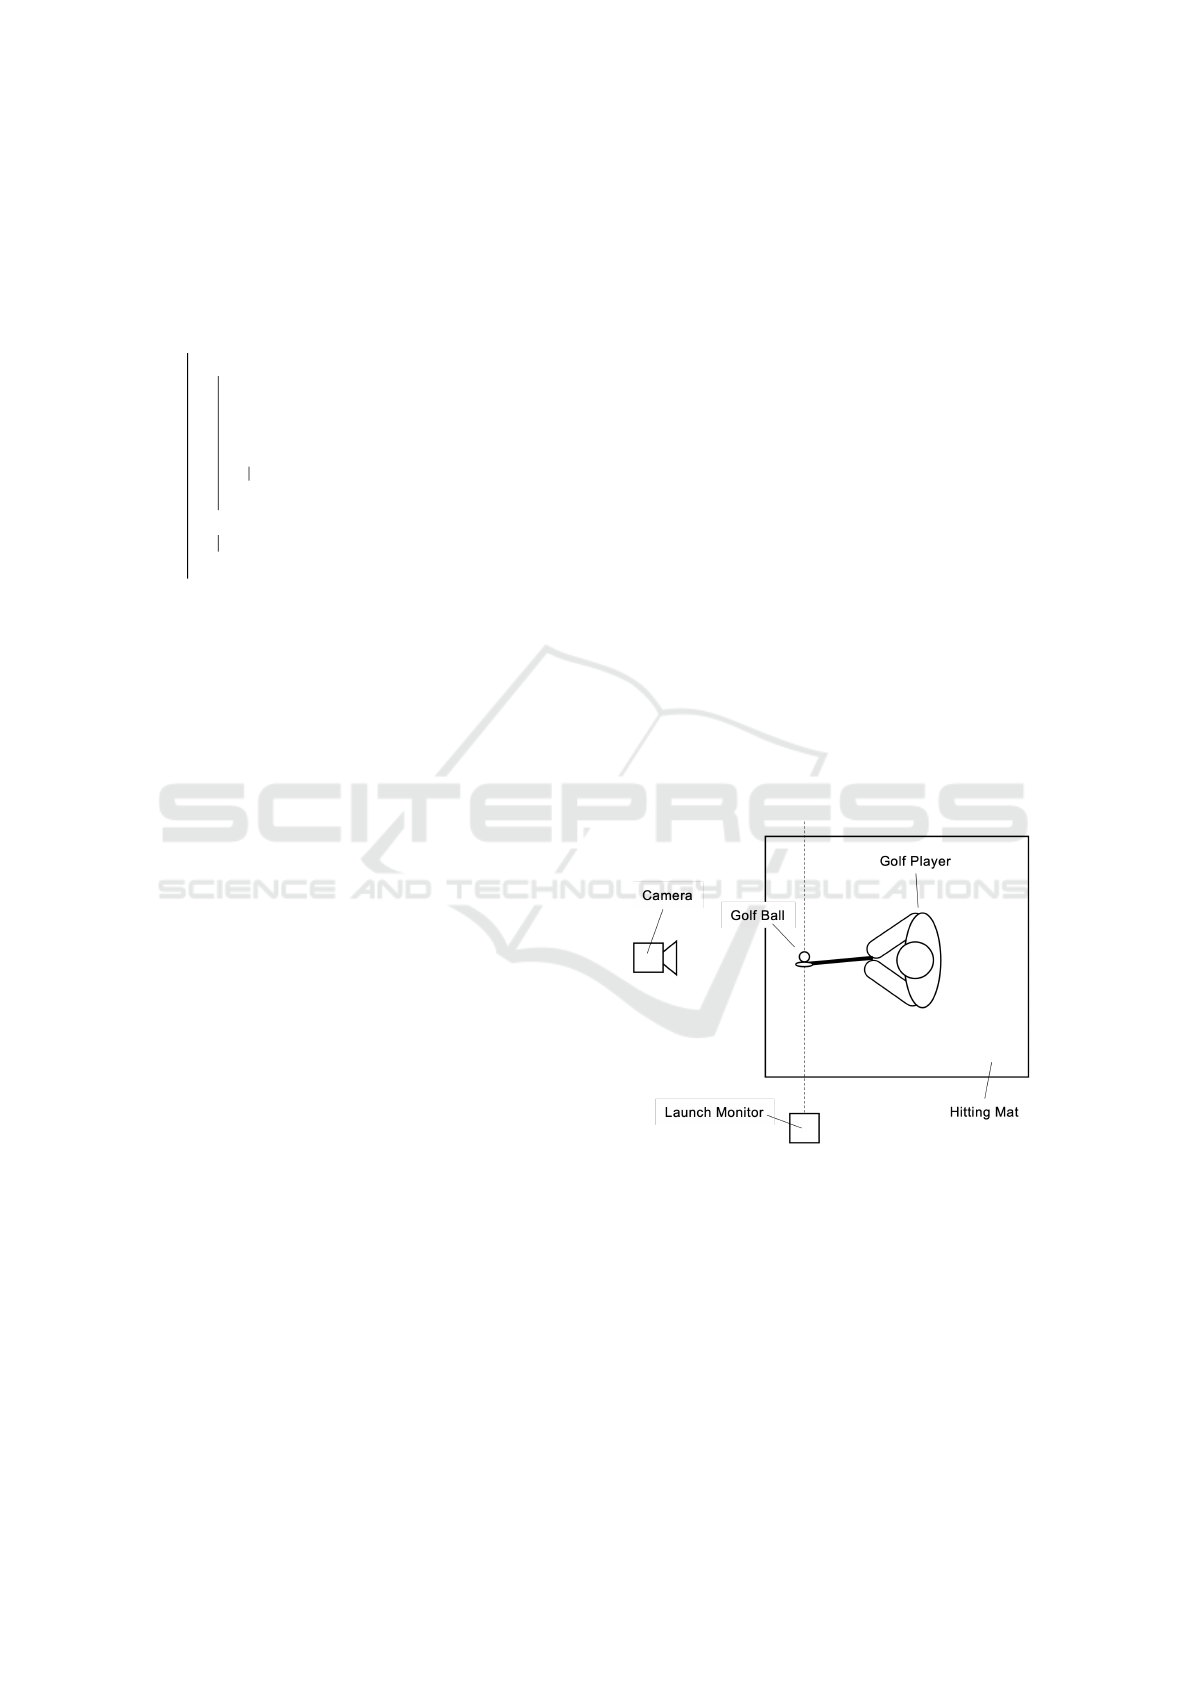
$) (Garmin Ltd., 2023). The setup for this is shown in
Figure 7, where the camera used for our approach is
placed in front of the golf player at a distance of ∼2
meters from the golfer. The commercial launch mon-
itor is placed to the left of the golf player at a distance
of 2.1 meters from the ball.
Figure 7: Setup for evaluation.
To compare our approach with the results of the
launch monitor, we recorded 41 golf swings with two
different frame rates, 60fps and 120fps, while using
two different clubs, varying in loft angle and length.
The clubs used are a high loft pitching wedge (PW)
and a relative low loft 7 iron. The specifications are
listed in Table 2.
icSPORTS 2023 - 11th International Conference on Sport Sciences Research and Technology Support
124
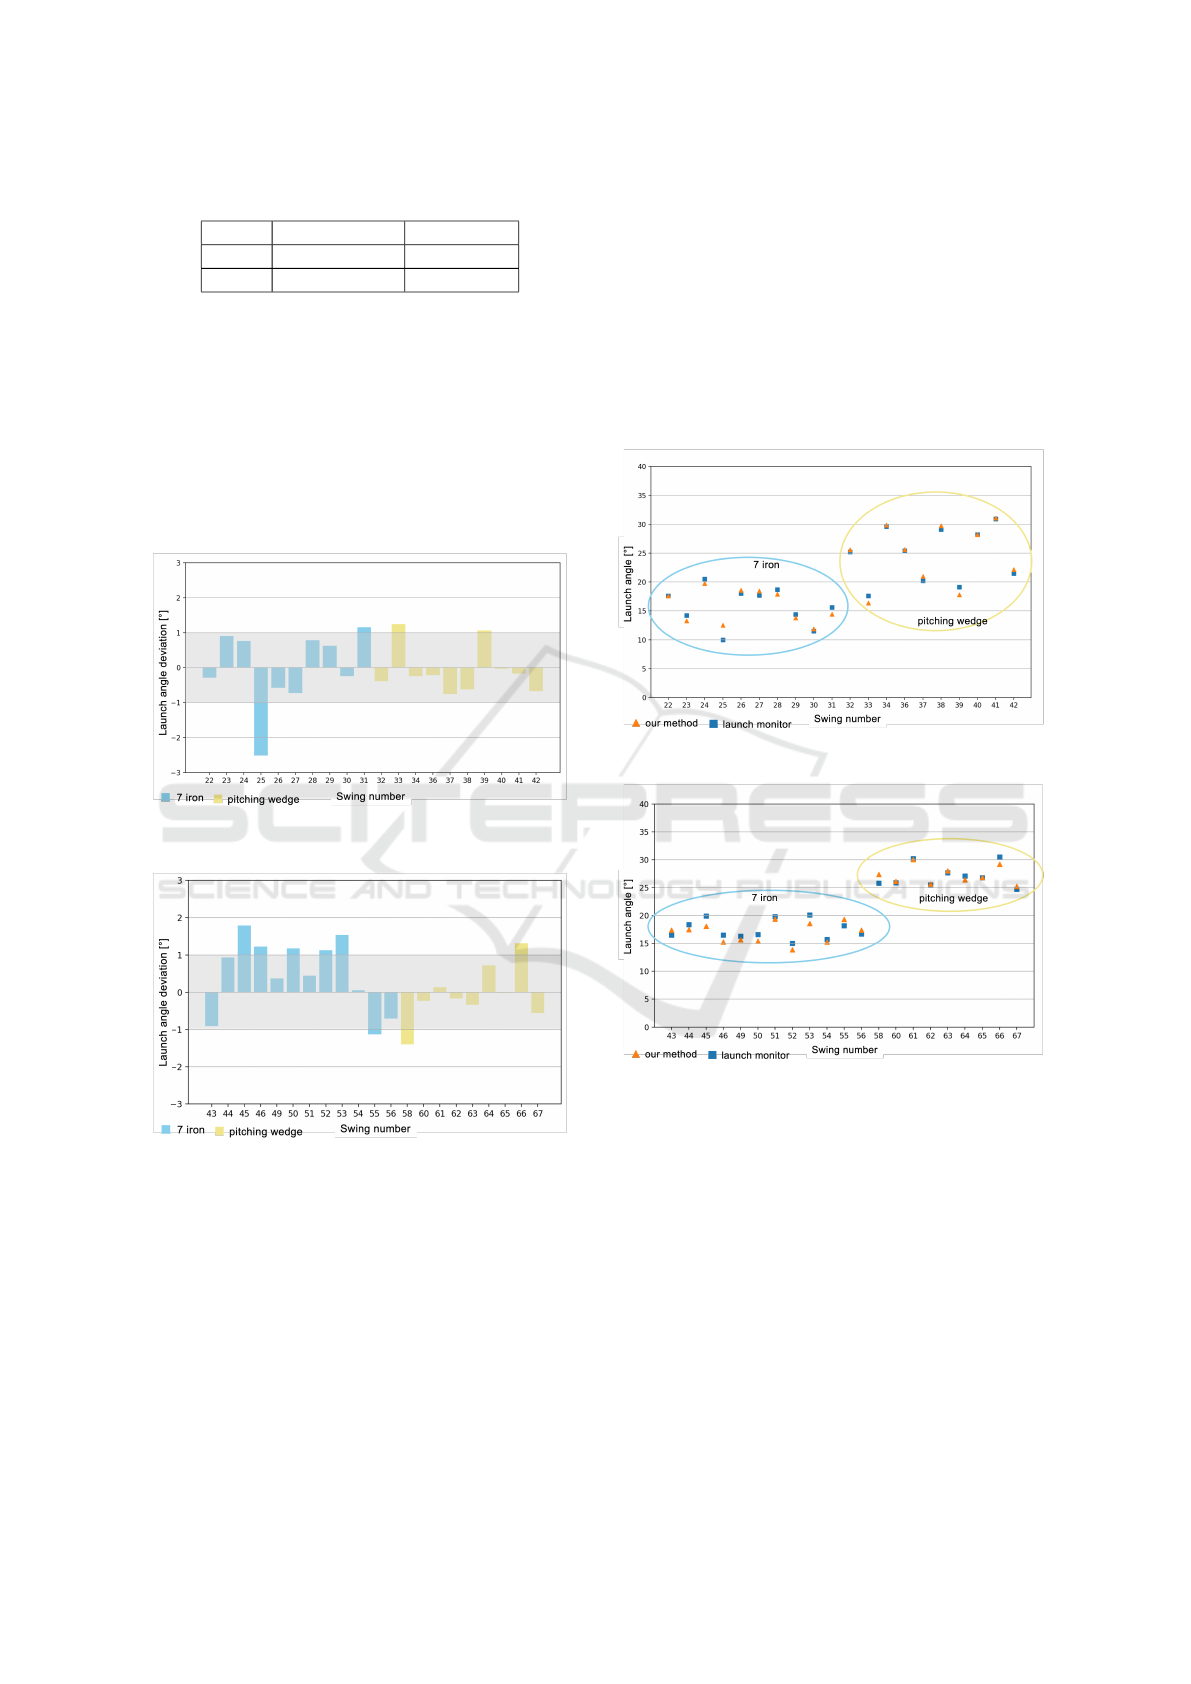
Table 2: Club specification of ping rapture V2.
Club Loft angle [°] Length [m]
PW 45° 0.94 m
7 iron 32° 0.97 m
3 RESULTS & DISCUSSION
As the use of audio and monocular video data to esti-
mate golf launch parameters are underrepresented in
the literature, the evaluation of our method is cur-
rently limited to a comparison with the results ob-
tained using a launch monitor as described in section
2.3.
Figure 8: Deviation between the launch monitor results and
our approach using a framerate of 60 fps.
Figure 9: Deviation between the launch monitor results and
our approach using a framerate of 120 fps.
The results of the comparison for each swing
examined at either 60 fps or 120 fps are shown
in Figure 8 and 9 as the deviation between our
approach and the used launch monitor in degrees.
The tolerance of the Garmin Approach R10 regarding
the vertical launch angle measurement is given as ±
1°. The tolerance range is represented as a gray area
in Figure 8 and 9. The computation time for each
swing is observed to be ∼4 seconds on average with
a standard deviation of 1.3 seconds, using a 1,4 GHz
Quad-Core Intel Core i5 and an unoptimized code.
It can be seen that our approach provides results
that are in strong agreement with the measurements
of the Garmin Approach R10. Table 3 shows the
absolute average deviation for each used club at each
frame rate, along with the combined absolute average
deviation. In addition, it can be observed that the
overall absolute average deviation is smaller than the
tolerance range of the used ground truth system.
Figure 10: Absolute value comparison at 60 fps.
Figure 11: Absolute value comparison at 120 fps.
As we can see in Table 3, the deviation for the club
with the higher loft angle, the pitching wedge, is
significant lower than the 7 iron. Due to the length
difference (see Table 2) between the clubs used,
the club head speed of the 7 iron is assumed to be
higher than the pitching wedge, which leads to the
assumption that the results are speed dependent. Fur-
thermore, isolated deviations can be observed, such
as swing No.25 (see Figure 8), which are assumed to
be related to the horizontal launch angle as described
in the following section. However, looking at the
absolute difference in Figure 10 and 11, we can see a
high correlation between the results of the different
measurement methods.
Vertical Launch Angle Measurement of a Golf Ball Using Audio and Monocular Video Data
125

Table 3: Absolute average deviation of our approach.
Club 60 fps 120 fps Combined
PW 0.63° 0.59° 0.61°
7 iron 0.77° 0.95° 0.86°
Combined 0.7° 0.77° 0.74°
4 LIMITS
The use of a monocular camera system results in lim-
itations regarding the accuracy of the measurement.
Due to the projection on a two-dimensional plane,
we have a loss of information about the horizontal
launch direction. If the horizontal launch angle is sig-
nificantly higher or lower than 0°, meaning that the
launch direction is to the left or right of the target di-
rection, it will lead to a incorrect measurement. Fig-
ure 12 shows that if the launch direction is pointing
away from the camera plane, it will lead to a pro-
jection on a two-dimensional plane that indicates a
higher vertical launch angle than it actually is. Con-
sequently, it will be measured lower if the launch di-
rection is pointing towards the camera plane.
Figure 12: Perspective projection of different horizontal
launch angles with constant vertical launch angle.
Therefore, our approach only provides accurate
results when the horizontal launch angle is close to
zero, meaning the launch direction is similar to the
target direction or parallel to the camera plane.
5 CONCLUSION
We presented an approach to measure the vertical
launch angle of a golf ball using only video and audio
data in combination with a low frame rate, reaching
an accuracy equal to the results of a commercial
launch monitor, the Garmin Approach R10, using
a radar-based method. This means that with our
approach, a golf player has the ability to measure the
vertical launch angle of their golf shot without the
need for specific hardware such as a launch monitor,
just a camera and a PC, or any device that combines
the two such as a smartphone or tablet.
It should be noted that this approach is designed
for offline use only, meaning that we only analyzed
pre-recorded video data. However, looking at the
results in terms of computation time, our approach
has the potential to be an online application leading
to a system which is capable of providing direct
feedback to the golf player after the golf swing.
Therefore, only the audio event detection of the
swing detection algorithm needs to be adapted to
detect the club impact with the ball without the
information after the swing, for example by training
a CNN-based audio classifier.
In addition to an online capability, the motion
blur detection will also be tested regarding club
related parameters such as dynamic loft, angle of
attack or club head speed. Concluding a detailed
data fusion of audio and video data has a great po-
tential to achieve a higher accuracy of our approach
and to develop new methods for launch parameter
measurements or golf assistance systems.
REFERENCES
Chotimanus, P., Cooharojananone, N., and Phimoltares, S.
(2012). Real swing extraction for video indexing in
golf practice video. In 2012 Computing, Communi-
cations and Applications Conference, pages 420–425.
IEEE.
Fischler, M. A. and Bolles, R. C. (1981). Random sample
consensus: a paradigm for model fitting with appli-
cations to image analysis and automated cartography.
Communications of the ACM, 24(6):381–395.
FlightScope Mevo LLC (2023). Flightscope mevo -
portable golf launch monitors and simulators. https://
www.flightscopemevo.eu/. Last checked on April 27,
2023.
Garmin Ltd. (2023). Garmin approach r10. https://
www.garmin.com/de-DE/p/695391/. Last checked on
April 27, 2023.
GOLFTEC Enterprises LLC (2023). The skytrak expe-
rience. https://www.skytrakgolf.com/launch-monitor.
Last checked on April 27, 2023.
Guadagnoli, M., Holcomb, W., and Davis, M. (2002). The
efficacy of video feedback for learning the golf swing.
Journal of sports sciences, 20(8):615–622.
Hahn, Christian (2017). 2017 pga and lpga tour avg. https:
//blog.trackmangolf.com/2017-pga-lpga-tour-avg/.
Last checked on April 27, 2023.
Johansson, U., K
¨
onig, R., Brattberg, P., Dahlbom, A., and
Riveiro, M. (2015). Mining trackman golf data. In
2015 International Conference on Computational Sci-
ence and Computational Intelligence (CSCI), pages
380–385. IEEE.
Kiraly, C. (EP 1 509 781 B1, Mar. 2005). Flight parameter
measurement system.
icSPORTS 2023 - 11th International Conference on Sport Sciences Research and Technology Support
126

Leach, R. J., Forrester, S. E., Mears, A., and Roberts, J. R.
(2017). How valid and accurate are measurements of
golf impact parameters obtained using commercially
available radar and stereoscopic optical launch moni-
tors? Measurement, 112:125–136.
OpenCV (2023a). Hough line transform. https://docs.
opencv.org/3.4/d9/db0/tutorial hough lines.html.
Last checked on April 27, 2023.
OpenCV (2023b). Simpleblobdetector class refer-
ence. https://docs.opencv.org/3.4/d0/d7a/classcv 1
1SimpleBlobDetector.html. Last checked on April 27,
2023.
Optimum Golf Technologies Ltd (2023). Gcquad launch
monitor: Foresight sports. https://foresightsports.eu/
launch-monitors/gcquad/. Last checked on April 27,
2023.
Otsu, N. (1979). A threshold selection method from gray-
level histograms. IEEE transactions on systems, man,
and cybernetics, 9(1):62–66.
Trackman A/S (2023a). The complete performance solu-
tion. https://www.trackman.com/. Last checked on
April 27, 2023.
TrackMan A/S (2023b). What we track. https://www.
trackman.com/golf/trackman-4/what-we-track. Last
checked on April 27, 2023.
Tuxen, F. (EP2218483A2, Aug. 2010). Determination of
spin parameters of a sports ball.
Wood, P., Henrikson, E., and Broadie, C. (2018). The in-
fluence of face angle and club path on the resultant
launch angle of a golf ball. In Proceedings, volume 2,
page 249. MDPI.
Zhang, T., Zhang, X., Yang, Y., Wang, Z., and Wang, G.
(2020). Efficient golf ball detection and tracking based
on convolutional neural networks and kalman filter.
arXiv preprint arXiv:2012.09393.
Vertical Launch Angle Measurement of a Golf Ball Using Audio and Monocular Video Data
127
