
Feature Extraction Methods for Neural Networks in the
Classification of Structural Health Anomalies
Natasha Hamilton
1a
, Jim Harkin
1b
, Liam McDaid
1c
, Junxiu Liu
1d
and Eoghan Furey
2e
1
School of Computing, Engineering and Intelligent Systems, Ulster University, Northland Road, Derry, U.K.
2
Department of Computing, Atlantic Technological University, Port Road, Donegal, Ireland
Keywords: Structural Health Monitoring, Feature Extraction, Spiking Neural Networks, Classification.
Abstract: Failure of large complex structures such as buildings and bridges can have monumental repercussions such
as human mortality, environmental destruction and economic consequences. It is therefore paramount that
detection of structural damage or anomalies are identified and managed early. This highlights the need to
develop automated Structural Health Monitoring (SHM) systems that can continuously allow the safety status
of structures to be determined, even in the worst and most isolated conditions, to ultimately help prevent
destruction and save lives. Signal processing is a crucial step to detecting structural anomalies and recent
work demonstrates the opportunities for neural networks, however the encoding of data for SHM requires the
extraction of features due to often, noisy data. This paper focuses on feature extraction methods for artificial
neural networks (ANNs) and spiking neural networks (SNNs) and aims to identify bespoke features which
enable SNNs to encode data and perform the classification of anomalies. Results show that extraction of
particular features in large real-world applications improve the classification accuracy of SNNs.
1 INTRODUCTION
Large man-made civil infrastructures exercise an
important role in both the societal and economical
evolution of the modern world (Khemapech,
Sansrimahachai & Toahchoodee, 2016; Song et al,
2020). Structures such as bridges, tunnels and
buildings are used on a daily basis by billions of
people worldwide, to complete day-to-day activities
(Khemapech, Sansrimahachai & Toahchoodee,
2016). With this in mind it is critical that complex
structures such as these, are continually fit for their
intended purpose and are safe for human use (Ibrahim
et al, 2020). This is a challenging task as throughout
their operational lifetime, artificial structures are
highly vulnerable to damage (Li et al, 2015).
Exposure to a number of environmental,
anthropogenic and operational factors can all
contribute to causing structural deterioration
(Abdeljaber et al, 2017). There are many different
a
https://orcid.org/0000-0001-7699-1216
b
https://orcid.org/0000-0001-7484-8205
c
https://orcid.org/0000-0002-1197-4375
d
https://orcid.org/0000-0002-9790-1571
e
https://orcid.org/0000-0002-6697-1462
types of damage that can surface, for example in the
forms of corrosion, erosion, degradation or decay, all
of which have the potential to cause structural
collapse and require continuous monitoring
(Abdeljaber et al, 2017). Areas that are incredibly
difficult to access or that are susceptive to natural
disasters like landslides, earthquakes or forest fires
are often affected by such catastrophic devastation
(Moaveni et al, 2011). Disasters such as these can
occur without warning so preparation is crucial,
having functional and well-maintained infrastructure
is extremely important, as it will reduce the potential
aftermath of future disasters (Pang et al, 2020).
Traditionally, the severity of damage to a structure
is visually assessed by experienced human inspectors,
who physically examine any structurally unsound
sites (Pang et al, 2020). Visual analysis, despite the
extensive efforts of inspectors, experience a number
of challenges; restricted access to damaged locations,
lengthy inspection completion times and regular
514
Hamilton, N., Harkin, J., McDaid, L., Liu, J. and Furey, E.
Feature Extraction Methods for Neural Networks in the Classification of Structural Health Anomalies.
DOI: 10.5220/0012184800003595
In Proceedings of the 15th International Joint Conference on Computational Intelligence (IJCCI 2023), pages 514-523
ISBN: 978-989-758-674-3; ISSN: 2184-3236
Copyright © 2023 by SCITEPRESS – Science and Technology Publications, Lda. Under CC license (CC BY-NC-ND 4.0)

manual structural maintenance assessments
(Hernandez, Roohi, & Rosowsky, 2018).
Additionally, localized experimental fault
detection techniques such as radiographs, thermal
field methods and acoustic or ultrasonic approaches
have also, been used to identify structural damage
(Doebling et al, 1996). However, the issue with these
methods is that the damaged areas must be known and
accessible for inspection prior to experimental
analysis (Doebling et al, 1996). These limitations
highlight the need to computerise this monitoring
process to make identifying, locating and determining
damage more efficient and accurate (Song et al,
2020).
This has led to the need to develop automated
SHM and damage identification systems that can
detect and monitor infrastructural damage, without
human interaction (Anton, Inman & Park, 2009;
Moaveni et al, 2010). These physical SHM systems
need to be accurate and efficient whilst remaining
operational for extended periods, for example, in
buildings, and concealed in concrete infrastructures
(Abdo, 2014; Yu, Wang, & Meng, 2005). A key
challenge that needs to be considered is how to
effectively manage and process large amounts of raw
data obtained from these systems whilst still being
able to classify structural damage correctly and
efficiently. This, therefore, establishes the focus for
this paper; to investigate the extraction of specific
features from large real-world datasets, in order to
achieve the highest degree of accuracy possible when
applied to brain-inspired solutions.
The remainder of this paper is organised with
section 2 outlining an overview of SHM, neural
networks and the key challenges. Section 3 defines
the selected SHM dataset/application and the analysis
of various feature extraction techniques. Section 4
reports on the accuracy evaluation of both ANN and
SNN networks based on bespoke extracted features.
Finally, section 5 discusses future work and provides
a conclusion.
2 BACKGROUND
It is inevitable that structures will degrade over time
due to a number of factors, including frequent use and
environmental causes like soil erosion, flooding or
unexpected anomalies like earthquakes, landslides or
forest fires (De La Torre et al, 2020). It is therefore
paramount, for both safety and financial reasons to
monitor large complex infrastructures such as
buildings, bridges, dams and railroads, on a regular
basis (Nuhu et al, 2020). SHM is an engineering field
that focuses on developing damage identification
systems that can monitor and evaluate the condition
and stability of man-made structures (Crémona, 2016;
Semperlotti, 2009). The techniques used are designed
to enable early damage detection, allowing preventive
measures to be implemented to avoid structural
failure, such as required maintenance and structural
reinforcement (Couture, 2013).
SHM has progressed rapidly in recent years, due
to the evolution of sensor networks, data processing
and information management (Li et al, 2015). This
automation has led to the development of increased
precision and financially feasible data acquisition
systems, as well as rapid growth in dataset size
(Crémona, 2016). There are, however, still challenges
that need to be addressed.
2.1 Structural Health Monitoring
(SHM) Techniques
To achieve a high level of accuracy and reliability,
SHM systems need to have a well-designed damage
classification framework, that enables structural
damage to be detected (Ying et al, 2013). Figure 1
shows the process of damage identification is
comprised of four core stages. The stages include: 1)
signal monitoring, 2) signal processing, 3) feature
extraction and 4) classification (Amezquita-Sanchez
& Adeli, 2015; Goyal & Pabla, 2015).
Data is obtained from a sensor network and
digitised during the signal monitoring stage. Signal
processing methods such as Fourier transforms,
Hilbert-Huang transforms, statistical time series
models, Wavelet transforms and Cohen’s class are
then used, to examine the data in order to extract,
determine and categorise core features (Goyal &
Pabla, 2015). Feature extraction, for example the
orthogonal decomposition technique, is then carried
out using measured data, to detect anomalous
information with the goal of revealing non-obvious
damage states (Eftekhar Azam, Rageh & Linzell,
2018; Overbey, 2008). Feature extraction, is
therefore, a key step in the damage identification
process. A number of techniques have been used
previously during the classification stage to identify
structural damage accurately and correctly. These
methods include clustering algorithms, specifically
K-means (KM) clustering, Support Vector Machines
(SVM), Artificial Neural Networks (ANN), Spiking
Neural Networks (SNN) and Hybrid Classifiers
(Goyal & Pabla, 2015).
Feature Extraction Methods for Neural Networks in the Classification of Structural Health Anomalies
515
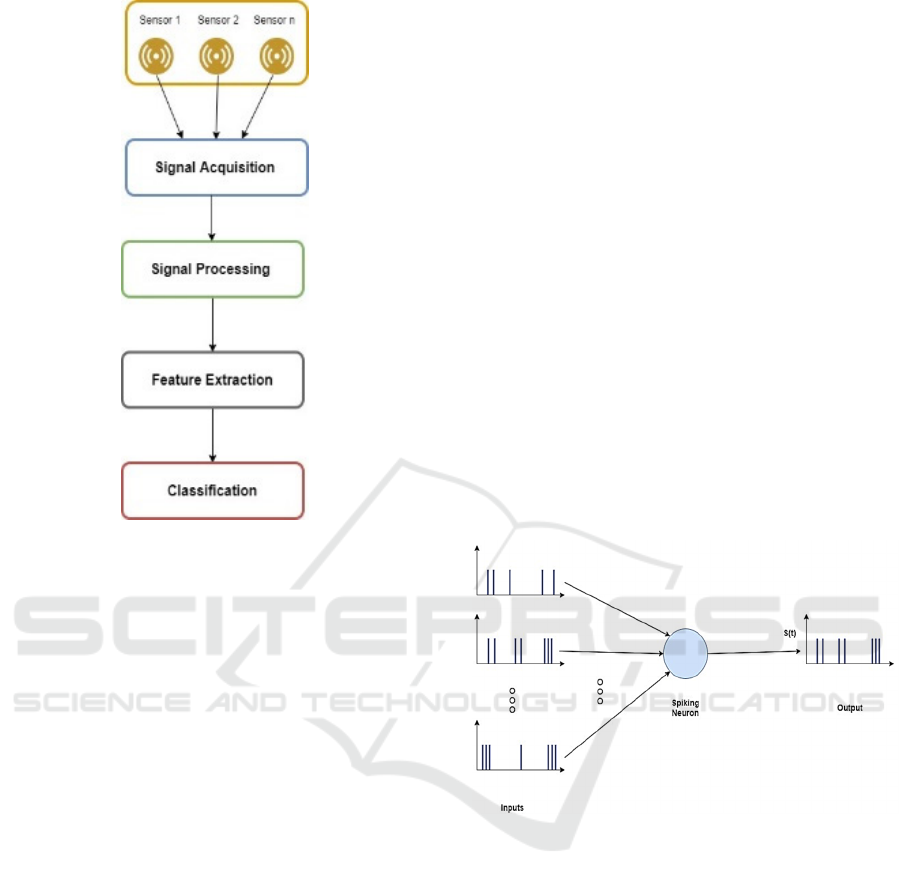
Figure 1: Four main damage identification stages within a
SHM system.
2.2 Artificial and Spiking Neural
Networks
ANNs consist of a number of vastly connected
processing nodes (neurons) that operate concurrently
(Keller, Liu & Fogel, 2016). These networks learn as
a result of training which is performed using datasets
where the input and output data is known (Keller, Liu
& Fogel, 2016). This data is used to train the neural
network and modulate the synaptic weights between
neurons (Keller, Liu & Fogel, 2016). ANNs are a very
beneficial tool as they have the functionality to
extract trends from input data (Notley & Magdon-
Ismail, 2018). However, despite this, factors such as
power utilisation and the expense of implementing
them in hardware as edge computing devices,
presently do not meet practicality requirements for
anomaly detection in real world, always-on
applications (Pang et al, 2020).
The original concept of ANNs has progressed
rapidly to develop generations of ANNs, which mimic
more closely the biological principles for learning and
fault tolerance (Pang et al, 2020). SNNs are considered
to be the third generation of ANNs (Paugam-Moisy &
Bohte, 2012). Derived from neuroscience
advancements and brain inspired natural computing,
these networks use an adapted version of the spike
timing of neurons to encode and process information
(Liu et al, 2017). Similar to biological NN, SNNs
enable communication through incorporating electrical
pulses (spikes) (Zhang, Gu, & Pan, 2018) with the
concept of time illustrated in Figure 2 In SNNs,
information is communicated via the timing between
spike events or frequencies. The integration of multiple
frequencies enables a spiking neuron to aggregate the
frequencies to reflect a membrane voltage increase
within the neuron. When a threshold is exceeded, the
neuron produces a single spike output. This process
enables temporal patterns to be identified via training
of synaptic weights which impact on the contribution
to the neuron’s membrane voltage.
There are a number of models that have been
developed to determine the impact of action potential
spikes on selected neurons, these include the
Hodgkin-Huxley (HH) model, the leaky integrate-
and-fire (LIF) model and the adaptive exponential
integrate-and-fire (AdExIF) model (Paugam-Moisy
& Bohte, 2012). The LIF model is the least
computationally expensive, in comparison to the HH
model which is deemed the most expensive (Paugam-
Moisy & Bohte, 2012).
Figure 2: Communicating information in SNNs.
Research to date has established the ultra-low
power capability of SNNs in hardware due to the fact
that energy is only consumed when an input spike is
received and processed, resulting in an overall saving
of power (Zhang, Gu, & Pan, 2018). Currently SNNs
have shown benefit in SHM system development, as
compared to ANNs, as the hardware expense is more
cost-effective and power efficiency is improved
(Pang et al, 2020).
The key challenge is the extraction of features
from the SHM data and the encoding of identified
features which improve the accuracy of the network.
This is challenging as the data from sensors (e.g.
accelerometers) is highly variable.
NCTA 2023 - 15th International Conference on Neural Computation Theory and Applications
516
3 DATASET & FEATURE
ANALYSIS
The identification of suitable benchmark data was a
key step, and the Qatar University Grandstand
Simulator (QUGS) (Avci, 2018) was selected due to
the availability of a full range of structural failures
across a known structure with labelled data points.
This dataset has also been used in several other works
(Abdeljaber et al, 2016; Abdeljaber et al, 2017; Avci
et al, 2018; Kiranyaz et al, 2021) and will form the
basis for benchmarking of performance.
The data was originally used by Abdeljaber et al.
(Abdeljaber et al, 2017) to develop a 1D
convolutional neural network (CNN) for vibration
based SHM, with the primary intention of developing
damage identification approaches that can efficiently
monitor present-day infrastructure (Kiranyaz et al,
2021). The simulator is situated in a laboratory
environment and is reported as the biggest stadium
framework constructed in a controlled environment
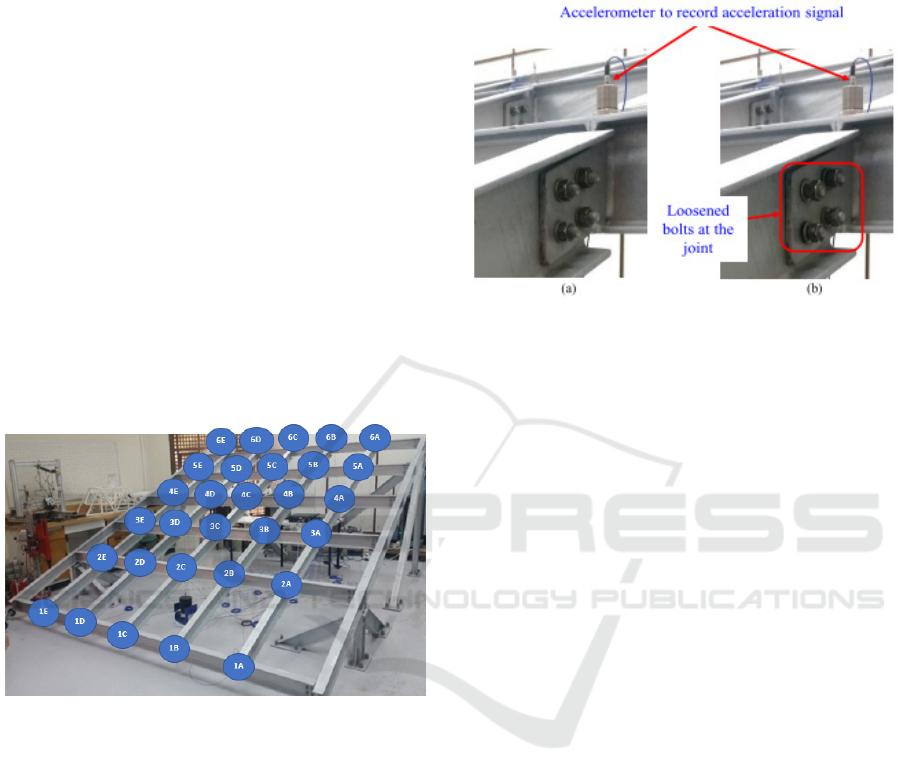
(Abdeljaber et al, 2016), shown in Figure 3.
Figure 3: QUGS Sensor Point Locations Identified. Source:
Adapted from (Abdeljaber et al, 2017).
Devised to hold 30 observers, the main hot-rolled
steel shell is 4.2m x 4.2m in size (Abdeljaber et al,
2017). The QUGS has a total of 30 structural joints
(shown as 1A to 6E in Figure 3), in which 30
accelerometers are used to measure the structural
vibrational response (Kiranyaz et al, 2021). The steel
frame is equipped with 27 PCB model 393B04
accelerometers and 3 B&K model 8344
accelerometers (Abdeljaber et al, 2017). Vibration
was applied to the structure through the use of a
modal shaker, that used a SmartAmp power amplifier,
to implement the signal to the shaker (Abdeljaber et
al, 2017). Finally, the production of the shaker input
and recording of the acceleration output are achieved
through using two 16-channel data acquisition
instruments (Abdeljaber et al, 2017).
Structural damage is injected by slackening the
bolts at a specific joint, which is a very slight
alteration to the structure’s rotational stiffness
(Kiranyaz et al, 2021), as displayed in Figure 4.
Figure 4: Demonstration of How Structural Damage is
Artificially Applied in the QUGS. Source: Adapted from
(Kiranyaz et al, 2021).
There were 31 damage tests implemented; 1
undamaged (healthy) case for benchmarking
purposes and 30 damaged cases to simulate structural
anomalies (Avci et al, 2018). Each scenario was
recorded for 256 seconds, at a sampling frequency of
1,024Hz, resulting in a total of 262,144 samples per
joint per test (Avci et al, 2018). This, therefore, results
in a total of 243,793,920 samples for the entire
dataset.
The particular reasons outlined demonstrate that
the QUGS dataset provides an ideal range of
anomalies for data training and evaluation purposes
of the neural networks.
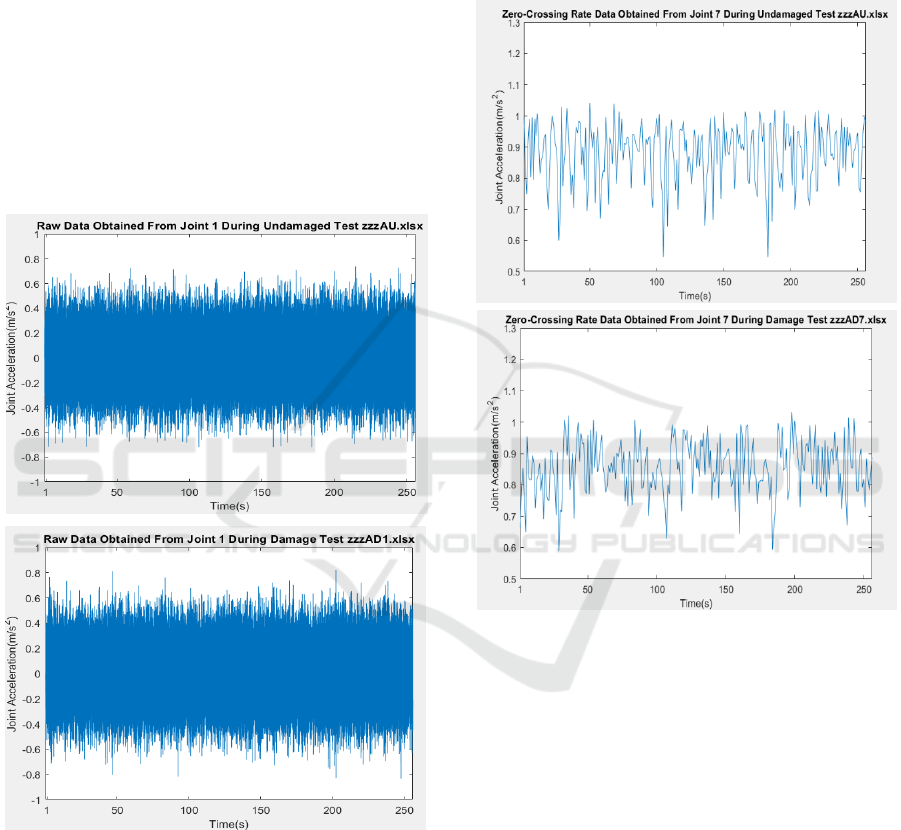
3.1 Raw Data
The QUGS dataset has a significantly large number
of raw data samples, 243,793,920 in total. This data
when graphically displayed is extremely noisy and
difficult to discern any visual trend or features, due to
high frequency sampling. It is therefore very difficult
to distinguish whether a sample is of a damaged or
undamaged state as seen in Figure 5.
Using this data in its raw form will make it
tremendously challenging for any classification
technique to determine the structural state accurately.
Therefore, feature extraction was required to ensure
that any potentially masked damage states reported in
the sensor data are identified and to consolidate to key
element of interest (Amezquita-Sanchez & Adeli,
2015).
Feature Extraction Methods for Neural Networks in the Classification of Structural Health Anomalies
517
Hence, feature extraction is a critical step in the
damage identification process.
3.2 Feature Selection
It is important to select features that best represent the
data. Certain features may suit specific real-world
datasets better than others. The choice of damage-
sensitive parameters for the QUGS dataset is based
on multiple different factors such as the data type and
which features will best identify the health status best.
There may be several features that could determine
structural health accurately whilst avoiding the effect
of various environmental and structural conditions
(Pang et al, 2020).
Figure 5: Displays the comparison of the raw noisy data at
joint 1 between a) an undamaged sample and b) a damaged
sample.
There two different types of sensors used in the
data acquisition process that measure bolt vibration
over a period of 256 seconds. This means that time
and frequency domains, due to the nature of the data,
can be used to extract specific features. These features
include mean, standard deviation, variance, energy,
Zero-crossing rate, and Fourier Transforms (Toivola
& Hollmén, 2009). Some features proved better than
others for example, zero-crossing rate only showed
very minor differences between the damaged and
undamaged data, when extracted from the noisy raw
data, as displayed in Figure 6 and therefore was not
the best feature choice.
Figure 6: Displays the comparison of zero-crossing rate at
joint 7 between a) an undamaged sample and b) a damaged
sample.
A number of MATLAB scripts were created to
firstly, extract a selection of features. These features
were then displayed graphically and analysed to
determine if there were any significant differences in
the damaged and undamaged data. This was to
ultimately determine which feature was the best
choice, in aiding damage identification. After this
extensive analysis process, several features: absolute
mean, variance, standard deviation and Fast Fourier
Transforms (FFT) were chosen, as they showed
distinguished profiles between undamaged and
damage data.
a
b
a
b
NCTA 2023 - 15th International Conference on Neural Computation Theory and Applications
518
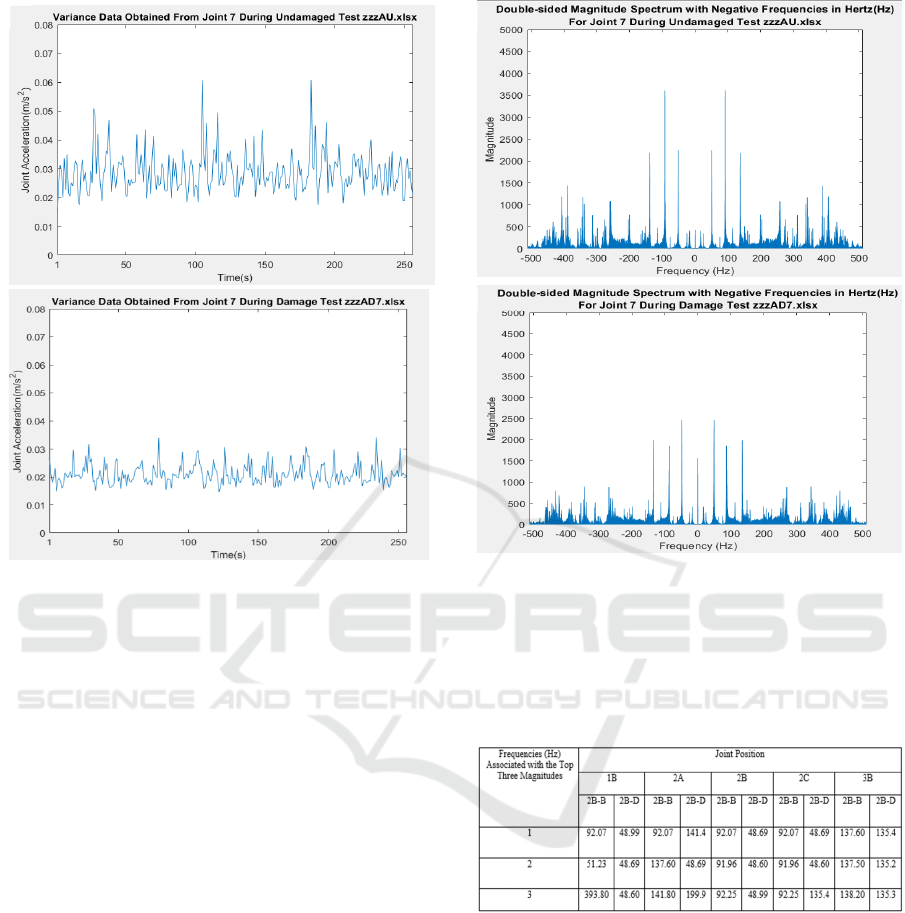
Figure 7: Illustrates the comparison of variance at joint 7
between a) an undamaged sample and b) a damaged sample.
3.3 Fast-Fourier Transform (FFT)
The Fast Fourier Transforms (FFT) proved to be the
superior feature for this particular dataset, as it
showed a considerable difference between the
damaged and undamaged data samples, as illustrated
in Figure 8.
This was identified through developing a
MATLAB script that was able to graphically display
a double-sided magnitude spectrum for each sample
and determine the top three highest magnitudes of
each one. Interestingly the frequency associated with
the third highest magnitude in each comparative
graph showed the largest difference in frequency
between the damaged and undamaged data.
This analysis also uncovered that the frequency
associated with third largest magnitude in the
undamaged joints, surrounding a damaged joint,
showed significant variation. In addition, looking at
these as a collective instead of individually could
also, prove as another technique to aid data
classification, as illustrated in Table 1.
Figure 8: Displays the comparison between Fast-Fourier
Transforms at joint 7 for a) an undamaged sample and b) a
damaged sample.
Table 1: Displays the frequencies associated with the three
largest magnitudes for joints 1B, 2A, 2B, 2C and 3B, for
both the benchmark data (2B-B) and the damaged data (2B-
D) when only the single joint 2B is damaged.
4 NEURAL NETWORK
APPLICATION
ANNs are a well-established technique making an
excellent benchmark for all other future designed
networks. This research aims to validate that an SNN
can make a relatively accurate prediction on real
world data. However, the dataset is extremely noisy
due a to high frequency sampling rate, making it very
challenging to classify. Therefore, it requires pre-
processing in extracting and analysing several
a a
b
b
Feature Extraction Methods for Neural Networks in the Classification of Structural Health Anomalies
519
features; this establishes the contribution from the
research.
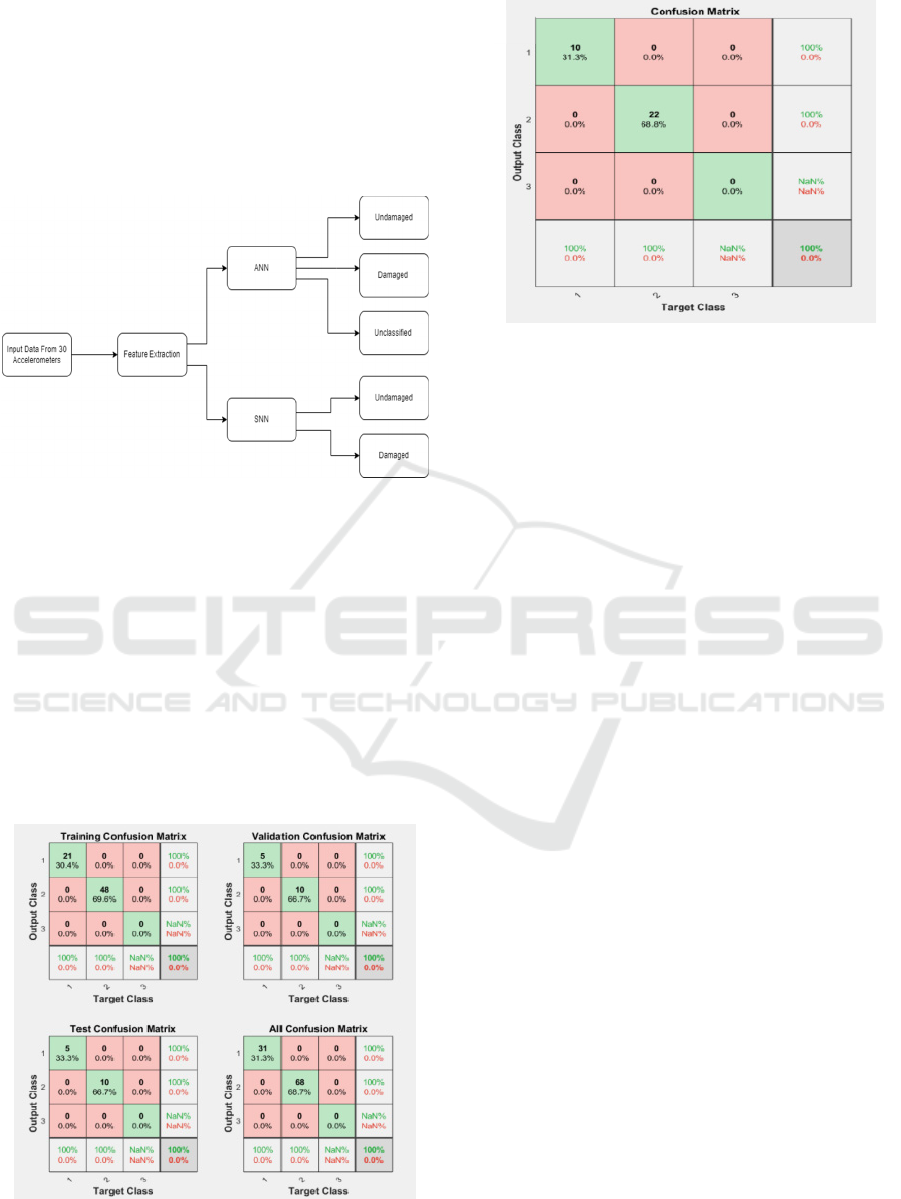
Each stage of this research is depicted in Figure 9,
where the main stages are: 1) Raw data obtained from
the 30 accelerometers, 2) Extraction of features from
the raw data, 3) Feature extracted data is inputted into
neural networks and 4) Output from neural networks
is determined.
Figure 9: Illustrates a summary of the workflow for this
research.
4.1 ANN
An ANN was established, using the feature extracted
data as the input data. This was created to classify
when an anomaly has occurred, i.e. detect if the input
data reflects a healthy or unhealthy structural state.
The Neural Network Toolbox in MATLAB was used
to develop the ANN. The network had 30 neurons in
the input layer and three output states: the three
outputs were predetermined prior to classification;
undamaged, damaged or unclassified.
Figure 10: Presents the confusion matrixes for the ANN for
a) training and b) testing.
The network was trained using 75 percent of the
feature extracted samples and tested on 25 percent of
the feature extracted samples. Both phases achieved
100 percent accuracy, correctly identifying all of the
damaged and undamaged samples, as shown in the
confusion matrix of Figure 10.
These results provide a benchmark to compare
with the SNN accuracy.
4.2 SNN
The QUGS feature extracted data is represented as
numerical numbers. To enable the development of an
SNN the data must first be encoded into spike trains
which represent a frequency, in order to be used as
input data.
Using PyCharm with a python package called
BindsNet, the selection of a new encoding scheme
was required to best reflect the varied data. The data
spanned over a large range of frequencies between
approximately 15Hz – 475Hz. To make this range
smaller a banding system was created, dividing the
data into 10Hz wide bands comprising of 47 in total.
As the band intervals increase in size, so do the length
of the spike trains, adding additional spikes to each
band, making each one larger than previous. The total
spike trains are repeated to provide a 1-second
duration of stimulus, i.e. to achieve an appropriate
length of input stimulus for the SNN.
The SNN consisted of 30 neurons in the input
layer (one neuron per joint in the dataset) and 2 output
LIF neurons: undamaged, damaged. The SNN is a
fully connected network and uses the Spike-Timing
Dependant Plasticity (STDP) learning algorithm.
The network was able to achieve an accuracy level
of 87.5 percent and was able to identify all of the
undamaged samples and majority of the damaged
b
a
NCTA 2023 - 15th International Conference on Neural Computation Theory and Applications
520

samples, when trained on 75 percent and tested on 25
percent of the feature extracted data. An equal amount
of damaged and undamaged samples were used in
both the training/testing groups. Comparative work
has been conducted by Zanatta et al, achieving an 88
percent accuracy level in comparison to the 87.5
percent accuracy level from this research (Zanatta et
al, 2021). However, the comparative network is a
Long Short-Term SNN (LSNN) and is significantly
more complex with recurrent neurons, and also in
neuron density with between 50 to 500 input neurons,
20 recurrent neurons and 2 output neurons (Zanatta et
al, 2021).
The proposed SNN was created to determine if the
QUGS data could be classified correctly, as the vision
for this work is to incorporate a self-repair element,
in the form of an artificial astrocyte cell into the SNN
network, providing the additional capability to
tolerate failure. Rapid decision-making was not the
aim of this research but is ultimately a focus of future
work.
4.3 Comparing SNN Against ANN
The ANN proved to have overall, a better level of
accuracy of 100 percent identifying all of the
damaged and undamaged structural health states
correctly, in comparison to the SNN which classified
87.5 percent of the samples correctly. This is
demonstrated in Table 2.
Table 2: Displays the results comparing the accuracy of the
ANN and SNN, when trained on 75 percent and tested on
25 percent of the data.
The ANN results provide good benchmark data
and was expected to have a higher level of accuracy
compared to the SNN. This is because ANNs are well
established and not overly complex.
However, when considering the application of
SHM require low power and compact edge
computing capabilities, SNNs can achieve must lower
area/power performances than ANN equivalents
(Yang et al. 2021). There is a trade-off between high
accuracy/high-compute overheads and meeting
lower-power budgets but with a reduction in
accuracy.
SNNs are more complex but possess the ability to
incorporate a self-repair element into the network;
ANNs do not have this capability. This network sets
the foundation for future research.
5 CONCLUSION AND FUTURE
WORK
Feature extraction is a key step when developing
structural health applications and working with large
datasets. Based on this work, it is evident that there
are particular features that suit bespoke datasets better
than others. FFT demonstrated to be the superior
feature in the QUGS dataset. This contributed to the
overall accuracy results achieved by the ANN and
SNN, as the input data was more discernible between
damaged and undamaged samples than displayed in
the raw data. This, therefore, aided data classification.
Future work could involve incorporating the use
of ensembles to further improve the accuracy and
performance of the SNN. However, the main goal is
to develop the SNN further by creating an astrocyte-
neuron network (SANN), that can monitor and
classify structural damage as well as realising self-
repairing capabilities (Liu et al 2017). Upon
achieving a good level of accuracy, the intention is to
implement the network in FPGA hardware, where the
systems performance will be benchmarked against
conventional methods and evaluated, in terms of
reliability and accuracy. This should enable large
man-made structures to be monitored for long periods
of time, without human intervention.
REFERENCES
Abdeljaber, O., Avci, O., Kiranyaz, S., Gabbouj, M., &
Inman, D. J. (2017). Real-time vibration-based
structural damage detection using one-dimensional
convolutional neural networks. Journal of Sound and
Vibration, 388, 154–170. https://doi.org/10.1016/j.jsv.
2016.10.043
Abdeljaber, O., Younis, A., Avci, O., Catbas, N., Gul, M.,
Celik, O., & Zhang, H. (2016). Dynamic testing of a
laboratory stadium structure. Geotechnical and
Structural Engineering Congress 2016. https://doi.org/
10.1061/9780784479742.147
Abdo, M. (2014). Structural Health Monitoring, History,
Applications and Future. A Review Book. New York,
NY, USA.
Amezquita-Sanchez, J., & Adeli, H. (2015). Feature
extraction and classification techniques for health
monitoring of structures. Scientia Iranica, 1931–1940.
Anton, S. R., Inman, D. J., & Park, G. (2009). Reference-
free damage detection using instantaneous baseline
measurements. AIAA Journal, 47(8), 1952–1964.
https://doi.org/10.2514/1.43252
Avci, O. (2018). Qatar University Grandstand Simulator
(QUGS). Onur Avci. http://onur-avci.com/benchmark/
qugs/
Feature Extraction Methods for Neural Networks in the Classification of Structural Health Anomalies
521

Avci, O., Abdeljaber, O., Kiranyaz, S., Hussein, M., &
Inman, D. J. (2018). Wireless and real-time structural
damage detection: A novel decentralized method for
wireless sensor networks. Journal of Sound and
Vibration, 424, 158–172. https://doi.org/10.1016/
j.jsv.2018.03.008
Couture, Z. (2013). Structural Health Monitoring
(dissertation).
Crémona, C. (2016). Big Data and Structural Health
Monitoring. IABSE Congress, Stockholm 2016:
Challenges in Design and Construction of an
Innovative and Sustainable Built Environment.
https://doi.org/10.2749/stockholm.2016.1793
De La Torre, R. Dll., Pasobillo, G. A., Rebueno, M. F.,
Sunga, D. P., Esguerra, B. J., & Concepcion, R. (2020).
Vibration-based structural health monitoring system for
bridges using ADXL345 accelerometer with MATLAB
standalone application. 2020 IEEE 12th International
Conference on Humanoid, Nanotechnology,
Information Technology, Communication and Control,
Environment, and Management (HNICEM).
https://doi.org/10.1109/hnicem51456.2020.9400068
Doebling, S. W., Farrar, C. R., Prime, M. B., & Shevitz, D.
W. (1996). Damage Identification and Health
Monitoring of Structural and Mechanical Systems from
Changes in Their Vibration Characteristics: A
Literature Review. https://doi.org/10.2172/249299
Eftekhar Azam, S., Rageh, A., & Linzell, D. (2018).
Damage detection in structural systems utilizing
artificial neural networks and proper orthogonal
decomposition. Structural Control and Health
Monitoring, 26(2). https://doi.org/10.1002/stc.2288
Goyal, D., & Pabla, B. S. (2015). The vibration monitoring
methods and signal processing techniques for Structural
Health Monitoring: A Review. Archives of
Computational Methods in Engineering, 23(4), 585–
594. https://doi.org/10.1007/s11831-015-9145-0
Hernandez, E., Roohi, M., & Rosowsky, D. (2018).
Estimation of elementbyelement demandto
capacity ratios in instrumented SMRF buildings using
measured seismic response. Earthquake Engineering &
Structural Dynamics, 47(12), 2561–2578.
https://doi.org/10.1002/eqe.3099
Ibrahim, A., Eltawil, A., Na, Y., & El-Tawil, S. (2020). A
machine learning approach for structural health
monitoring using noisy data sets. IEEE Transactions on
Automation Science and Engineering, 17(2), 900–908.
https://doi.org/10.1109/tase.2019.2950958
Keller, J. M., Liu, D., & Fogel, D. B. (2016). Fundamentals
of Computational Intelligence: Neural Networks, Fuzzy
Systems, and evolutionary computation. Wiley.
Khemapech, I., Sansrimahachai, W., & Toahchoodee, M.
(2016). A real-time health monitoring and warning
system for bridge structures. 2016 IEEE Region 10
Conference (TENCON). https://doi.org/10.1109/ten
con.2016.7848598
Kiranyaz, S., Avci, O., Abdeljaber, O., Ince, T., Gabbouj,
M., & Inman, D. J. (2021). 1D convolutional neural
networks and applications: A survey. Mechanical
Systems and Signal Processing, 151, 107398.
https://doi.org/10.1016/j.ymssp.2020.107398
Li, H.-N., Ren, L., Jia, Z.-G., Yi, T.-H., & Li, D.-S. (2015).
State-of-the-art in structural health monitoring of large
and complex civil infrastructures. Journal of Civil
Structural Health Monitoring, 6(1), 3–16.
https://doi.org/10.1007/s13349-015-0108-9
Liu, J., McDaid, L. J., Harkin, J., Wade, J. J., Karim, S.,
Johnson, A. P., Millard, A. G., Halliday, D. M., Tyrrell,
A. M., & Timmis, J. (2017). Self-repairing learning rule
for spiking astrocyte-neuron networks. Neural
Information Processing, 384–392. https://doi.org/10.10
07/978-3-319-70136-3_41
Moaveni, B., He, X., Conte, J. P., & Restrepo, J. I. (2010).
Damage identification study of a seven-story full-scale
building slice tested on the UCSD-Nees Shake Table.
Structural Safety, 32(5), 347–356. https://doi.org/10.10
16/j.strusafe.2010.03.006
Moaveni, B., He, X., Conte, J. P., Restrepo, J. I., &
Panagiotou, M. (2011). System identification study of a
7-story full-scale building slice tested on the UCSD-
Nees Shake Table. Journal of Structural Engineering,
137(6), 705–717. https://doi.org/10.1061/(asce)st.19
43-541x.0000300
Notley, S., & Magdon-Ismail, M. (2018). Examining the
Use of Neural Networks for Feature Extraction: A
Comparative Analysis Using Deep Learning, Support
Vector Machines and K-Nearest Neighbor Classifier.
Nuhu, B. K., Aliyu, I., Adegboye, M. A., Ryu, J. K.,
Olaniyi, O. M., & Lim, C. G. (2020). Distributed
network-based Structural Health Monitoring Expert
System. Building Research & Information, 49(1), 144–
159. https://doi.org/10.1080/09613218.2020.1854083
Overbey, L. A. (2008). Time series analysis and feature
extraction techniques for Structural Health Monitoring
Applications (dissertation).
Pang, L., Liu, J., Harkin, J., Martin, G., McElholm, M.,
Javed, A., & McDaid, L. (2020). Case study-spiking
neural network hardware system for Structural Health
Monitoring. Sensors, 20(18), 5126. https://doi.org/
10.3390/s20185126
Paugam-Moisy, H., & Bohte, S. (2012). Computing with
spiking neuron networks. Handbook of Natural
Computing, 1–47.
Semperlotti, F. (2009). Structural damage detection via
nonlinear system identification and structural intensity
methods (dissertation).
Song, L., Li, S., Wang, J., Wang, Z., & Zhao, G. (2020).
Research progress on structural damage identification
in civil engineering. 2020 International Conference on
Intelligent Transportation, Big Data & Smart City
(ICITBS)
. https://doi.org/10.1109/icitbs49701.2020.00
076
Toivola, J., & Hollmén, J. (2009). Feature extraction and
selection from vibration measurements for structural
health monitoring. Advances in Intelligent Data
Analysis VIII, 213–224. https://doi.org/10.1007/978-3-
642-03915-7_19
Ying, Y., Garrett, J. H., Oppenheim, I. J., Soibelman, L.,
Harley, J. B., Shi, J., & Jin, Y. (2013). Toward data-
NCTA 2023 - 15th International Conference on Neural Computation Theory and Applications
522

driven structural health monitoring: Application of
machine learning and signal processing to damage
detection. Journal of Computing in Civil Engineering,
27(6), 667–680. https://doi.org/10.1061/(asce)cp.1943-
5487.0000258
Yu, L., Wang, N., & Meng, X. (2005). Real-time forest fire
detection with wireless sensor networks. Proceedings.
2005 International Conference on Wireless
Communications, Networking and Mobile Computing,
2005. https://doi.org/10.1109/wcnm.2005.1544272
Z. Yang, Z. Han, Y. Huang and T. T. Ye (2021). 55nm
CMOS Analog Circuit Implementation of LIF and
STDP Functions for Low-Power SNNs. IEEE/ACM
International Symposium on Low Power Electronics
and Design. pp. 1-6
Zanatta, L., Barchi, F., Burrello, A., Bartolini, A., Brunelli,
D., & Acquaviva, A. (2021). Damage detection in
structural health monitoring with spiking neural
networks. 2021 IEEE International Workshop on
Metrology for Industry 4.0 & IoT
(MetroInd4.0&IoT). https://doi:10.1109/metroind
4.0iot51437.2021.9488476
Zhang, M., Gu, Z., & Pan, G. (2018). A survey of
neuromorphic computing based on spiking neural
networks. Chinese Journal of Electronics, 27(4), 667–
674. https://doi.org/10.1049/cje.2018.05.006
Feature Extraction Methods for Neural Networks in the Classification of Structural Health Anomalies
523
