
There Are no Major Age Effects for UX Aspects of Voice User Interfaces
Using the Kano Categorization
Jana Deutschl
¨
ander
1 a
, Anna C. Weigand
1,2 b
, Andreas M. Klein
1,2 c
, Dominique Winter
3 d
and Maria Rauschenberger
1 e
1
Faculty of Technology, University of Applied Sciences Emden/Leer, Emden, Germany
2
Department of Computer Languages and Systems, University of Seville, Seville, Spain
3
University of Siegen, Siegen, Germany
Keywords:
Voice User Interfaces, User Experience, UX Aspects, Kano, Categorization, Voice Assistants, Mixed Methods.
Abstract:
Voice user interface (VUI) evaluation often focuses on user experience (UX) quality measurement of UX
aspects for VUIs. However, it is crucial to differ among these UX aspects concerning their relevance to
specific target groups, like different usage contexts, or user characteristics such as age. Therefore, we identified
potential age-specific characteristics and determine their nature, if any. We applied the Kano model using an
age-segmentation to categorize these 32 UX aspects based on VUI user data (N = 384). Our findings reveal
that UX aspects of VUIs are broadly consistent across all age groups, and VUI developers and researchers
should consider the important ones. Some age effects are visible and could impact the success of VUIs.
1 INTRODUCTION
When developing or enhancing voice user interfaces
(VUIs), the need of younger users should no longer
be the primary consideration as the middle-aged and
older adults using technological devices increase as
well (Czaja et al., 2006; Jenkins et al., 2016; Lee and
Coughlin, 2014). Hence, it is important to provide a
good user experience (UX) for users of all ages. Fo-
cusing on relevant UX aspects enables efficient prod-
uct development and evaluation. K
¨
olln et al. iden-
tified a list of potential UX aspects for VUIs (K
¨
olln
et al., 2022a), and then prioritized them using the
Kano method (K
¨
olln et al., 2023a). This prioritization
was conducted in a segment-unspecific manner. How-
ever, it is necessary to identify relevant differences be-
tween these UX aspects in terms of their importance
for specific target groups, e.g., different usage con-
texts or user characteristics such as age (Klein et al.,
2023a; Strassmann et al., 2020; Zhong et al., 2022).
a
https://orcid.org/0000-0003-3851-4384
b
https://orcid.org/0000-0003-2674-0640
c
https://orcid.org/0000-0003-3161-1202
d
https://orcid.org/0000-0003-2697-7437
e
https://orcid.org/0000-0001-5722-576X
To the best of our knowledge, the effects of age
on these UX aspects of VUIs have not yet been re-
searched in detail. Thus, we investigated whether
age-specific particularities can be identified and, if
so, which ones. We collected a data set (N = 384)
to apply an age-segmented Kano categorization and
evaluate it, with the goal of answering the following
research questions (RQ):
• RQ1: Are there any differences in categorizing
UX aspects based on user age?
• RQ2: Are there any UX aspects that are more im-
portant for a specific age group?
2 BACKGROUND & RELATED
WORK
Considering specific UX aspects for VUIs is an indis-
pensable evaluation method to effectively meet users’
needs. Therefore, we first describe the existing VUI
UX aspects and known age effects before we go into
detail about the Kano categorization of VUI UX as-
pects as well as the Kano model (KM) itself.
330
Deutschländer, J., Weigand, A., Klein, A., Winter, D. and Rauschenberger, M.
There Are no Major Age Effects for UX Aspects of Voice User Interfaces Using the Kano Categorization.
DOI: 10.5220/0012187600003584
In Proceedings of the 19th International Conference on Web Information Systems and Technologies (WEBIST 2023), pages 330-339
ISBN: 978-989-758-672-9; ISSN: 2184-3252
Copyright © 2023 by SCITEPRESS – Science and Technology Publications, Lda. Under CC license (CC BY-NC-ND 4.0)

2.1 UX Aspects & Age-Related Effects
UX aspects for VUIs have already been researched
and 32 of them have been identified as relevant (K
¨
olln
et al., 2022a; K
¨
olln et al., 2022b; K
¨
olln et al., 2023a;
K
¨
olln et al., 2023b). VUI developers can use these
UX aspects as a starting point to determine their de-
velopment focus or to improve the quality of existing
VUIs (Klein et al., 2023b), e.g., by developing VUI
measurement tools (Klein et al., 2020c; Klein et al.,
2020b). The categorization and prioritization under-
lying this assessment can be done using various meth-
ods, including the Kano method (K
¨
olln et al., 2023a).
Since the UX aspects of VUIs are relatively new,
there are no studies yet on how age influences them.
However, there have been indications that age influ-
ences how VUIs are used. Children, for instance,
interact playfully and ask for audio games, while
their parents request weather reports (Klein et al.,
2023a). Seniors evaluate virtual assistants more posi-
tively than do young adult students (Strassmann et al.,
2020). Younger, middle-aged, and older adults have
been shown to vary in their VUI requirements, which
impacts acceptance (Zhong et al., 2022).
2.2 The Kano Model (KM)
The KM (Kano et al., 1984) is a concept for classify-
ing and prioritizing customer requirements for a prod-
uct. UX aspects describe the UX quality of the user’s
interaction with the product. Therefore, we can cate-
gorize UX aspects according to the KM, which clas-
sifies product characteristics into three quality cate-
gories with varying impacts on customer satisfaction
(Witell et al., 2013). These categories are: Must-be
quality: Expected, causes dissatisfaction when ab-
sent. One-dimensional quality: Satisfies customers
when present and dissatisfies when not present. At-
tractive quality: Provides satisfaction when present,
but absence is acceptable.
In addition, there are two more quality categories
(Kano et al., 1984): indifferent and reverse. For the
indifferent quality, satisfaction is not affected by the
presence of a characteristic. For the reverse qual-
ity, the presence of a characteristic is perceived neg-
atively. The categorization of the individual qual-
ity characteristics into the KM is done by answering
two five-point rating scale questions: (1) the func-
tional question captures a customer’s reaction when
the given product characteristic is present, and (2) the
dysfunctional question captures a customer’s response
when the characteristic is not present.
Using Discrete Analysis for KM. First, based on
the combination of the responses to the functional
and dysfunctional questions, the corresponding cat-
egories are determined for each study participant us-
ing the Kano evaluation. Illogical answers are placed
in a special category questionable and must be dis-
carded. Then, all categorizations are summed up,
and the most frequently mentioned category is used
as the overall Kano category. A relative majority, no
matter how small, is sufficient (Kano et al., 1984).
The overall percentage of respondents for whom the
product feature is highly important is reflected by
the Total Strength, which is calculated as follows
using percentages: Total Strength = Attractive +
One-dimensional + Must-be.
Applying discrete analysis for Kano categoriza-
tion results in information loss due to strict assign-
ment based on relative majorities, despite the data dis-
playing a spectrum-like nature. Another way to cate-
gorize product features according to the KM is by us-
ing continuous analysis (DuMouchel, 1993; Timko,
1993).
Using Continuous Analysis for KM. The continu-
ous analysis method overcomes the most significant
limitation of the discrete analysis method by using
satisfaction and dissatisfaction coefficients to include
all collected information in the categorization (Berger
et al., 1993). The discrete analysis approach does not
assign specific values to features, whereas the con-
tinuous analysis approach uses a scale to evaluate
the Kano survey. To do so, each feature is assigned
a numerical value according to the answers to the
functional and dysfunctional questions (DuMouchel,
1993). The mean value is calculated for the overall
category. This graphical representation (positive val-
ues from 0 to 4) of individual features and their as-
signment to categories can illustrate trends, even if
they are subtle (Berger et al., 1993).
3 USER STUDY
This section describes its participants, our approach,
and our final data set. We choose the Kano model, a
proven method widely used in both practice and re-
search.
3.1 Age Segmentation
Since we investigate age-related effects of VUI UX
aspects, we use an appropriate age segmentation
method derived from the literature. Specifically, we
define three age groups with the following ranges:
• Younger Adults: 18 to 34 years
• Middle-aged Adults: 35 to 44 years
• Older Adults: 45 to 85 years
There Are no Major Age Effects for UX Aspects of Voice User Interfaces Using the Kano Categorization
331

This is based on the idea that ages are commonly
grouped into a small number of crude age ranges
that either reflect the major stages of human devel-
opment and aging or form meaningful, contextual age
groups (Erikson, 1994; Sigelman and Rider, 2008).
Our chosen segmentation has already been estab-
lished in market analyses of VUI use (Lis, 2022; Tas¸
et al., 2019).
3.2 Procedure
We build upon an exisiting quantitative online user
study (N = 219) (K
¨
olln et al., 2023a). Our method-
ology, including categorization choices, follows their
prior work.
Data Collection. The previous online user study was
conducted between January 31 and February 3, 2023
(K
¨
olln et al., 2023a). We extend that study with our
data, which was collected from April 12-13, 2023.
Given the short time span between the two studies,
no significant new VUI developments emerged dur-
ing this period.
Questionnaire. Our study participants are given the
same online questionnaire as already used in the prior
study (K
¨
olln et al., 2023a) in which they are asked
for their demographic data, general questions about
themselves, their VUI use, followed by the Kano
questions.
Recruitment. In the previous study, participants
were recruited from the USA (n = 106) and UK
(n = 110). To minimize cultural effects in our study,
we recruited additional participants from two other
English-speaking countries, Canada (n = 101) and
Australia (n = 102). All participants were recruited
via the crowd-working platform Prolific (Prolific Aca-
demic Ltd., 2023), which provides a subject pool for
research (Palan and Schitter, 2018) with high-quality
data (Peer et al., 2021) appropriate for our user study.
Subject Exclusion. For data cleaning of the total 419
records, we used the exclusion criteria already applied
in the previous study (K
¨
olln et al., 2023a). These are,
more than three questionable features (n = 13), more
than 28 identical categorizations (n = 19), or less than
two seconds per item (n = 14). age under 18 or over
85 (n = 2), with corrupted data in this field (n = 3),
when asked about the VUI used, the respondent indi-
cated “none” (n = 1). Participants were excluded if
one or more of these criteria were met.
3.3 Final Data Set
Our final data set includes N = 384 participants, sep-
arated into participants from the USA (n = 95), UK
(n = 97), Canada (n = 89), Australia (n = 94), and
other countries (n = 9). It has the following age dis-
tribution: Younger Adults (n = 187), Middle-aged
Adults (n = 112), Older Adults (n = 85).
The gender distribution is as follows: male (n =
168), female (n = 207), diverse (n = 6), and prefer not
to say (n = 3). All our study participants use at least
one VUI device, with the following device distribu-
tion: Alexa (n = 182), Siri (n = 203), Google Assis-
tant (n = 175), and others, such as Bixby, car monitor,
or Dragon Naturally Speaking (n = 62). The reasons
for VUI usage also vary: participants use them for
fun (n = 240), for comfort (n = 222), for professional
reasons as a tool at work (n = 59), for professional
reasons in scientific research (n = 10), due to motor
impairment (n = 7), and other (n = 77).
3.4 Age-Related Kano Categorization
UX aspects can be assigned to the expectations of
users according to the aforementioned categoriza-
tion (Kano et al., 1984) for each age group.
To categorize the UX aspects relevant to VUI
users of each age group into specific Kano categories,
we first apply the discrete analysis (Kano et al.,
1984). We then employ Fong Test to determine the
Self-Stated Importance and whether the categoriza-
tion is significant (Fong, 1996). Furthermore, we
consider both the Total Strength and the distributions
of percentages for each UX aspect within each age
group (Lee and Newcomb, 1997).
The discrete analysis method does not include all
information; hence, we also use the continuous anal-
ysis method to consider all our data sets’ information.
We first evaluate the graphs of our continuous analy-
sis results to discover any differences in the Kano cat-
egorizations of the age groups. Therefore, horizon-
tal (dysfunctional dimension) or vertical (functional
dimension) rating differences between age groups in
combination with shifts from one Kano category to
another are relevant for our study. These shifts may
be marginal or substantial across age groups.
4 RESULTS
In the following, we present the results of our quanti-
tative user study (N = 384).
4.1 Discrete Analysis
The percentage distribution of ratings by study partic-
ipants for the discrete analysis is shown in Table 1.
Moreover, we examine whether the categorization
is significant, which is depicted in Table 2.
WEBIST 2023 - 19th International Conference on Web Information Systems and Technologies
332
Table 1: Percentage distributions of all 32 UX aspects and Kano categories, results of the Fong Test, and Total Strength for all
study participants, as well as younger, middle-aged, and older.
All (N = 384) Younger (n = 187) Middle-Aged (n = 112) Older (n = 85)
UX Aspect
Must-be
One-Dimensional
Attractive
Indifferent
Reverse
Questionable
Test of Fong
Total Strength
Must-be
One-Dimensional
Attractive
Indifferent
Reverse
Questionable
Test of Fong
Total Strength
Must-be
One-Dimensional
Attractive
Indifferent
Reverse
Questionable
Test of Fong
Total Strength
Must-be
One-Dimensional
Attractive
Indifferent
Reverse
Questionable
Test of Fong
Total Strength
Ad-Free 51 32 9 6 0 1 * 92 50 33 10 6 0 1 * 90 55 31 6 7 0 0 * 92 48 31 13 5 0 4 * 92
Aesthetic 18 12 18 39 7 6 * 48 17 12 20 36 8 7 * 49 21 11 16 43 6 3 * 48 18 15 16 38 5 8 * 49
Capability to Learn 22 30 21 20 5 1 * 73 20 27 23 22 6 2 * 70 44 41 6 8 0 1 * 91 31 35 13 16 4 1 * 79
Comprehension 20 48 20 10 1 0 * 88 20 41 26 12 1 0 * 87 21 54 15 9 1 1 * 90 21 58 11 9 1 0 * 90
Context Sensitivity 18 28 17 23 11 3 * 63 20 29 13 25 9 4 62 13 25 21 23 14 3 59 21 32 20 16 11 0 73
Convenience 22 40 20 17 1 0 * 82 21 40 24 14 1 1 * 85 26 43 13 18 0 0 * 82 19 36 20 21 4 0 * 75
Customizability 8 18 39 32 2 1 * 65 7 16 44 29 3 1 * 67 7 15 38 38 1 1 50 12 26 27 32 2 1 65
Data Security 66 30 1 1 1 1 * 97 63 32 3 2 1 1 * 98 75 21 0 1 2 1 * 96 60 36 0 1 0 2 * 96
Effectivity 21 36 22 20 1 0 * 79 19 33 25 22 1 1 * 77 23 42 19 16 0 0 * 84 24 35 19 21 1 0 * 78
Efficiency 21 34 28 15 1 2 * 83 19 31 30 16 1 2 80 25 32 29 13 0 1 86 20 41 19 18 0 2 * 80
Error-Free 36 45 13 5 0 2 * 94 33 42 16 6 0 3 * 91 40 43 11 4 0 2 94 35 52 8 4 0 1 * 95
Flexibility 18 34 25 22 2 0 * 77 18 33 27 22 1 0 78 17 33 26 21 4 0 76 22 36 18 22 1 0 * 76
Fun 15 34 27 21 2 1 * 76 14 31 29 22 2 1 74 16 36 25 20 4 0 * 77 15 38 26 19 1 1 79
Help with Errors 32 40 18 10 0 1 * 90 32 39 19 9 0 1 90 33 40 17 9 0 1 90 28 44 15 13 0 0 * 87
Humanity 7 8 26 45 13 1 * 41 6 7 22 50 13 1 * 35 6 8 30 41 13 2 * 44 7 12 27 40 14 0 * 46
Independence 27 31 24 17 1 0 82 27 31 25 16 1 0 83 26 31 24 19 0 0 81 26 32 21 16 4 1 79
Innovation 13 29 31 27 1 0 73 13 32 34 20 1 0 79 8 26 32 34 0 0 66 16 26 22 34 1 0 64
Intuitiveness 43 38 9 10 0 0 90 38 36 12 13 1 0 86 44 41 6 8 0 1 91 52 36 8 4 0 0 * 86
Link 3rd-Party Products 18 27 20 24 7 3 65 19 26 19 26 7 2 64 16 26 21 24 9 4 63 19 31 20 21 5 5 70
Longevity 46 44 5 5 0 0 95 43 44 7 6 0 0 94 50 43 3 4 1 0 96 47 47 1 5 0 0 95
Personal Fulfillment 28 38 16 16 1 1 * 82 28 36 18 17 1 0 * 82 32 38 15 13 0 2 85 25 44 13 18 1 0 82
Politeness 44 40 8 7 1 0 92 40 42 10 7 1 0 92 45 39 6 8 1 1 90 51 38 5 6 1 0 * 94
Practicality 14 41 25 19 1 0 * 80 13 41 29 16 1 0 * 83 15 39 23 21 1 0 * 77 13 45 19 21 2 0 * 77
Privacy 50 32 2 2 3 11 * 84 52 33 2 1 3 10 * 87 53 29 2 1 3 13 * 84 42 35 1 5 2 14 78
Range of Functions 14 26 26 30 4 1 66 14 24 30 29 3 0 68 15 26 24 30 3 2 65 9 29 20 33 7 1 58
Reliability 48 43 4 4 0 1 95 49 41 6 4 0 0 96 52 42 1 2 0 4 95 42 49 2 6 0 0 93
Responsiveness 42 36 11 10 0 1 89 40 36 11 12 0 1 87 45 34 13 7 1 1 92 42 39 8 11 0 0 89
Safety 39 36 7 14 3 2 82 36 33 7 19 3 2 76 43 35 8 10 2 3 86 39 42 5 9 5 0 86
Simplicity 35 53 6 6 0 0 * 94 28 53 9 9 1 0 * 90 42 51 4 4 0 0 97 40 54 1 4 0 1 * 95
Support of the User 19 44 21 14 1 1 * 84 18 43 22 16 1 1 * 83 21 45 21 13 1 0 * 87 21 46 19 12 1 1 * 86
Time-Saving 20 42 18 18 2 1 * 80 19 44 17 17 2 1 * 80 19 42 22 15 2 0 * 83 26 36 13 22 2 0 75
Voice 38 46 9 7 0 0 * 93 34 48 11 7 0 0 * 93 44 41 6 9 0 0 91 40 48 7 5 0 0 95
(bold = rated by the relative majority, * = significant)
There Are no Major Age Effects for UX Aspects of Voice User Interfaces Using the Kano Categorization
333
Table 2: Significant results of the discrete analysis.
UX Aspect All (N = 384) Younger Middle-Aged Older
Ad-Free M M M M
Data Security M M M M
Privacy M M M -
Aesthetic I I I I
Humanity I I I I
Customizability A A - -
Comprehension O O O O
Convenience O O O O
Effectivity O O O O
Practicality O O O O
Support of the User O O O O
Error-Free O O - O
Personal Fulfillment O O - O
Simplicity O O - O
Time-Saving O O O -
Fun O - O -
Efficiency O - - O
Flexibility O - - O
Help with Errors O - - O
Voice O O - -
Capability to Learn O - - -
Context Sensitivity O - - -
(O = One-Dimensional, M = Must-Be, A = Attractive, I = Indifferent)
This table reveals that the significant category as-
signed to each UX aspect is consistent across age
groups. Deviations between the age groups are lim-
ited to whether and how often a category can be sig-
nificantly assigned at all. None of these categories are
assigned when the percentage distribution (see Table
1) is not significant. In such cases, the highest value
is assigned to the same Kano category, but the differ-
ence from the value of the second highest category
is too small to meet the threshold for significance ac-
cording to the Fong Test (Fong, 1996).
Significant Categorizations. Based on the ratings of
All study participants, 16 out of 32 UX aspects are
significantly categorized as one-dimensional (see Ta-
ble 2). For the first five UX aspects this is consistently
true for both the overall group of study participants
and each individual age group.
Three UX aspects are significantly categorized
as must-be by All study participants (see Table 2).
Ad-Free and Data Security are also significantly cate-
gorized as must-be by each age group. Privacy, how-
ever, is significantly categorized by all groups except
the older study participants. Customizability is the
only UX aspect significantly categorized as attractive.
Two UX aspects, are significantly categorized as
indifferent by All study participants as well as every
age group.While the assignment of the Kano category
indifferent is homogeneously significant for the three
age groups, that is not always the case for the cate-
gories must-be, one-dimensional and attractive.
The UX aspects Capability to Learn and Con-
text Sensitivity were significantly categorized as one-
dimensional by All study participants, but no clear
age-specific categorization is identifiable.
Categorizations without Significance. Ten UX
aspects are not significantly categorized into any
Table 3: Non-significant results that meet the threshold of
importance for at least one age group stated in percent.
UX Aspect All (N = 384) Younger Middle-Aged Older
Longevity 95 94 96 95
Reliability 95 96 95 93
Politeness 92 92 90 94
Intuitiveness 90 86 91 86
Responsiveness 89 87 92 89
(bold = important)
Kano category based on the ratings of All study
participants. Two of these have a significant catego-
rization for at least one age group, but eight, a distinct
majority, have no significant categorization for any
age segment. However, this does not necessarily
imply that these UX aspects are less important.
To account for this fact, another weighting mea-
sure is added to the discrete analysis: Total Strength.
This measure can be used to support trade-off de-
cisions in product development (Lee and Newcomb,
1997). We see it as a valid means of prioritizing UX
aspects that are not significantly categorizable.
Lee and Newcomb (1997) propose a threshold
of 60%. The majority of UX aspects in our study
have a Total Strength significantly higher than 60%.
Therefore we derive the importance of a UX aspect
from the consensus of the vast majority of users,
which we assume from a threshold of 90%. We refer
to this hereafter as the threshold of importance.
Five additional UX aspects meet the threshold of
importance for at least one age group, see Table 3.
4.2 Continuous Analysis
In the following, we present the results of the continu-
ous analysis (DuMouchel, 1993). We only present the
shifts over time of the UX aspects from which we ex-
pect to gain further insights via the continuous analy-
sis (see Table 4 and Figure 1). It depicts, e.g., horizon-
tal differences (i.e., for the dysfunctional dimension)
between the three age groups.
For the UX aspect Capability to Learn Table 4
shows a difference of 0.509 within the dysfunctional
dimension from younger (Dys f unctional[DF] =
2.503) over middle-aged (DF = 2.714) to older
(DF = 3.012). Overall, younger and older study
participants tend toward the must-be category and not
into the one-dimensional category. Figure 1 shows a
difference between the three age groups in the func-
tional dimension of the UX aspect Innovation. There
is a descending difference of 0.800 from younger
(Functional[F] = 2.882) to middle-aged (F = 2.384)
to older study participants (F = 2.082) (see Table
4). Therefore, the younger study participants clearly
define Innovation as one-dimensional, while the
older participants tend more toward must-be.
WEBIST 2023 - 19th International Conference on Web Information Systems and Technologies
334
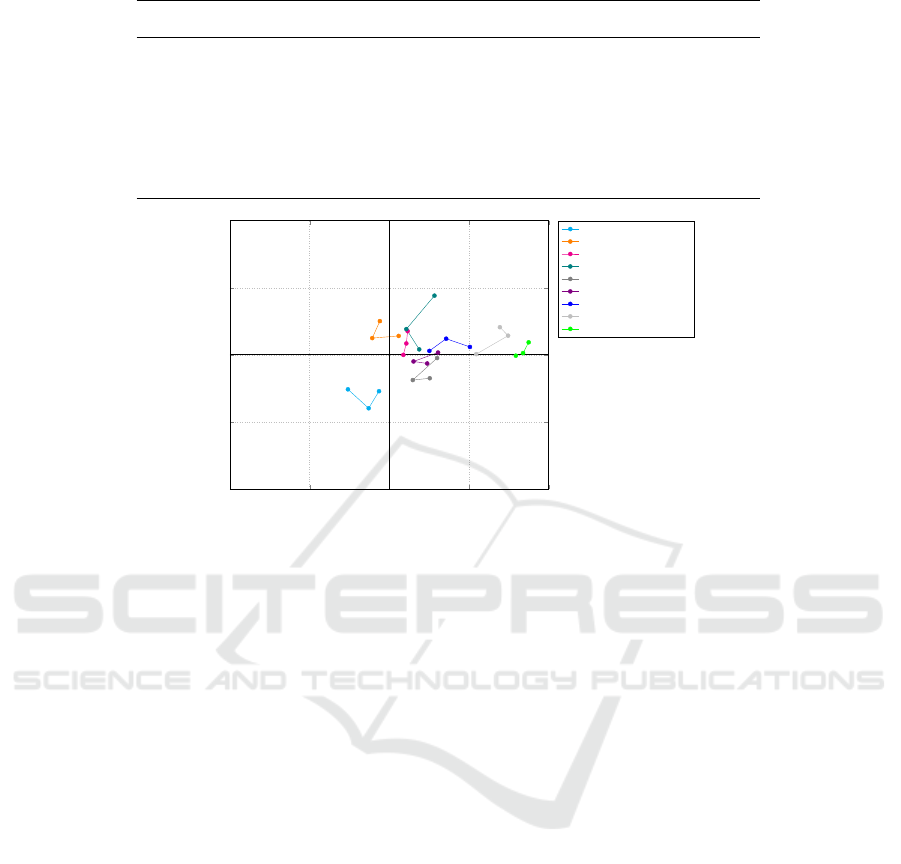
Table 4: Relevant results of the continuous analysis (N = 384).
UX Aspect Functional Dysfunctional
Younger Middle-Aged Older Younger Middle-Aged Older
Aesthetic 1.487 1.205 1.459 1.481 1.741 1.871
Capability to Learn 2.059 2.241 2.118 2.503 2.714 3.012
Context Sensitivity 1.652 1.625 1.953 2.508 2.295 2.600
Customizability 2.503 2.250 2.282 1.882 1.786 2.118
Innovation 2.882 2.384 2.082 2.567 2.214 2.376
Link 3rd-Party Products 1.872 1.902 2.035 2.476 2.304 2.612
Privacy 2.187 2.027 1.988 3.749 3.679 3.588
Range of Functions 2.353 2.170 2.000 2.230 2.214 2.176
Safety 2.011 2.286 2.412 3.091 3.491 3.388
0 1 2 3 4
0
1
2
3
4
A
B
C
D
E
F
G
H
I
Attractive
Indifferent
One-dimensional
Must-be
Dysfunctional
Functional
A: Aesthetic
B: Customizability
C: Range of Functions
D: Innovation
E: Context Sensitivity
F: Link 3rd-party products
G: Capability to learn
H: Safety
I: Privacy
Figure 1: Relevant results of the continuous analysis (N = 384).
Regarding Range of Functions, a decreasing dif-
ference of 0.353 from younger (F = 2.353) to middle-
aged (F = 2.170) to older (F = 2.000) is represented
in Figure 1. Categorizing this UX aspect into the
Kano model changes by increasing age from one-
dimensional toward must-be.
For Privacy, the difference is 0.199 in the func-
tional dimension, from younger (DF = 2.187) to
middle-aged (DF = 2.027) to older (DF = 1.988).
Additionally, there is a difference of 0.160 over
time in the dysfunctional dimension, from younger
(DF = 3.749) to middle-aged (DF = 3.679) to older
(DF = 3.588). This means there is an observable
shift from the must-be to the one-dimensional quad-
rant. Older participants categorize more toward must-
be, while the younger group tend more toward one-
dimensional. Middle-aged (F = 2.286, DF = 3.491)
and older (F = 2.412, DF = 3.388) participants
clearly categorize Safety as one-dimensional. How-
ever, the younger group (F = 2.011, DF = 3.091)
tend more toward the must-be quadrant. Customiz-
ability is categorized as attractive by younger (F =
2.503, DF = 1.882) and middle-aged participants
(F = 2.250, DF = 1.786), whereas the older group
(F = 2.282, DF = 2.118) categorized it as one-
dimensional.
Regarding Link 3rd-Party Products the older
participants (F = 2.035, DF = 2.612) decided
marginally for the Kano category one-dimensional,
while younger (F = 1.872, DF = 2.476) and middle-
aged (F = 1.902, DF = 2.304) study participants
categorized it more as must-be. Figure 1 also depicts,
for the UX aspect Context Sensitivity, a tendency of
older study participants (F = 1.953, DF = 2.600)
toward the Kano category one-dimensional, whereas
younger (F = 1.652, DF = 2.508) and middle-aged
study participants (F = 1.625, DF = 2.295) catego-
rize it as must-be. The UX aspect Aesthetic is clearly
defined as indifferent. Nevertheless, Figure 1 shows
a tendency from younger (F = 1.487, DF = 1.481)
to middle-aged (F = 1.205, DF = 1.741) to older
(F = 1.459, DF = 1.871) toward the must-be Kano
quadrant.
5 DISCUSSION
We aim to understand the differences or similarities
between our selected age groups (younger, middle-
aged, and older adults) in terms of categorizing UX
aspects according to the KM (RQ1). Furthermore, we
discover whether there are UX aspects that are more
important for specific age groups (RQ2).
Age-segmented categorization is necessary to
better understand the target group and helps VUI
developers to determine how much they need to
adjust UX aspects for different age groups (Song
et al., 2022; Zhong et al., 2022). There are notable
There Are no Major Age Effects for UX Aspects of Voice User Interfaces Using the Kano Categorization
335

contrasts in use, evaluation, and acceptance across
ages (Klein et al., 2023a; Strassmann et al., 2020;
Zhong et al., 2022).
However, we did not find any major age effects
for UX aspects of VUIs. In other words, VUI UX as-
pects are consistent over age segments and should be
addressed by VUI developers and researchers. Still,
some age effects are visible and could affect the suc-
cess of a VUI. We elaborate on our findings below.
5.1 Significant Categories
Must-be Category. Two UX aspects, Ad-Free, and
Data Security, are significantly categorized as must-
be by the study participants of all three age groups.
Must-be UX aspects, as per Kano’s categorization
(Kano et al., 1984), are essential considerations for
VUI developers since neglecting them leads to user
dissatisfaction.
Data Security has by far the highest Total Strength
across all age groups, ranging between 96% and 98%.
This UX aspect is essential for VUI users of all ages
due to the significant categorization as must-be and
the very high Total Strength values. These findings
are consistent with existing studies that revealed VUI
use concerns regarding data security and privacy
(Tas¸ et al., 2019; Rauschenberger, 2021; Ammari
et al., 2019), and identified specific VUI user groups,
such as tech-savvy users (BVDW, 2017; Klein et al.,
2020a). While data security is a priority for all users
regardless of their age, individuals with accessibility
needs tend to accept a loss of data security when it
means more convenience (Vimalkumar et al., 2021).
In the discrete analysis, Privacy is significantly
categorized as must-be by all study participants ex-
cept the Older adults. Usually, older VUI users tend
to weigh privacy concerns against preserving their au-
tonomy in daily life (Townsend et al., 2011). Notice-
able, however, are the comparatively high values of
13% and 14% for the Kano categorization question-
able for the middle-aged and older age groups. The
predominant majority of the UX aspects were catego-
rized as questionable in only the 0 - 3% range, occa-
sionally higher, but always in the single-digit range. It
cannot be ruled out that the description of this aspect
in the survey was not formulated clearly enough for
the two age groups or that a subgroup is not aware of
the exact expression.
In the Continuous Analysis diagram (see Figure 1)
the UX aspect Privacy shows a shift from the must-
be to the one-dimensional quadrant. This shift indi-
cates that older participants categorize Privacy more
toward must-be, while the younger adults tend more
toward the one-dimensional category. This UX aspect
tends to be assumed by older users and must be taken
into account, but a particularly good implementation
does not increase their satisfaction. The younger age
group, however, explicitly demands the fulfillment of
this aspect, so the degree of consideration of the UX
aspect can trigger both satisfaction and dissatisfac-
tion. This lends more credence to the previously ex-
pressed assumption that study participants seek a bal-
ance between privacy and autonomy (Townsend et al.,
2011).
One-Dimensional Category. UX aspects signifi-
cantly categorized as one-dimensional should always
be considered by the VUI developer. This category
induces user satisfaction when fulfilled and dissatis-
faction when unfulfilled (Kano et al., 1984).
We identify five UX aspects significantly catego-
rized as one-dimensional across all age groups. No
matter the age of the VUI user group, these UX as-
pects should always be considered.
Efficiency, Flexibility, and Help with Errors are
significantly one-dimensional only for the older age
group. Younger and more tech-savvy (BVDW, 2017)
and middle-aged (Tas¸ et al., 2019) VUI users show a
high frequency of use. This could be why Help with
Errors induces slightly more user satisfaction when
fulfilled for older users. It may also be partly due to
the lack of technology education and experience in
their youth, which could make proper error handling
or coaching more essential (Lee and Coughlin,
2014). The Total Strength values among the younger
and middle-aged participants meet our threshold of
importance and are slightly higher than that of older
ones. Thus, Help with Errors is an essential UX
aspect for these age groups even without significant
categorization.
Error-Free and Simplicity are significantly catego-
rized as one-dimensional by the younger and older
age groups. Older adults tend to dislike technology
that requires too much effort to learn how to use it
(Mitzner et al., 2010). A user study found that per-
ceived ease of use significantly impacted the adop-
tion and attitudes of older individuals with limited
technology experience toward VUIs (Pradhan et al.,
2020). Younger adults often use VUIs for entertain-
ment and communication (Zhong et al., 2022). Media
selection and voice transmission are typical use cases,
and privacy issues and speech intelligibility are the
main requirements (Klein et al., 2021). Speech intel-
ligibility is necessary for correct command execution,
which fits our results for Error-Free and Simplicity.
Attractive Category. Significantly attractive UX as-
pects excite the user instead of just satisfying their ba-
sic needs (K
¨
olln et al., 2023a). If these aspects are not
present, VUI users might not miss them. However,
WEBIST 2023 - 19th International Conference on Web Information Systems and Technologies
336

they can increase satisfaction when included (Lee and
Newcomb, 1997; Chen and Chuang, 2008). We iden-
tify only one UX aspect Customizability that is signif-
icantly categorized as attractive for the younger age
group. While it might not be essential to set the per-
sona of a VUI according to the user’s preferences, it
may increase satisfaction when included. Such a fea-
ture can be considered advanced and rather interest-
ing for users with a higher frequency of use. Younger
users tend to be more tech-savvy (BVDW, 2017) and
show a higher frequency of use than older ones, which
could be a reason for this trend.
Indifferent Category. In the KM, indifferent require-
ments have no impact on customer satisfaction, re-
gardless of the degree of fulfillment.
According to the results of the discrete analysis,
no special consideration needs to be given to the UX
aspects Humanity and Aesthetic. This is also sug-
gested by their Total Strength values, which are both
significantly below 50% for each age group. Con-
sidering the 32 UX aspects in the study, the Total
Strength value of Humanity for younger adults is the
lowest value of all at 35%. In the continuous analysis,
these UX aspects are also categorized as indifferent.
Nonetheless, the importance of Aesthetic in-
creases slightly with age and tends in the direction
of the must-be quadrant. Various studies have al-
ready examined the influence of product aesthetics on
perceived usability and UX, exploring notions such
as the “what is beautiful is good” effect (Chaouali
et al., 2019; Haimes, 2021; Tractinsky et al., 2000).
However, the vast majority of these studies exam-
ine visual aesthetics rather than aesthetics perceived
through one of the other sensory channels, such as
audition (Sauer and Sonderegger, 2022). Since both
visual and non-visual aesthetics could play a role in
the UX of VUIs, the extent to which the unambigu-
ous indifferent categorization will persist in the future
remains to be seen.
5.2 Non-Significant Categories
Besides the UX aspects that are significantly catego-
rized into a Kano category, we identified ten UX as-
pects that are not rated clearly enough to be assigned
to a Kano category for any age group. Five of them
have a Total Strength value above or equal the thresh-
old of importance of 90%. The vast majority of par-
ticipants consider them to be very important; hence,
they should be considered when developing VUIs.
For example, the Total Strength values of
Longevity and Reliability range between 93% and
96%, which meets the threshold of importance. Both
UX aspects are almost evenly divided between must-
be and one-dimensional, ranging between 41% and
52% for each of the two Kano categories within the
age groups. Therefore, VUI developers should con-
sider these characteristics for all age groups, even
though they are not significantly categorized.
Link 3rd-Party Products, Range of Functions, and
Innovation have considerably lower Total Strength
values. The Total Strength values of Safety and In-
dependence are slightly higher, but they are still be-
low the threshold of importance. According to our
findings, these five UX aspects do not need special
consideration for any age group.
5.3 Limitations
Our study’s limitations include the non-representative
standard sample distribution due to recruitment
through the Prolific crowdsourcing platform with-
out census data (Prolific Academic Ltd., 2023). In
the prior study, participants were from the USA and
UK. To minimize cultural influences, we included
participants from Canada and Australia and main-
tained consistent study conditions with the previous
research (K
¨
olln et al., 2023a) to mitigate bias.
Although Prolific provides high-quality, reliable
data and participants from diverse populations (e.g.,
in terms of geographic location and ethnicity), the
generalizability of the results is limited because all of
these conditions favor a WEIRD (western, educated,
industrialized, rich, and democratic) sampling bias.
6 CONCLUSION & FUTURE
WORK
We explored the differences between VUI users of
various ages (N = 384) with the KM using both dis-
crete analysis and continuous analysis. The age seg-
mentation showed that VUI users of different ages
are more alike than different. Hence, although VUI
developers should take into account context-specific
user requirements, there are no major age effects in
our data set. Future work will examine data from non-
WEIRD countries that are distinctly different from the
chosen ones. In summary, using Kano to gather more
information about VUI users of different ages has
been valuable and could be further applied on other
characteristics as well.
REFERENCES
Ammari, T., Kaye, J., Tsai, J. Y., and Bentley, F. (2019).
Music, search, and iot: How people (really) use voice
assistants. ACM Trans. Comput.-Hum. Interact., 26.
There Are no Major Age Effects for UX Aspects of Voice User Interfaces Using the Kano Categorization
337

Berger, C., Blauth, R., Boger, D., Bolster, C., Burchill, G.,
DuMouchel, W., Pouliot, F., Richter, R., Rubinoff, A.,
Shen, D., Timko, M., and Walden, D. (1993). The de-
sire for continuous and graphical analysis. In Berger,
C., Blauth, R., Boger, D., Bolster, C., Burchill, G.,
DuMouchel, W., Pouliot, F., Richter, R., Rubinoff, A.,
Shen, D., Timko, M., and Walden, D., editors, Kano’s
methods for understanding customer-defined quality,
volume 2.4, pages 17–20. Center for Quality Manage-
ment Journal.
BVDW (2017). Digital Trends Umfrage zu digitalen
Sprachassistenten (Digital Trends survey on digital
voice assistants).
Chaouali, W., Yahia, I. B., Lunardo, R., and Triki, A.
(2019). Reconsidering the “what is beautiful is good”
effect. International Journal of Bank Marketing.
Chen, C.-C. and Chuang, M.-C. (2008). Integrating the
kano model into a robust design approach to enhance
customer satisfaction with product design. Interna-
tional Journal of Production Economics, 114(2):667–
681. Special Section on Logistics Management in
Fashion Retail Supply Chains.
Czaja, S. J., Charness, N., Fisk, A. D., Hertzog, C., Nair,
S. N., Rogers, W. A., and Sharit, J. (2006). Factors
predicting the use of technology: findings from the
center for research and education on aging and tech-
nology enhancement (CREATE). Psychology and ag-
ing, 21(2):333–352.
DuMouchel, B. (1993). Thoughts on graphical and con-
tinuous analysis for kano’s methods. In Berger, C.,
Blauth, R., Boger, D., Bolster, C., Burchill, G., Du-
Mouchel, W., Pouliot, F., Richter, R., Rubinoff, A.,
Shen, D., Timko, M., and Walden, D., editors, Kano’s
methods for understanding customer-defined quality,
volume 2.4, pages 20–23. Center for Quality Manage-
ment Journal.
Erikson, E. H. (1994). Identity: Youth and Crisis. Norton
& Company.
Fong, D. (1996). Using the self-stated importance question-
naire to interpret kano questionnaire results. Center
for Quality Management Journal, 5:21–23.
Haimes, P. (2021). Beyond beauty: Towards a deeper under-
standing of aesthetics in hci. In Extended Abstracts of
the 2021 CHI Conference on Human Factors in Com-
puting Systems, CHI EA ’21, New York, NY, USA.
Association for Computing Machinery.
Jenkins, A., Eslambolchilar, P., Lindsay, S., Hare, M.,
Thornton, I., and Tales, A. (2016). Attitudes to-
wards attention and aging:: What differences between
younger and older adults tell us about mobile technol-
ogy design. International Journal of Mobile Human
Computer Interaction, 8:47–68.
Kano, N., Seraku, N., Takahashi, F., and Tsuji, S.-i. (1984).
————— (attractive quality and must-be quality).
Journal of the Japanese Society for Quality Control,
31(4):147–156.
Klein, A. M., Deutschl
¨
ander, J., K
¨
olln, K., Rauschenberger,
M., and Escalona, M. J. (2023a). Exploring the Con-
text of Use for Voice User Interfaces: Toward Context-
dependent UX Quality Testing. Journal of Software:
Evolution and Process. [Accepted].
Klein, A. M., Hinderks, A., Rauschenberger, M., and
Thomaschewski, J. (2020a). Exploring voice assistant
risks and potential with technology-based users. In
Proceedings of the 16th International Conference on
Web Information Systems and Technologies - Volume
1: WEBIST,, pages 147–154. SciTePress.
Klein, A. M., Hinderks, A., Schrepp, M., and
Thomaschewski, J. (2020b). Construction of
ueq+ scales for voice quality. In Proceedings of the
Conference on Mensch Und Computer, pages 1–5.
Association for Computing Machinery.
Klein, A. M., Hinderks, A., Schrepp, M., and
Thomaschewski, J. (2020c). Measuring user ex-
perience quality of voice assistants. In 2020 15th
Iberian Conference on Information Systems and
Technologies (CISTI), pages 1–4. IEEEE.
Klein, A. M., K
¨
olln, K., Deutschl
¨
ander, J., and Rauschen-
berger, M. (2023b). Design and Evaluation of Voice
User Interfaces: What should one consider? In
Design, Operation and Evaluation of Mobile Com-
munications: 4th International Conference, MOBILE
2023, Held as Part of the 25th HCI International Con-
ference, HCII 2023, Copenhagen, Denmark, July 23-
28, 2023, Proceedings, pages 167–190.
Klein, A. M., Rauschenberger, M., Thomaschweski, J., and
Escalona, M. J. (2021). Comparing voice assistant
risks and potential with technology-based users: A
study from germany and spain. Journal of Web En-
gineering, 20 − 7.
K
¨
olln, K., Deutschl
¨
ander, J., Klein, A., Rauschenberger,
M., and Winter, D. (2022a). Identifying user expe-
rience aspects for voice user interfaces with inten-
sive users. In Proceedings of the 18th International
Conference on Web Information Systems and Tech-
nologies, pages 385–393. SCITEPRESS - Science and
Technology Publications.
K
¨
olln, K., Deutschl
¨
ander, J., Klein, A. M., Rauschenberger,
M., and Winter, D. (2022b). Protocol for identifying
user experience aspects for voice user interfaces with
intensive users.
K
¨
olln, K., Klein, A. M., Deutschl
¨
ander, J., Winter, D., and
Rauschenberger, M. (2023a). Categorizing ux aspects
for voice user interfaces using the kano model. In
Marchiori, M., Dom
´
ınguez Mayo, F. J., and Filipe, J.,
editors, Web Information Systems and Technologies,
pages 209–228. Springer Nature Switzerland.
K
¨
olln, K., Klein, A. M., Deutschl
¨
ander, J., Winter, D., and
Rauschenberger, M. (2023b). Protocol for categoriz-
ing ux aspects for voice user interfaces using the kano
model.
Lee, C. and Coughlin, J. (2014). Perspective: Older adults’
adoption of technology: An integrated approach to
identifying determinants and barriers. Journal of
Product Innovation Management, 32.
Lee, M. C. and Newcomb, J. F. (1997). Applying the kano
methodology to meet customer requirements: Nasa’s
microgravity science program. Quality Management
Journal, 4(3):95–106.
Lis, J. (2022). How big is the voice assistant market? Ac-
cessed 26-May-2023.
WEBIST 2023 - 19th International Conference on Web Information Systems and Technologies
338

Mitzner, T. L., Boron, J. B., Fausset, C. B., Adams, A. E.,
Charness, N., Czaja, S. J., Dijkstra, K., Fisk, A. D.,
Rogers, W. A., and Sharit, J. (2010). Older adults talk
technology: Technology usage and attitudes. Comput-
ers in human behavior, 26(6):1710 – 1721.
Palan, S. and Schitter, C. (2018). Prolific.ac a subject pool
for online experiments. Journal of Behavioral and Ex-
perimental Finance, 17:22–27.
Peer, E., Rothschild, D., Gordon, A., Evernden, Z., and
Damer, E. (2021). Data quality of platforms and pan-
els for online behavioral research. Behavior Research
Methods, 54:1643–1662.
Pradhan, A., Lazar, A., and Findlater, L. (2020). Use of
intelligent voice assistants by older adults with low
technology use. ACM Trans. Comput.-Hum. Interact.,
27(4).
Prolific Academic Ltd. (2023). Accessed 06-Mar-2023.
Rauschenberger, M. (2021). Acceptance by Design : Voice
Assistants. In 1st AI-DEbate Workshop : work-
shop establishing An InterDisciplinary pErspective on
speech-BAsed TEchnology, page 27.09.2021, Magde-
burg, Germany. OvGU.
Sauer, J. and Sonderegger, A. (2022). Visual aesthetics
and user experience: A multiple-session experiment.
International Journal of Human-Computer Studies,
165:102837.
Sigelman, C. K. and Rider, E. A. (2008). Life-Span Hu-
man Development. Wadsworth Cengage Learning, 6.
edition.
Song, Y., Yang, Y., and Cheng, P. (2022). The investiga-
tion of adoption of voice-user interface (vui) in smart
home systems among chinese older adults. Sensors,
22:1614.
Strassmann, C., Kr
¨
amer, N. C., Buschmeier, H., and Kopp,
S. (2020). Age-Related Differences in the Evaluation
of a Virtual Health Agent’s Appearance and Embod-
iment in a Health-Related Interaction: Experimental
Lab Study. Journal of Medical Internet Research,
22:e13726.
Tas¸, S., Hildebrandt, C., and Arnold, R. (2019). Voice As-
sistants in Germany. WIK Wissenschaftliches Institut
f
¨
ur Infrastruktur und Kommunikationsdienste GmbH.
Timko, M. (1993). An experiment in continuous analy-
sis. In Berger, C., Blauth, R., Boger, D., Bolster, C.,
Burchill, G., DuMouchel, W., Pouliot, F., Richter, R.,
Rubinoff, A., Shen, D., Timko, M., and Walden, D.,
editors, Kano’s methods for understanding customer-
defined quality, volume 2.4, pages 17–20. Center for
Quality Management Journal.
Townsend, D., Knoefel, F., and Goubran, R. (2011). Pri-
vacy versus autonomy: A tradeoff model for smart
home monitoring technologies. In 33rd Annual In-
ternational Conference of the IEEE Engineering in
Medicine and Biology Society, pages 4749–4752.
IEEE.
Tractinsky, N., Katz, A., and Ikar, D. (2000). What is beau-
tiful is usable. Interact. Comput., 13:127–145.
Vimalkumar, M., Sharma, S. K., Singh, J. B., and Dwivedi,
Y. K. (2021). ’Okay google, what about my privacy?’:
User’s privacy perceptions and acceptance of voice
based digital assistants. Computers in Human Behav-
ior, 120:106763.
Witell, L., L
¨
ofgren, M., and Dahlgaard, J. J. (2013). Theory
of attractive quality and the Kano methodology the
past, the present, and the future. Total Quality Man-
agement & Business Excellence, 24:1241 – 1252.
Zhong, R., Ma, M., Zhou, Y., Lin, Q., Li, L., and Zhang,
N. (2022). User acceptance of smart home voice as-
sistant: a comparison among younger, middle-aged,
and older adults. Universal Access in the Information
Society.
There Are no Major Age Effects for UX Aspects of Voice User Interfaces Using the Kano Categorization
339
