
Semi-Supervised Fuzzy C-Means for Regression
Gabriella Casalino
a
, Giovanna Castellano
b
and Corrado Mencar
c
Dept. of Computer Science, University of Bari Aldo Moro, Italy
Keywords:
Fuzzy Clustering, Semi-Supervised Clustering, Regression, Discretization.
Abstract:
We propose a method to perform regression on partially labeled data, which is based on SSFCM (Semi-
Supervised Fuzzy C-Means), an algorithm for semi-supervised classification based on fuzzy clustering. The
proposed method, called SSFCM-R, precedes the application of SSFCM with a relabeling module based on
target discretization. After the application of SSFCM, regression is carried out according to one out of two
possible schemes: (i) the output corresponds to the label of the closest cluster; (ii) the output is a linear
combination of the cluster labels weighted by the membership degree of the input. Some experiments on
synthetic data are reported to compare both approaches.
1 INTRODUCTION
One of the methodologies at the heart of machine
learning is Semi-Supervised Learning (SSL), a fusion
of supervised and unsupervised learning, which was
developed as a result of the widespread availability of
unlabeled data in many fields and, at the same time,
the dearth of labeled data. Indeed, in many real-world
applications, a huge amount of data is continuously
generated, but only a few of them are labeled. La-
beling data is indeed time-consuming, and sometimes
it is not possible due to the large volume of data, the
speed of acquisition, or both. Cyber attacks, fraudu-
lent transactions, or anomalies in monitoring systems
are just a few examples where labeling all data is in-
feasible.
To overcome these limitations, SSL methods try to
use as much unlabeled data as possible while requir-
ing only a small amount of labeled data to drive pre-
diction. Depending on the characteristics of the pre-
dicted output, two different approaches can be located
under the SSL umbrella: Semi-Supervised Classifi-
cation and Semi-Supervised Regression (Kostopoulos
et al., 2018).
Numerous studies over the past years have dealt
with the use of Semi-Supervised Classification ap-
proaches in many real-world applications such as
text analysis (Duarte and Berton, 2023), e-health
(Qayyum et al., 2023; Casalino et al., 2023; Kmita
a
https://orcid.org/0000-0003-0713-2260
b
https://orcid.org/0000-0002-6489-8628
c
https://orcid.org/0000-0001-8712-023X
et al., 2022), image analysis (Qiu et al., 2023; Liu
et al., 2023b), learning analytics (Liu et al., 2023a),
manufacturing (Kim et al., 2023; Leite et al., 2020),
energy management (Hao and Xu, 2023), just to men-
tion a few. Moreover, semi-supervised extensions of
clustering algorithms are often used for classification
by exploiting the information deriving from the few
available labels (Gonz
´
alez-Almagro et al., 2023).
In contrast, few works deal with Semi-Supervised
Regression, which is still a lightly touched instance of
SSL. Notable SSR techniques are the COREG (Zhou
et al., 2005) and the SSKR (Semi-Supervised Kernel
Regression) (Wang et al., 2006) algorithms. Kang et
al. (Kang et al., 2016) introduce representative SSR
algorithms such as Co-training, kernel, and graph-
based regression methods.
In this work we propose SSFCM-R, a semi-
supervised regression method that leverages the
Semi-Supervised Fuzzy C-Means algorithm (SS-
FCM), previously employed for semi-supervised clas-
sification (Pedrycz and Waletzky, 1997). SSFCM-R
extends SSFCM by adding some components useful
to perform a prediction task linked to regression, start-
ing from partially labeled data. At the core of the
SSFCM-R method is a relabeling process based on
a discretization of the available target values that en-
ables the application of the SSFCM-based classifier.
After the application of SSFCM, regression is carried
out according to one out of two possible schemes: (i)
the output corresponds to the label of the closest clus-
ter; (ii) the output is a linear combination of the clus-
ter labels weighted by the membership degree of the
Casalino, G., Castellano, G. and Mencar, C.
Semi-Supervised Fuzzy C-Means for Regression.
DOI: 10.5220/0012195100003595
In Proceedings of the 15th International Joint Conference on Computational Intelligence (IJCCI 2023), pages 369-375
ISBN: 978-989-758-674-3; ISSN: 2184-3236
Copyright © 2023 by SCITEPRESS – Science and Technology Publications, Lda. Under CC license (CC BY-NC-ND 4.0)
369

input. Three different discretization strategies have
been compared to identify the most effective. They
group data in subsets, called bins, which are assigned
to continuous outputs, on the basis of different criteria
(equal width distribution, quantiles, k-means). Syn-
thetic data, of different complexity, have been gener-
ated to study the robustness of the proposed method.
Also, different labeling percentages have been consid-
ered to study the algorithm behavior when the number
of available labels decreases. Finally, the influence of
the size of bins on the regression results has been an-
alyzed.
The paper is organized as follows. In section 2
the proposed algorithm is formalized. The results of
the numerical experiments are discussed in Section 3.
Section 4 concludes the work and future directions of
this research are outlined.
2 THE PROPOSED METHOD
The proposed SSFCM-R extends SSFCM (Semi-
Supervised Fuzzy C-Means) (Pedrycz and Waletzky,
1997), which was originally designed for classifica-
tion, by adding some mechanisms useful to accom-
plish a regression task.
2.1 SSFCM
SSFCM is a semi-supervised version of the FCM
(Fuzzy C-Means) algorithm, which exploits partially
labeled data to drive the clustering process. The al-
gorithm generates clusters from a set of data that can
be completely or partially labeled, by minimizing the
following objective function:
J =
K
∑
k=1
N
∑
j=1
u
m
jk
d
2
jk
+ α
K
∑
k=1
N
∑
j=1
u
jk
− b
j
f
jk
m
d
2
jk
(1)
where K is the number of clusters, N is the number of
samples, u
jk
∈ [0, 1] is the membership degree of sam-
ple x
j
in the k-th cluster; d
jk
is the Euclidean distance
between x
j
and the center c
k
of the k-th cluster; m is
the fuzzification parameter (we will assume m = 2).
Peculiar to SSFCM is the introduction of vari-
ables b
j
= b(x
j
), where b : X 7→ {0, 1} is such that
b(x) = 1 iff x is pre-labeled, i.e., its class value is
known, and f
jk
= 1 iff the j-th sample has the k-th
class label, 0 otherwise (notice that f
jk
is undefined
when b
j
= 0). The regularization parameter α ≥ 0
weights the second term of the objective function, that
uses the class information; according to (Pedrycz and
Waletzky, 1997), its value is the ratio of unlabeled
data over all available data.
The outcome of SSFCM is a partition matrix U =
u
jk
and a set of K cluster centroids
c
k
=
∑
N
j=1
u
2
jk
x
j
∑
N
j=1
u
2
jk
(2)
that minimize (1). The details of the optimization
schema are reported in (Pedrycz and Waletzky, 1997).
2.2 SSFCM-R
The core strategy of SSFCM-R is to consider the class
label as the output of the function to be approximated.
In order to enable regression through SSFCM, we first
extend the original algorithm by admitting the possi-
bility that the number of clusters (K) is greater than
or equal to the number of class labels (C). In other
words, different clusters can be assigned to the same
class label. This extension is necessary because a
function can have approximately the same value in
different regions of the domain.
In this respect, the variables f
jk
occurring in (1)
are re-interpreted as follows: f
jk
= 1 if the j-th sam-
ple has the same class label as the k-th cluster pro-
totype, 0 otherwise. This change of interpretation re-
quires evaluating the class label of a cluster prototype.
To this pursuit, before starting the SSFCM clustering
process, K labeled data are randomly chosen to ini-
tialize the prototypes, so that each cluster prototype is
associated with a class label.
Once the clustering process is complete, the clas-
sification of an unlabeled data sample is based on
a matching method using the derived labeled proto-
types. Specifically, an unlabeled data sample is as-
signed the label of the closest prototype, according to
the Euclidean distance.
Differently from SSFCM, where class labels do
not have any specific structure, in SSFCM-R the class
labels are numbers. Thus, SSFCM-R consists of the
following three main stages:
1. Pre-processing: a discretization process and a
subsequent relabeling process is applied to the tar-
get values to reduce the regression problem to one
of classification;
2. Clustering is performed as in SSFCM;
3. Post-processing: given the discrete output values
provided by SSFCM-based classification, the fi-
nal predicted output value is computed as either
by looking at the closest cluster, or by a linear
combination of the discrete output values of all
clusters.
FCTA 2023 - 15th International Conference on Fuzzy Computation Theory and Applications
370
2.2.1 Pre-Processing
Suppose that a set D of partially labeled data is avail-
able, representing an unknown function f : X → Y .
The set D consists of tuples (x, y), where x ∈ X and
y ∈ Y ∪ {}. (The tuple (x, ) represents an unla-
beled data sample.) The goal of regression is to find a
model that approximates f starting from D.
Let
L = {(x, y) ∈ D|y 6= }
the subset of labeled data samples of D. We assume
that L has cardinality N
L
> 0. Let Y = {y ∈ Y |(x, y) ∈
L} the set of numerical labels. The set Y is discretized
into C intervals; for each interval [a
i
, b
i
], i = 1,2, . . . ,C
the subset Y
i
= Y ∩ [a
i
, b
i
] is computed (i.e., the subset
of labels falling in the i-th interval) and the average
value ˆy
i
is considered. The set of labels is therefore
ˆ
Y = { ˆy
i
|i = 1, 2, . . . ,C}.
The dataset D is then transformed into a new
dataset
ˆ
D so that each labeled sample (x, y) is replaced
with (x, ˆy
i
), where ˆy
i
is the average of the subset Y
i
the
label y belongs to. The number C of bins is a hyper-
parameter that should be fixed in advance.
We consider three different discretization strate-
gies:
D1: Equal-width discretization, separating all possi-
ble values into C bins, each having the same
width;
D2: Equal-frequency discretization, separating all
possible values into C bins, each having the same
amount of observations;
D3: The intervals are defined on the basis of the cen-
troids produced by K-Means clustering.
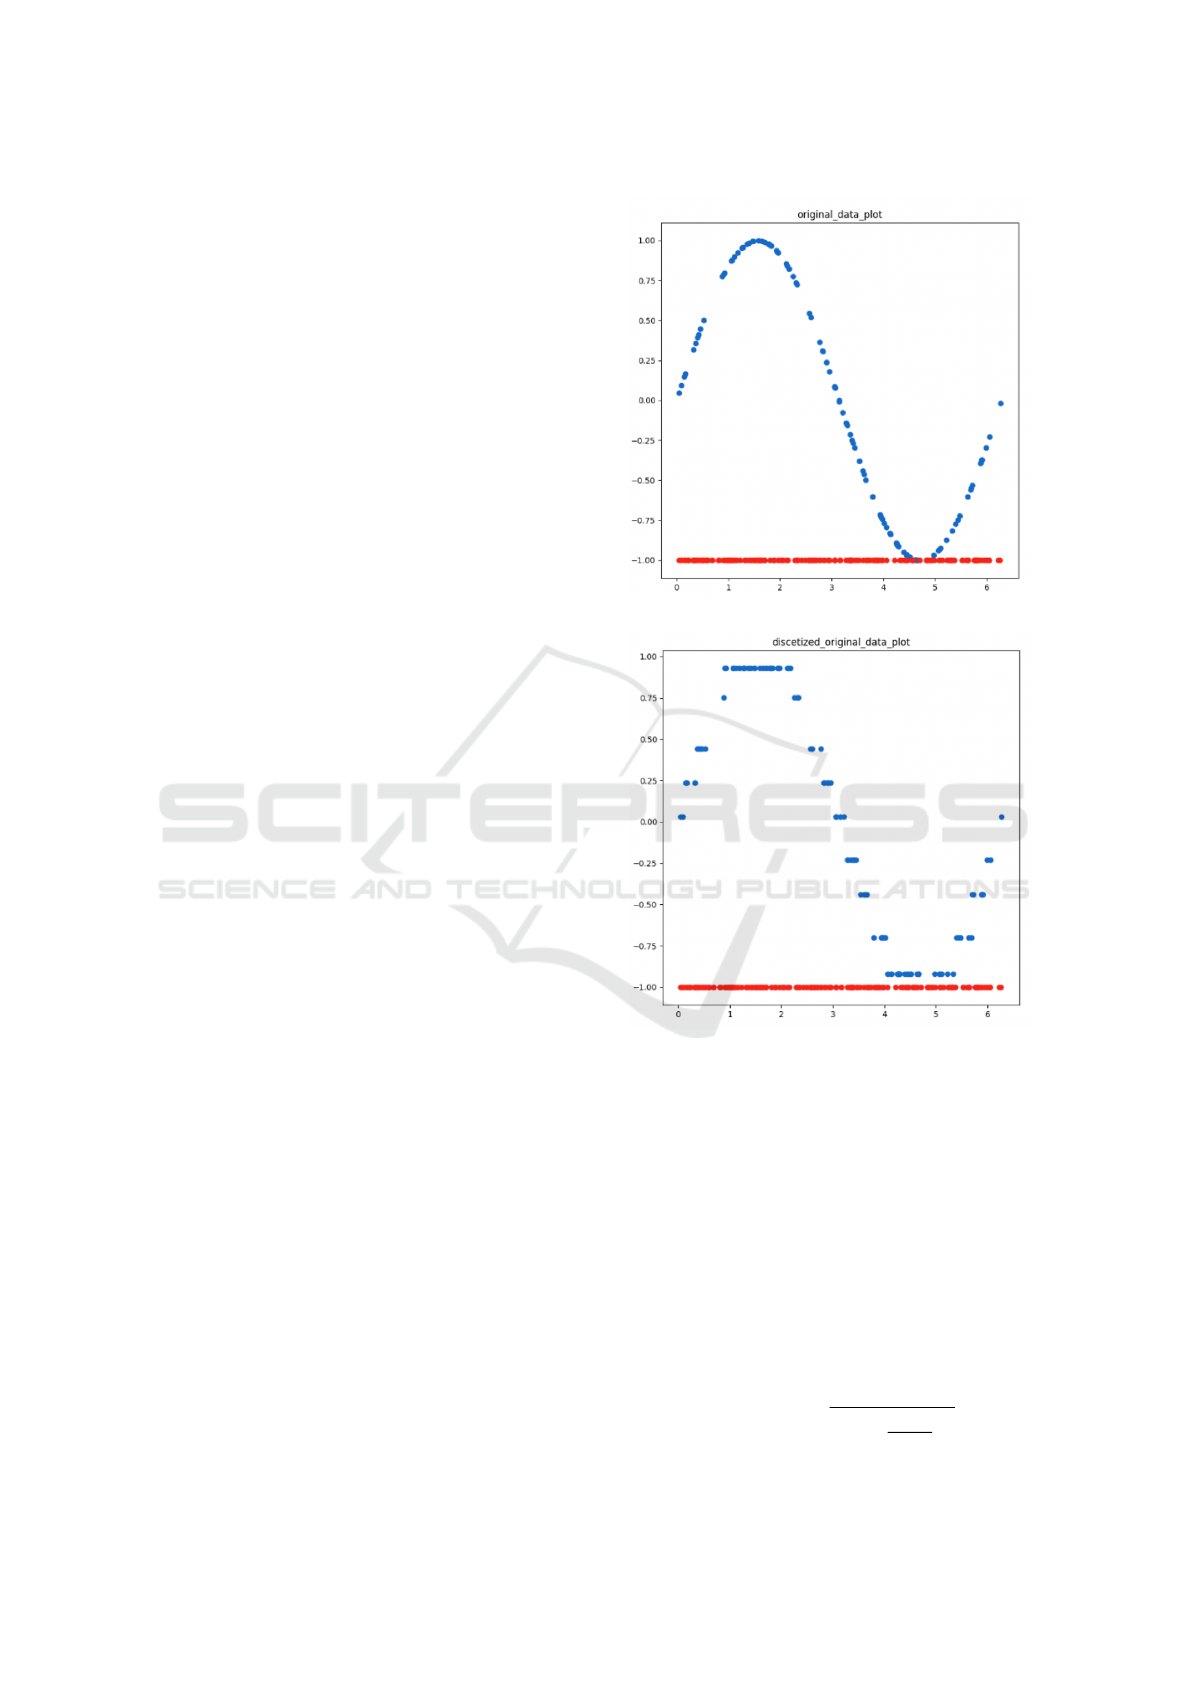
As an example, fig. 1 shows the values of the sine
function in [0, 2π], before and after the discretization
step. The first plot (fig. 1a) represents the sine func-
tion with partially labeled data (red dots correspond
to unlabeled data). The second plot (fig. 1b) displays
the target values after equal width discretization, with
the number of bins equal to the 10% of labeled data
(in this case C = 9).
2.2.2 Clustering
The pre-processed dataset
ˆ
D is used as input to SS-
FCM, as described in Sec. 2.1. The output is a col-
lection of labeled cluster prototypes (c
k
, ˆy
i
k
) where
ˆy
i
k
∈
ˆ
Y and a partition matrix U = [u
jk
] of each data
sample (either labeled or unlabeled) to each cluster.
2.2.3 Post-Processing
Given a new input x ∈ X , the estimated value y can be
computed according to one out of two possible strate-
(a)
(b)
Figure 1: Original partially labeled data obtained by sine
function (a) and equal width discretized data with 9 bins
(b).
gies:
(max) The closest prototype c
k
to x is determined;
then, the estimated value y
max
corresponds to
the class label ˆy
i
k
;
(sum) The membership degrees of x to each clus-
ter are determined by using the formula used
in SSFCM to compute the membership de-
grees for unlabeled data (Pedrycz and Walet-
zky, 1997):
u
k
(x) =
1
∑
K
h=1
d(x,c
k
)
d(x,c
h
)
2
Semi-Supervised Fuzzy C-Means for Regression
371
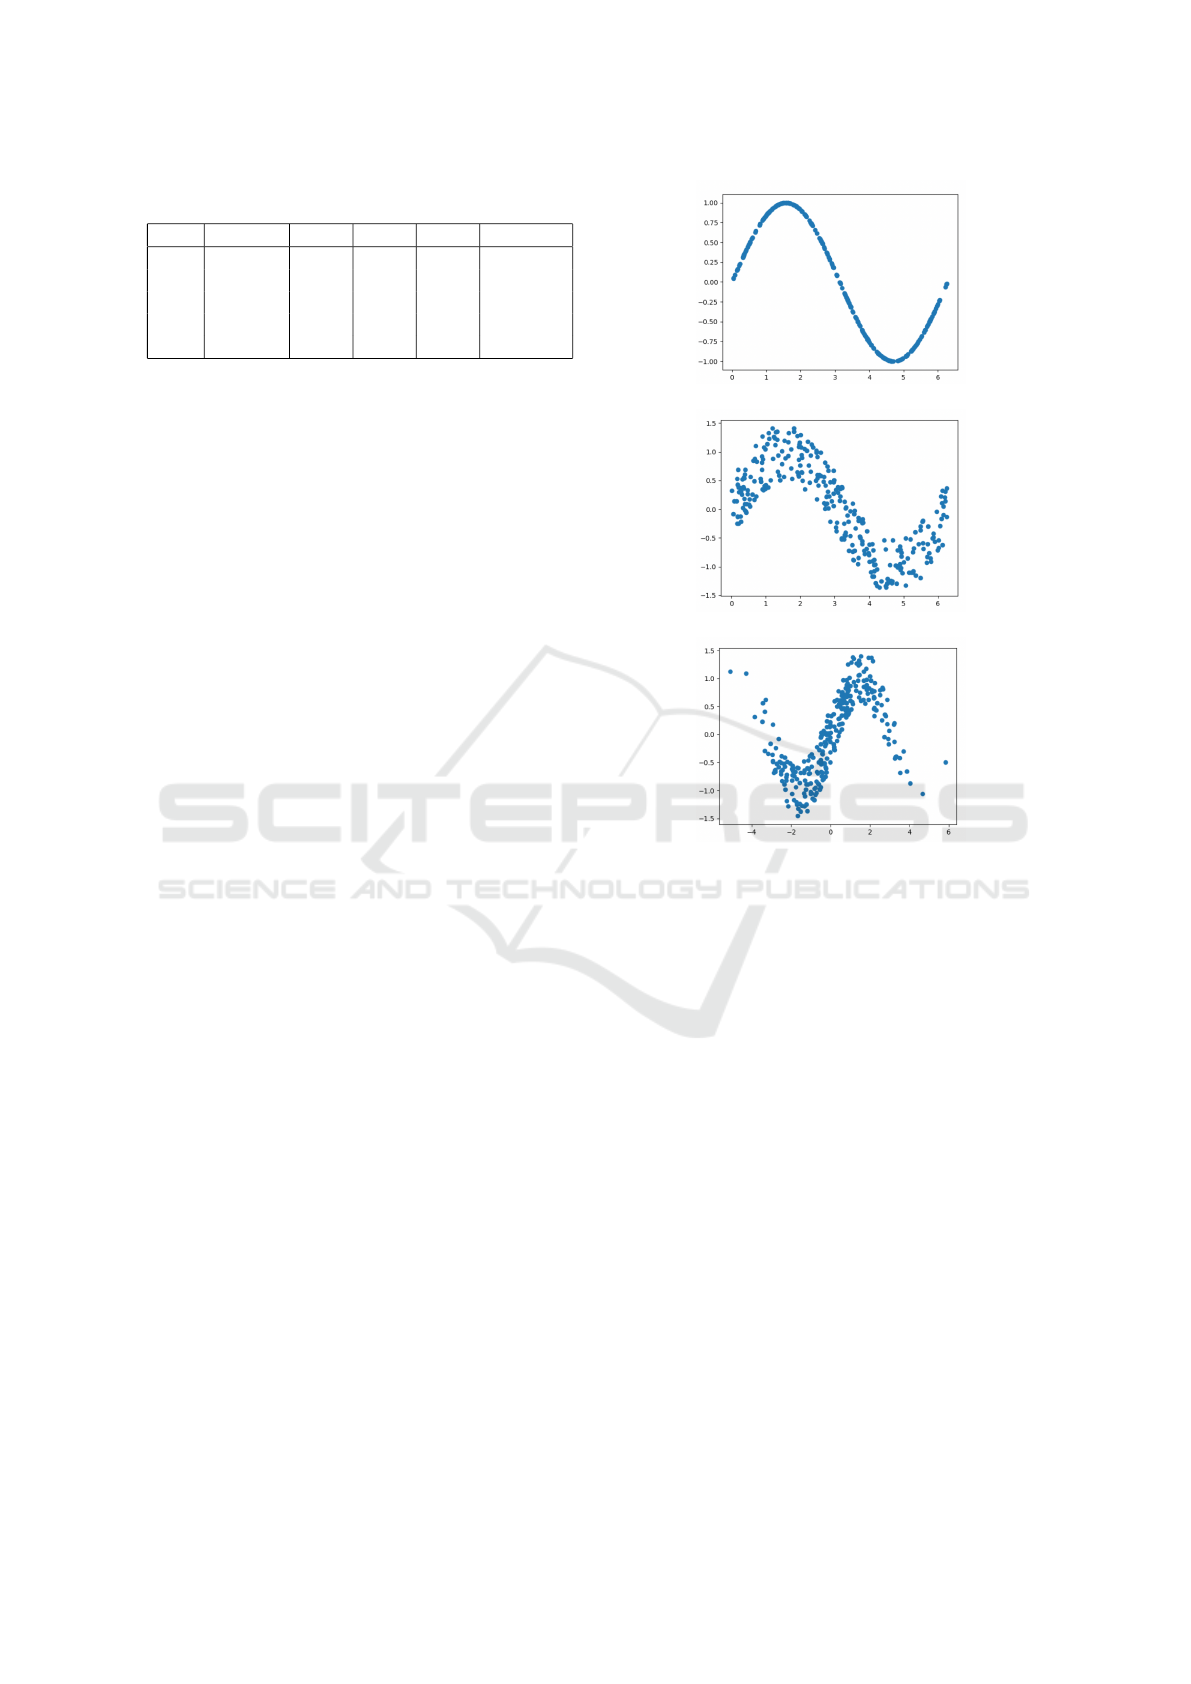
Table 1: Example of results given by SSFCM-R.
x Labeled ˆy y
sum
y
max
y (target)
3.67 No -0.31 -0.70 -0.50
3.95 Yes -0.70 -0.66 -0.70 -0.72
1.06 Yes 0.93 0.91 0.93 0.87
2.25 Yes 0.75 0.73 0.75 0.77
3.98 No -0.40 -0.70 -0.74
Since
∑
K
k=1
u
k
(x) = 1, then the estimated value
y corresponds to the weighted average
y
sum
=
K
∑
k=1
u
k
(x) ˆy
i
k
Table 1 shows an example of results obtained by
SSFCM-R for five data points (labeled and not la-
beled). The third column shows the class, in terms
of discretized bin value, that has been assigned. The
last column indicates the real output for the given in-
put. Two more values are reported: y
sum
and y
max
,
which are estimated according to the two aforemen-
tioned strategies.
3 EXPERIMENTS
Some experiments have been conducted to verify the
effectiveness of the proposed approach, by varying
the discretization strategy, the percentage of labeled
data, and the number of bins used for discretization.
Moreover, three synthetic datasets, of different com-
plexity, have been created. For the sake of simplic-
ity, bi-dimensional data have been produced, where
the second dimension is the value to predict. Noise
has been added to the simplest dataset with different
distributions (uniform and normal), thus making the
predictive problem more complex to solve.
Partial labeling has been simulated in order to
evaluate the robustness of the proposed algorithm in
the presence of unlabeled data at varying frequen-
cies. Particularly, eight labeling percentages have
been considered, namely: 10%, 30%, 50%, 60%,
70%, 80%, 90%, and 100%. Also, three different bin
sizes have been compared by considering the 10%,
20%, and 30% of labeled data. Different bin sizes
have been used, from 3 to 90.
The standard Mean Square Error (MSE) and the
computational time (TIME) have been used as evalu-
ation metrics for the comparison. We compare the er-
rors obtained with the two post-processing methods:
MSE sum and MSE max.
(a) S1.
(b) S2.
(c) S3.
Figure 2: Synthetic datasets.
3.1 Data
Figure 2 shows the three synthetic dataset S1, S2, and
S3 created as follows:
• S1 consists of the evaluation of the sine function
on 300 data points generated with a uniform dis-
tribution in the interval [0, 2π]: Y = sin X where
X ∼ U([0, 2π])
• S2 consists of the evaluation of the sine function
on 300 data points generated with a uniform dis-
tribution in the interval [0, 2π] as in S1 plus a noise
term with uniform distribution: Y = sin X + ε
where X ∼ U([0, 2π]) and ε ∼ U([−0.5, 0.5])
• S3 consists of the evaluation of the sine func-
tion on 300 points generated from a normal dis-
tribution plus a noise term with uniform distri-
bution: Y = sinX + ε where X ∼ N(0, π) and
ε ∼ U([−0.5, 0.5])
FCTA 2023 - 15th International Conference on Fuzzy Computation Theory and Applications
372
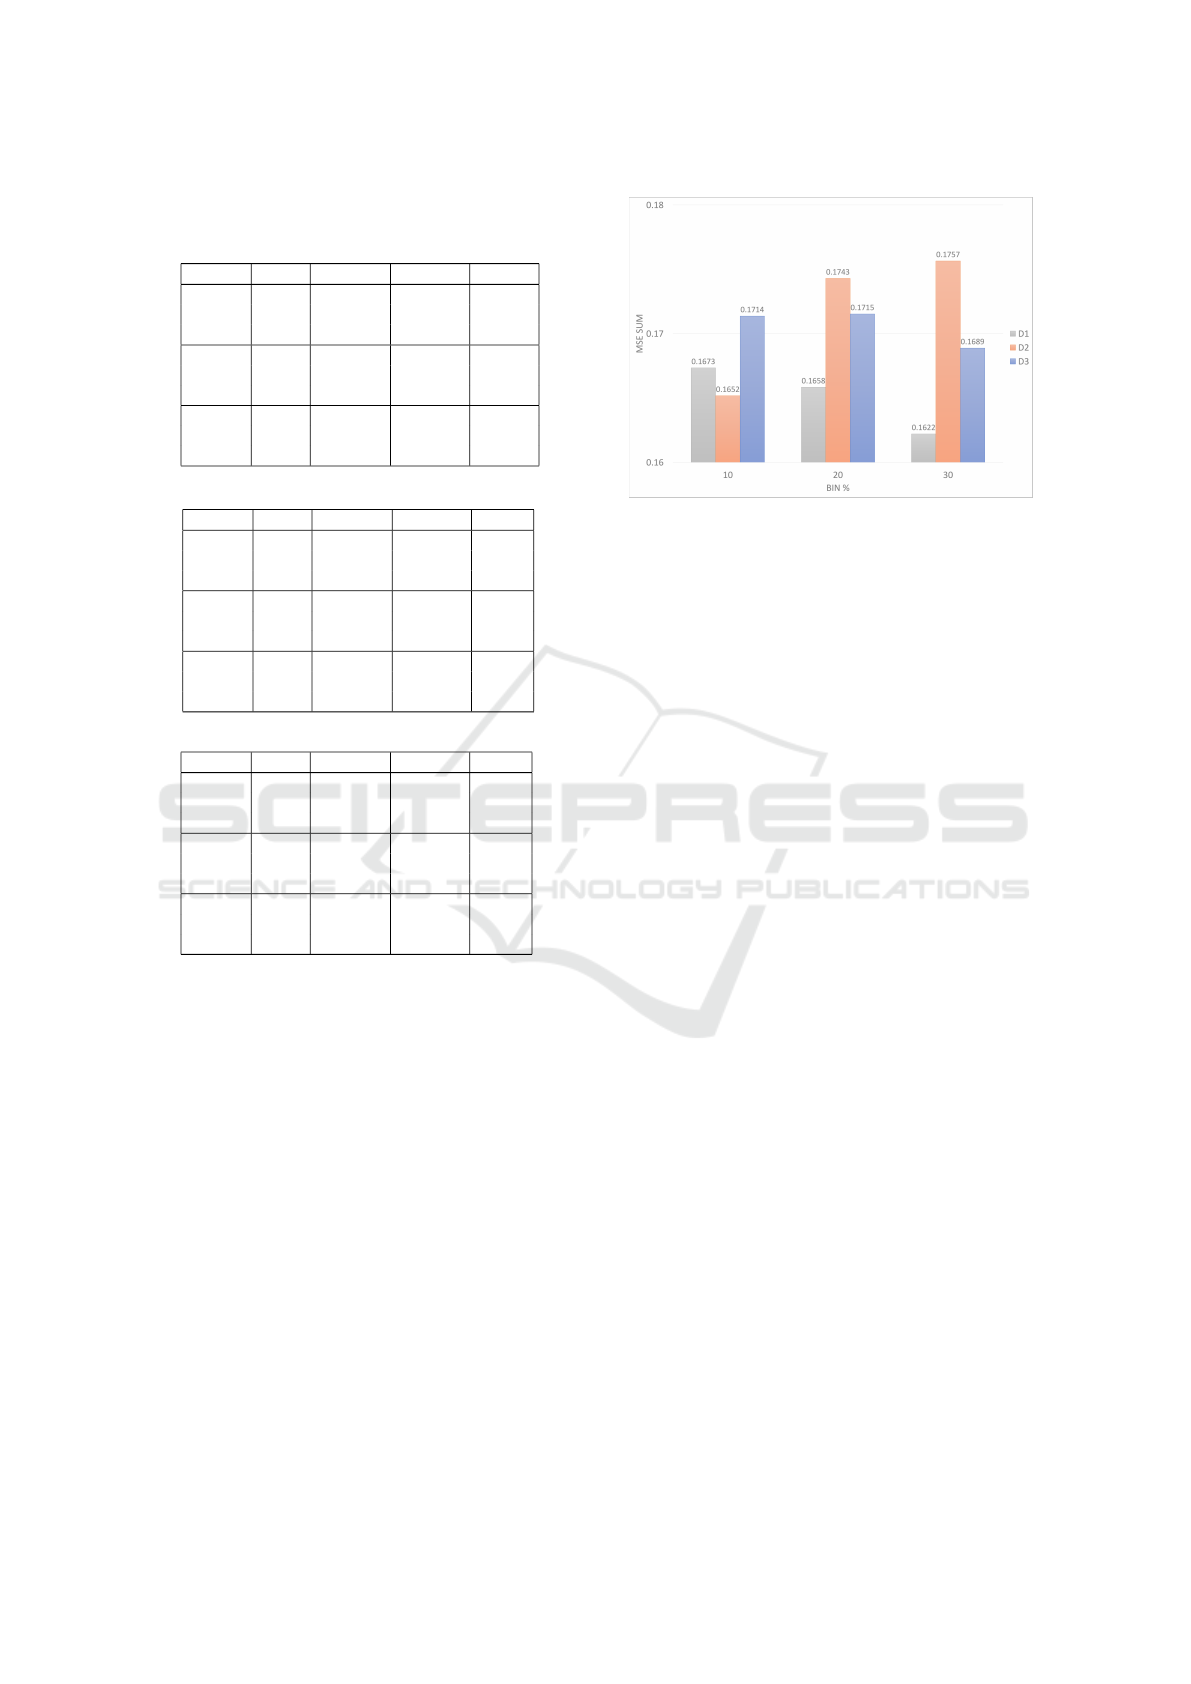
Table 2: Comparison of different discretization strategies,
varying the percentages of adopted bins, with S1, S2, and
S3 datasets.
Strategy Bin % MSE max MSE sum Time
D3 10 0.18 0.12 130.20
20 0.20 0.12 390.63
30 0.18 0.10 687.84
D2 10 0.15 0.12 110.80
20 0.18 0.13 326.19
30 0.27 0.14 1228.27
D1 10 0.17 0.11 82.33
20 0.19 0.13 397.84
30 0.19 0.10 626.00
(a) S1 dataset.
Strategy Bin % MSE max MSE sum Time
D3 10 0.22 0.19 104.78
20 0.18 0.18 448.68
30 0.22 0.18 939.75
D2 10 0.20 0.17 91.56
20 0.20 0.17 402.34
30 0.21 0.18 969.61
D1 10 0.21 0.19 106.71
20 0.18 0.18 385.93
30 0.20 0.18 724.61
(b) S2 dataset.
Strategy Bin % MSE max MSE sum Time
D3 10 0.26 0.20 110.07
20 0.26 0.21 383.59
30 0.26 0.22 666.51
D2 10 0.29 0.21 97.49
20 0.30 0.22 323.47
30 0.30 0.20 833.30
D1 10 0.25 0.19 90.64
20 0.23 0.19 309.12
30 0.23 0.20 635.72
(c) S3 dataset.
3.2 Results
Table 2 shows the numerical results obtained by vary-
ing the bin percentages, the discretization methods,
and the datasets. Average measures over all the la-
beling percentages have been reported for the three
datasets S1, S2, and S3.nExpectedly, as the complex-
ity of data increases, errors also increase, but this is
not the only parameter to consider. In fact, the MSE
max obtained with the discretization D1, and bin %
30 on the simplest data S1, is higher than the error
obtained with D1 on S3, the most complex dataset.
Thus, different combinations of parameters, affecting
the regression results, are analyzed. The computa-
tional time is strictly proportional to the number of
bins; this is observed for each data and discretization
method.
To better analyze the results, charts focusing
on each parameter (discretization method, bin per-
Figure 3: Average MSE values varying the discretization
method and the bin percentages, over the labeling percent-
ages and the datasets.
centages, labeling percentages, and post-processing
method) and varying the others, have been reported.
Figure 3 compares the three discretization methods,
by varying the bin percentages. Average values over
the labeling percentages and the three datasets have
been reported. It is observed that the equal width
strategy (D1) has the lowest MSE on average, regard-
less of the dataset complexity. Also, by increasing the
bin percentage, the equal width strategy provides the
lowest MSE, with respect to the other two approaches.
Moreover, the equal width strategy has also the lowest
computational time, in seconds, among all the consid-
ered strategies (D1=373.21, D2=487.00, D3=429.12).
For this reason, we now focus on the equal width dis-
cretization strategy, and analyze the influence of the
labeling percentage and the bin size, in terms of MSE
sum and MSE max, averaged on all the remaining pa-
rameters.
Figure 4a shows the influence of the labeling
percentages by averaging the results from different
datasets, and bin percentages. It could be observed
that the labeling percentage strongly affects the pre-
dictions. Indeed, as expected, as the number of labels
increases, the error decreases. However, with a label-
ing percentage lower than 60% the algorithm is not
stable, and peaks could be observed in the graph. As
the labeling percentage increases over 60% the error
significantly decreases. It is also observed that MSE
sum is significantly lower than MSE max when the
percentage of labeled data is low, while both converge
to similar values for higher labeling percentages.
We analyzed the influence of the bin size on the re-
sults to identify the best percentage. Figure 4b shows
the average measures over the three datasets, varying
the labeling percentages. It could be observed that the
bin percentage does not influence the predictive capa-
bility of the algorithm, returning comparable errors.
Semi-Supervised Fuzzy C-Means for Regression
373
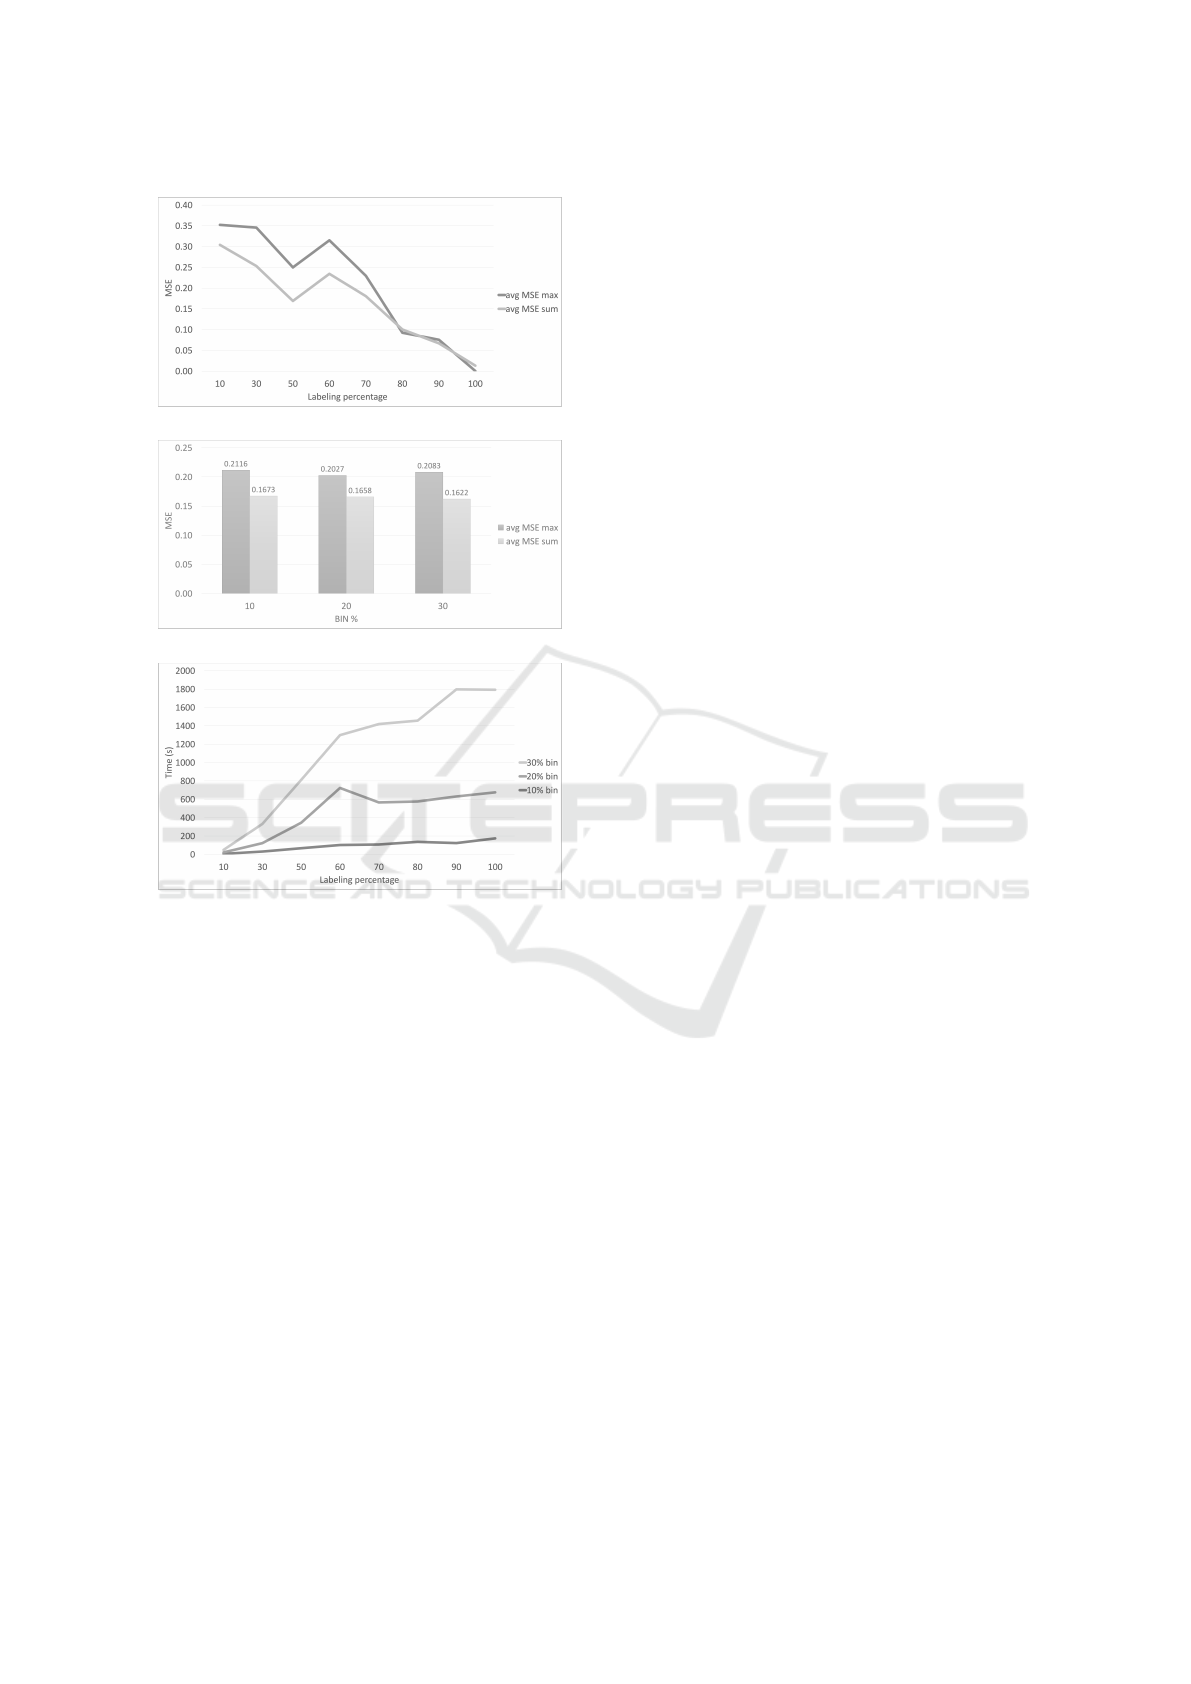
(a)
(b)
(c)
Figure 4: Effectiveness and efficiency of SSCFCM-R with
equal width discretization.
Finally, the value (in seconds) of computational
time for the equal width discretization, varying the la-
beling percentage and the bin percentage, are summa-
rized in Fig. 4c, by averaging results over all datasets.
It can be seen that computational time increases as
the percentage of bins and the labeling percentage in-
crease. Overall, since the bin size does not influence
the effectiveness of the methods, whilst it does influ-
ence the computational time, a small number of bins
(10% of labeled data), is the best choice for both high
efficiency and effectiveness.
4 CONCLUSIONS
We have proposed SSFCM-R, an extension of the
Semi-Supervised Fuzzy C-Means (SSFCM) algo-
rithm that is suitable for regression. SSFCM-R lever-
ages a discretization mechanism to move from a con-
tinuous domain (useful to solve a regression problem)
to a discrete one (that SSFCM is able to process). To
this aim three different discretization strategies have
been compared, based on equally sized bins (subsets
of data), percentiles, and k-means. Experiments have
been performed to analyze the effectiveness of the
proposed approach in different conditions. Particu-
larly, the influence of data complexity, discretization
strategy, labeling percentage, and number of bins, on
the results, has been studied. In this preliminary work,
synthetic data has been produced for controlled exper-
iments. The equal width strategy has been proven to
be the more effective, with a lower error if compared
with the other discretization strategies. Also, whilst
the number of labeled data influences the results, re-
sulting in low performances for labeling percentages
lower than 60%, the number of adopted bins does not.
Thus, since the computational time is strictly related
to the number of bins, a small number is preferable.
Finally, the post-processing method sum has shown to
always achieve lower errors than the max method.
Overall, this is the first attempt to modify SSFCM
for regression. This study has been useful to iden-
tify the parameters that mostly affect the results and
which of them allow the algorithm to perform better.
Future work will be devoted to studying different dis-
cretization strategies, not depending on the labeling
percentage and the data complexity. Also, the effec-
tiveness of the proposed approach will be evaluated
on real-world applications, and it will be compared
with other semi-supervised regression algorithms.
ACKNOWLEDGEMENTS
G. Casalino acknowledges funding from the Euro-
pean Union PON project Ricerca e Innovazione 2014-
2020, DM 1062/2021. G. Castellano’s work is par-
tially supported by the FAIR - Future AI Research
(PE00000013) project, Spoke 6 - Symbiotic AI (CUP
H97G22000210007), under the NRRP MUR program
funded by NextGenerationEU. All the authors are
members of the INdAM GNCS research group. The
authors thank the students Michele Gabriele Addati
and Nunziangelo Bruno for their contribution to de-
veloping the code and running the experiments.
REFERENCES
Casalino, G., Castellano, G., Hryniewicz, O., Leite, D.,
Opara, K., Radzieskewska, W., and Kaczmarek-
Majer, K. (2023). Semi-supervised vs. supervised
learning for mental health monitoring: a case study on
FCTA 2023 - 15th International Conference on Fuzzy Computation Theory and Applications
374

the classification of bipolar disorder episodes. Journal
of Applied Mathematics and Computer Science, 33(3).
Duarte, J. M. and Berton, L. (2023). A review of semi-
supervised learning for text classification. Artificial
Intelligence Review, pages 1–69.
Gonz
´
alez-Almagro, G., Peralta, D., De Poorter, E., Cano,
J.-R., and Garc
´
ıa, S. (2023). Semi-supervised con-
strained clustering: An in-depth overview, ranked tax-
onomy and future research directions. arXiv preprint
arXiv:2303.00522.
Hao, L. and Xu, Y. (2023). Semi-supervised learning based
occupancy estimation for real-time energy manage-
ment using ambient data. IEEE Internet of Things
Journal.
Kang, P., Kim, D., and Cho, S. (2016). Semi-supervised
support vector regression based on self-training with
label uncertainty: An application to virtual metrology
in semiconductor manufacturing. Expert Systems with
Applications, 51:85–106.
Kim, G., Choi, J. G., Ku, M., and Lim, S. (2023). De-
veloping a semi-supervised learning and ordinal clas-
sification framework for quality level prediction in
manufacturing. Computers & Industrial Engineering,
181:109286.
Kmita, K., Casalino, G., Castellano, G., Hryniewicz, O.,
and Kaczmarek-Majer, K. (2022). Confidence path
regularization for handling label uncertainty in semi-
supervised learning: use case in bipolar disorder mon-
itoring. In 2022 IEEE International Conference on
Fuzzy Systems (FUZZ-IEEE), pages 1–8. IEEE.
Kostopoulos, G., Karlos, S., Kotsiantis, S., and Ragos, O.
(2018). Semi-supervised regression: A recent review.
Journal of Intelligent & Fuzzy Systems, 35(2):1483–
1500.
Leite, D., Decker, L., Santana, M., and Souza, P. (2020).
Egfc: Evolving gaussian fuzzy classifier from never-
ending semi-supervised data streams – with applica-
tion to power quality disturbance detection and clas-
sification. In 2020 IEEE International Conference on
Fuzzy Systems (FUZZ-IEEE), pages 1–9.
Liu, Z., Kong, W., Peng, X., Yang, Z., Liu, S., Liu,
S., and Wen, C. (2023a). Dual-feature-embeddings-
based semi-supervised learning for cognitive en-
gagement classification in online course discussions.
Knowledge-Based Systems, 259:110053.
Liu, Z., Lai, Z., Ou, W., Zhang, K., and Huo, H.
(2023b). Discriminative sparse least square regression
for semi-supervised learning. Information Sciences,
636:118903.
Pedrycz, W. and Waletzky, J. (1997). Fuzzy clustering with
partial supervision. IEEE transactions on systems,
man, and cybernetics. Part B, Cybernetics, 27(5):787–
95.
Qayyum, A., Tahir, A., Butt, M. A., Luke, A., Abbas, H. T.,
Qadir, J., Arshad, K., Assaleh, K., Imran, M. A., and
Abbasi, Q. H. (2023). Dental caries detection using
a semi-supervised learning approach. Scientific Re-
ports, 13(1):749.
Qiu, L., Cheng, J., Gao, H., Xiong, W., and Ren, H. (2023).
Federated semi-supervised learning for medical image
segmentation via pseudo-label denoising. IEEE Jour-
nal of Biomedical and Health Informatics.
Wang, M., Hua, X.-S., Song, Y., Dai, L.-R., and Zhang,
H.-J. (2006). Semi-supervised kernel regression.
In Sixth International Conference on Data Mining
(ICDM’06), pages 1130–1135. IEEE.
Zhou, Z.-H., Li, M., et al. (2005). Semi-supervised regres-
sion with co-training. In IJCAI, volume 5, pages 908–
913.
Semi-Supervised Fuzzy C-Means for Regression
375
