
Non-Invasive Anemia Detection Tool with Application of Mini
Spectrometry Base Machine Learning
Theresia Laura da Costa, Elsa Putri Alfiatun, Risa Picelia Dian Kusuma and Sari Ayu Wulandari
Department of Biomedical Engineering University of Dian Nuswantoro Semarang, Indonesia
fi
Keywords:
Anemia, FCM, Mini Spectrometry, Non-Invasive, PCA.
Abstract:
Anemia is a condition in which the level of hemoglobin (Hb) in the body is reduced. Prolonged anemia
can cause heart problems, pregnancy disorders, and even death. According to the 2018 basic health research
data, anemia sufferers in Indonesia have increased to 48.9%. to reduce the level of anemia, early detection
is needed, but the existing tools are usually invasive, namely using blood samples, which certainly reduces
public interest. This study aims to make an efficient non-invasive anemia detection tool as an option in ane-
mia detection. This tool was developed using the working principle of mini spectrometry, which recognizes
light sources in mini spectrometry using Near-infrared because the Hb wavelength is within the near-infrared
wavelength range. The Hb wavelength is 1700-1725 nm and the near-infrared wavelength is 1000-2500 nm.
The Photo-NIR detector is used as a sensor because it can capture signals according to the near-infrared wave-
length. The method used in signal processing is the Principal Component Analysis (PCA) method for feature
extraction and two feature variations are produced. Furthermore, grouping was carried out using the Fuzzy C
Means (FCM) method so as to produce anemic and non-anemic data based on the degree of membership. The
results of this study obtained an accuracy of 88%. In conclusion, the non-invasive detection tool succeeded in
separating anemic and non-anemic samples. Therefore, a non-invasive detection tool is needed as an option
for the detection of anemia.
1 INTRODUCTION
According to the 2018 basic health research data, ane-
mia sufferers in Indonesia increased to 48.9% from
the previous37.1%, with the age group 15-24 years
and 25-34 years (Sholikhah et al., 2021). Based on
data from the 2019 Semarang City Health Office, the
prevalence of anemia in Semarang in the group of
young women has increased to 43.75% and in the
group of pregnant women to 15.4%. meanwhile,
data from Kendal District Health Office in 2018, 715
itu 721 pregnant women experienced anemia, so in
2019, the maternal mortality rate reached 103.28 out
of 100,00 live births caused by bleeding.
Anemia is a health disorder caused by a lack of
red blood cells in the blood. Red blood cells are also
known as hemoglobin (Hb) (Agustina et al., 2022).
The normal standard for hemoglobin levels in the
blood is 12 g/dL, if the hemoglobin level in the blood
is below the normal standard, it can be said that
the person has entered symptoms of anemia. Cur-
rently, anemia detection is still using invasive meth-
ods. The use of invasive methods in detecting ane-
mia has several drawbacks, namely it is less efficient
and causes discomfort to its users because it requires
taking blood samples to detect anemia by inserting a
needle into the patient’s arm, then conducting a lab-
oratory examination and finding out the results takes
a long time (Bernecker et al., 2019; Dervieux et al.,
2020). Therefore, one of the efforts that must be made
in overcoming this problem is to make a detector or
tool to detect anemia that does not need to use nee-
dles (non-invasive), as the newest innovation that can
be an option in anemia detection.
Based on previous research related to non-invasive
detection of anemia, namely through the conjunctiva
of the eye based on digital image processing. In this
study, the feature extraction method was carried out
using the SVM classification. The results obtained
have an accuracy of 72,916%. However, this study
still has drawbacks, namely the accuracy of the de-
tection results is affected by the intensity of light. If
the light intensity obtained is less, then the resulting
accuracy results are less precise (Hasan and Ismaeel,
2020). In addition, research related to anemia detec-
tion has also been carried out before detecting Hb. In
38
Laura da Costa, T., Alfiatun, E., Kusuma, R. and Wulandari, S.
Non-Invasive Anemia Detection Tool with Application of Mini Spectrometry Base Machine Learning.
DOI: 10.5220/0012441400003848
Paper published under CC license (CC BY-NC-ND 4.0)
In Proceedings of the 3rd International Conference on Advanced Information Scientific Development (ICAISD 2023), pages 38-45
ISBN: 978-989-758-678-1
Proceedings Copyright © 2024 by SCITEPRESS – Science and Technology Publications, Lda.

this study, Hb detection was carried out based on the
light intensity received by the sensor. However, in this
study there were still some data that could not be read
(Morscher et al., 2014).
This non-invasive technology was developed us-
ing the working principle of mini spectrometry, which
recognizes light dispersion using pastern recognition
algorithms on the finger of anemic patients (Mum-
tazmi et al., 2022). The light source in mini spectrom-
etry uses near-infrared because the Hb wavelength is
within the near-infrared wavelength range. The Hb
wavelength is 1700-1725 nm and the near-infrared
wavelength is 870-2500 nm (Nasruddin et al., 2021;
Nidianti et al., 2019). The photo-NIR detector is used
as a sensor because it can capture signals according to
the near-infrared wavelength. The catch of the photo-
NIR detector is in the form of analog signal data that
is converted to digital (ADC). The ADC signal data
is then processed using the principal component anal-
ysis (PCA) feature extraction method, then using the
fuzzy c-means (FCM) classification method is used to
find points in clusters based on their degree of mem-
bership to separate anemic and non-anemic data. Data
resulting from the detection of anemia or non-anemia
can be viewed quickly in realtime, without requiring a
long time, namely by using the Blynk IoT application
which can be accessed using a smartphone/PC.
2 MATERIAL AND METHODS
2.1 Hardware Design
In designing non-invasive anemia detection hardware,
the tools needed are ESP32 to function as a micro-
controller, and near-infrared as a light source with a
wavelength of 1000-2500 nm Near-infrared is used as
a light source because the wavelength of Hb 1700-
1725 nm is included in the near-infrared wavelength
range (Nasruddin et al., 2021). Furthermore, a photo-
NIR detector is used as a sensor because the photo-
NIR detector is a sensor that can capture the wave-
lengths generated by near-infrared itself, a USB cable
as a connection device with a voltage source, a poly-
carbonate chip that functions in decomposing light
from near-infrared. DC to DC stepdown is used as a
liaison near-infrared, sensors and also servo motors to
ESP32, and servo motors that function to rotate poly-
carbonate plates.
The first step in making this detection tool is to
connect the servo motor, near-infrared and photo-NIR
detector to the ESP32 using a DC to DC stepdown ca-
ble. After that, the polycarbonate chip is placed on
the device parallel to the near-infrared above the servo
motor, so that the light produced by near-infrared can
be decomposed using the polycarbonate chip. The
last process is to connect the voltage source to the
ESP32 using a USB cable to operate properly.
The workings of this anemia detection tool use the
working principle of mini spectrometry, namely rec-
ognizing light dispersion using pattern recognition al-
gorithms on the fingers of people with anemia (Mum-
tazmi et al., 2022). Detection is carried out by decom-
posing light from near-infrared through polycarbon-
ate chips to obtain a light color with the same wave-
length as the Hb wavelength, namely 1700-1725 nm
(Nasruddin et al., 2021). Light with the same wave-
length as the Hb wavelength is directed to the patient’s
index finger which is in the finger slot. Some of the
light is absorbed by the finger and some of the light is
passed on. The transmitted light will be captured by
the photo-NIR detector and used in the detection of
anemia. The following is a hardware manufacturing
block diagram shown in Figure 1.
Figure 1: Hardware Manufacturing Block Diagram.
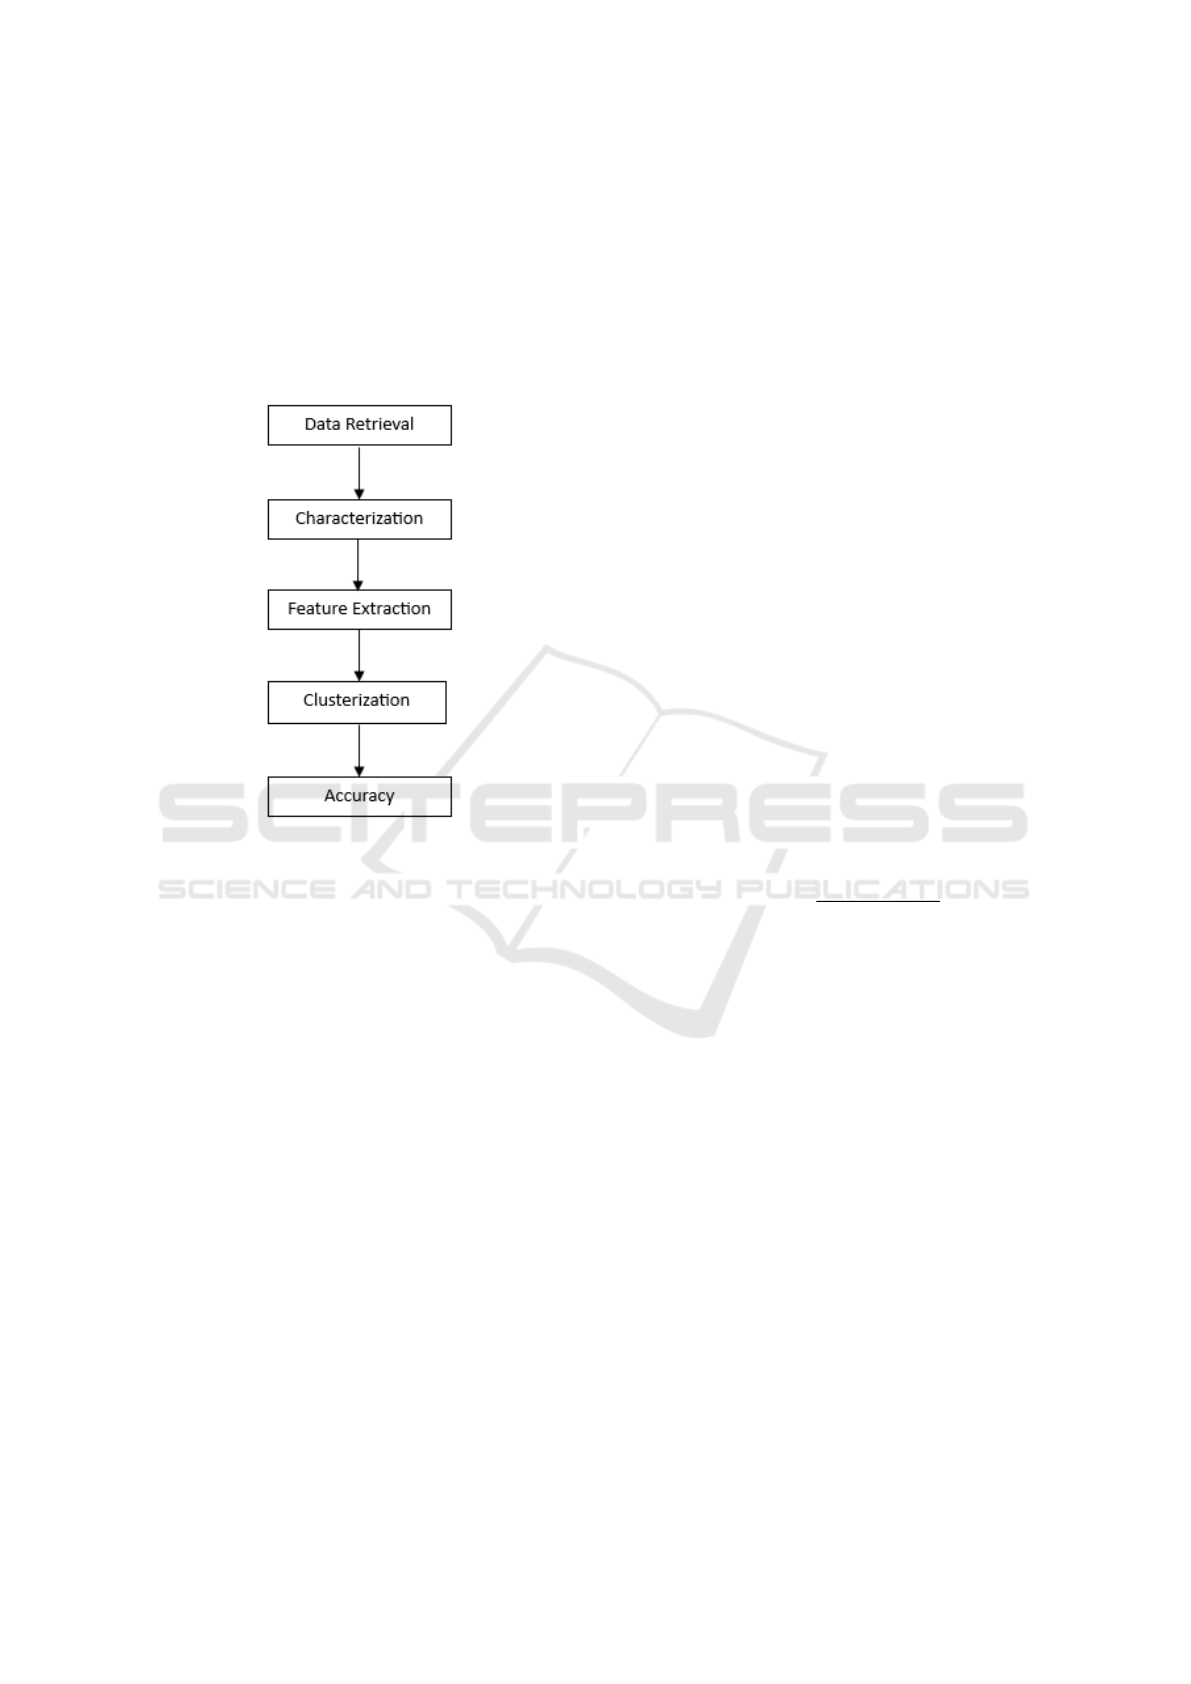
2.2 Machine Learning
The steps taken during the data processing began with
taking the ADC data obtained from the measurement
process directly using a non-invasive anemia detec-
tion tool, in the form of the resulting wavelength data.
Then the data is read by the system and characterized
by calculating the maximum value, standard devia-
tion, and average (mean) of each data to produce a
feature vector value. Furthermore, the feature extrac-
tion process was carried out using the PCA method to
reduce the number of variables (which were initially
very large) to fewer to facilitate analysis at a later
stage. The next step after feature extraction using the
PCA method is the clustering process. The clustering
Non-Invasive Anemia Detection Tool with Application of Mini Spectrometry Base Machine Learning
39
process was carried out using the FCM method, which
aims to determine the results of grouping anemic and
non-anemic data. After the data has been successfully
grouped, a testing process is carried out to determine
the accuracy of the system so that the results obtained
are accurate.
A block diagram of the data processing process is
shown in Figure 2.
Figure 2: Data Processing Process.
1. Data Sampling
Data sampling was carried out at the Muham-
madiyah Kendal Hospital with as many as 20 ane-
mic samples and 20 non-anemic samples. In one
patient five times data collection was carried out,
whereas in 1 retrieval 50 data will be taken so that
the total data taken in one patient is 250 data. The
sample data forms a matrix with a size of 250 rows
x 40 columns which will be used as input for the
time characterization domain.
2. Characterization
Characterization is the stage used to find the char-
acteristics of each signal. The results of the char-
acterization process are in the form of a feature or
ordinary matrix called a feature vector. Time do-
main characterization is done in a way that calcu-
lates the maximum value, standard deviation, and
average (mean) of each finite data. The feature
vector returns a value of 200 rows x 3 columns,
where data one-100 = anemia and data 101-200 =
non-anemia.
3. Feature Extraction Using Principal Component
Analysis (PCA) Method
Principal Component Analysis (PCA) is an algo-
rithm that is used to reduce or reduce data in-
formation but does not eliminate the information
contained in the data. The reason for using the
PCA method in the first data processing is because
the PCA method is a simple and easy method to
implement but produces great accuracy in the data
reduction process [10]. The function of PCA itself
is to reduce the number of variables (which were
initially very large) to become fewer to facilitate
analysis at a later stage. In the initial stages, the
data measured by the photo-NIR detector is char-
acterized by an n x m matrix, where n indicates the
amount of data and m indicates the characteristics
of the data. Next, the calculation of the average
difference value for each data is carried out, using
equation (1).
C =
n
∑
i=1
(x
i
− ¯x) (1)
After calculating the average difference value for
each data, then calculating the variance and co-
variance matrices of the sample data using equa-
tion (2).
σ
1
1 σ
1
2 ... σ
1
n
σ
2
1 σ
2
2 ... σ
2
n
... ... ... ...
σ
n
1 σ
n
2 ... σ
n
n
σ
i
j =
∑
j
i
(i −
¯
i)( j − ¯y)
n − 1
(2)
Next, the search for eigenvectors and eigenvalues
from the previously obtained covariance matrix is
carried out. The process of finding eigenvectors
and also eigenvalues using MATLAB, where if
the matrix A is square, and the eigenvalues are
x
n
x1 ̸= 0, then it is known that AX is a scalar
multiple of X. eigenvalues are scalars which when
multiplied by the column vector X is the same as
matrix A multiplied by the same column vector,
or can be defined by equation (3).
AX = λX (3)
The results of the eigenvectors that have been
obtained are then sorted from the largest to the
smallest value. After sorting, the eigenvector ta-
ble is then multiplied by the initial matrix so that
the PCA results are PC1, PC2, and PC3. In pro-
cessing this data, the PCA results taken were PC1
and PC2 had an eigenvalue of more than 1. The
data processing algorithm using PCA can be seen
in Figure 3.
ICAISD 2023 - International Conference on Advanced Information Scientific Development
40
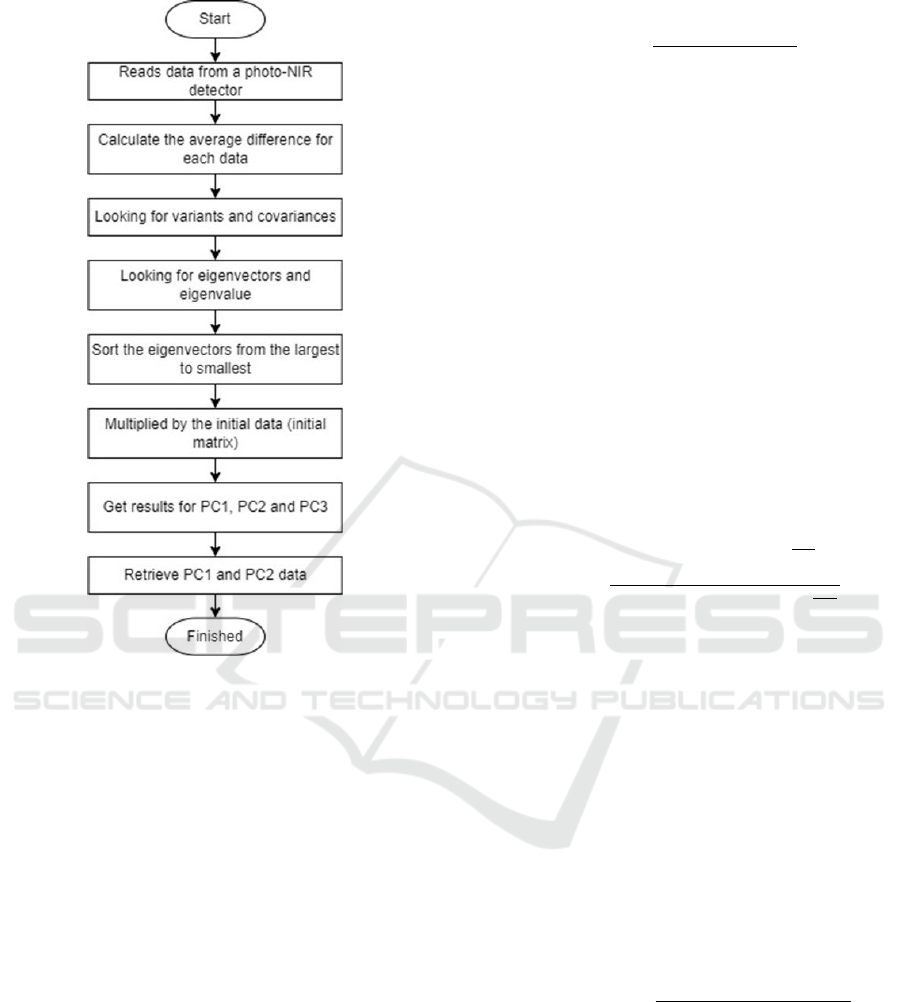
Figure 3: Data processing algorithm using PCA.
4. Clustering Using the Fuzzy C Means (FCM)
Method
The FCM algorithm is used for data clustering
after the data has been reduced using the PCA
method. The FCM algorithm process begins by
reading the data to be lustered in the form of an i
x j matrix, where i is the number of rows of data
and j is the number of columns of data. Next is to
determine the reference constant values to be used
such as the number of clusters (k), then the rank
(w), the maximum iteration (maxiter), the small-
est error (e), and the initial iteration (iter). The
value of this reference constant will determine the
number of iterations and the accuracy of the clus-
tering results. After determining the value of the
reference constant, the initial matrix U is formed
by randomly generating u
i
k numbers. In gener-
ating uik values, the rule is that the number of
numbers in one row must equal one. After that,
the cluster center value is calculates as described
in the V
k
jmatrix. V
k
jis known by using equation
(4).
V
k j
=
∑
n
i=1
((U
ik
)
w
(X
i j
))
∑
n
i=1
(U
ik
)
w
(4)
Then the objective function (P(iter)) is calculated
using equation (5).
P
iter
=
n
∑
i=1
c
∑
k=1
"
m
∑
j=1
X
i j
−V
k j
2
#
(U
ik
)
w
!
(5)
After P(iter) is determined, whether or not the
iteration continues is determined by two condi-
tions. The first requirement is that the iteration
must be more than or equal to the maximum iter-
ation value, otherwise the iteration will continue.
If so, it will proceed with checking for the sec-
ond condition, namely the difference in the value
of the objective function of the i-th iteration with
the (i-1) iteration must be less than or equal to the
smallest error. If not, then the iteration will con-
tinue. To continue the iteration, it is necessary to
update the u
i
k value. The u
i
k value is updated us-
ing equation (6).
U
ik
=
h
∑
m
j=1
X
i j
−V
k j
2
i
−1
w−1
∑
c
k=1
h
∑
m
j=1
X
ik
−V
k j
2
i
−1
w−1
(6)
If these two conditions are met properly, the itera-
tion is complete and the V
k
j matrix resulting from
the iteration will be used as the cluster center. So
that the data will be clustered based on its distance
to the canter of the V
k
jcluster. The data clustering
process using the FCM method is shown in Figure
4.
5. Testing
Testing on data processing begins with setting the
cluster center point each data, namely for the first
cluster center point is anemia and the second clus-
ter center point is non-anemic. The testing pro-
cess is then carried out by finding the distance be-
tween the first cluster and the second cluster in
each data using equation (7).
ClusterDistance =
q
(x
measures
−C1
x
)
2
+
y
measures
−C1
y
2
(7)
After calculating the cluster distance, the next step
is to find the value minimum distance between
cluster 1 (C1) and cluster 2 (C2). For anemia data
if the value minimum = cluster distance 1 then
the data can be said to be correct, while for non-
anemia data is said to be correct if the minimum
value = cluster distance 2. After knowing the cor-
rect amount of data, accurate calculations are car-
ried out from the results of data processing that
has been done using the formula equation (8).
Non-Invasive Anemia Detection Tool with Application of Mini Spectrometry Base Machine Learning
41
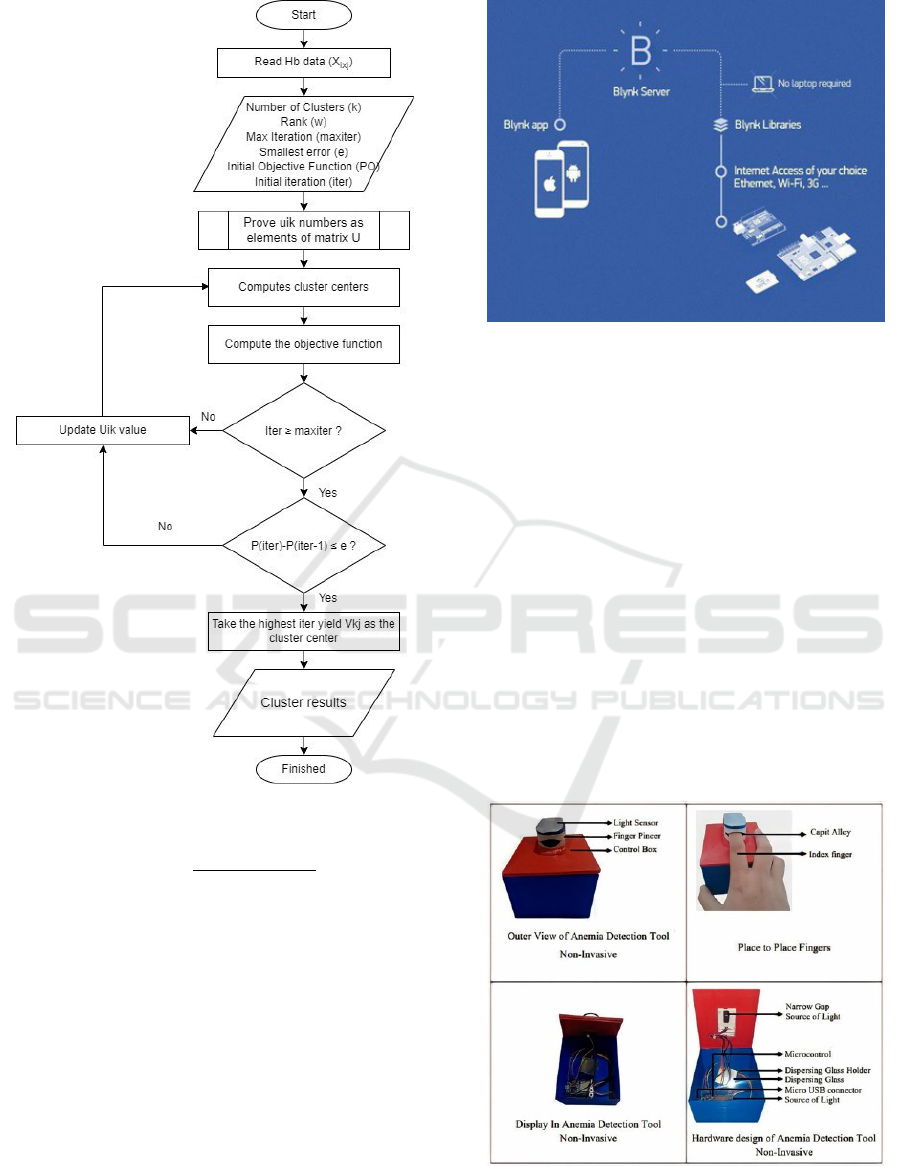
Figure 4: Data clustering process using the FCM method.
Accuracy =
Correctamount
Totalnumber
× 100 (8)
2.3 Blynk IoT
Blynk is an IoT platform that is used to remotely con-
trol hardware, display sensor data, store data, and vi-
sualize it using iOS and Android applications (Sep-
tiana et al., 2018). Several types of microcontrollers
are compatible with Blynk IoT such as NodeMCU
ESP8266, Arduino, Rasberry Pi, and ESP32 via the
Internet (Utari et al., 2019). Blynk IoT consists of
several main components, this is shown in Figure 5.
1. Blynk App: used to control hardware and display
data on widgets.
2. Blynk Server: this is a storage service that is re-
sponsible for all the relationships between appli-
Figure 5: Blynk IoT components.
cations and hardware.
3. Blynk Libraries: This includes various widgets
such as control buttons, display formats, notifica-
tions and time management that allow hardware
to send data obtained from sensors to be displayed
on applications effectively.
3 RESULT
3.1 Hardware Design
After the process of designing the system, making the
toll, testing and also repairing the tool that was devel-
oped, the following is a display of the implementation
of the tool that has been made. The display of tool im-
plementation is shown in Figure 6.
Figure 6: Display of tool implementation.
ICAISD 2023 - International Conference on Advanced Information Scientific Development
42

3.2 Machine Learning
1. Data sampling
Table 1: Anemia sample data.
No. Number of Patient with Hb Levels
1. 4 2 3 2 2 2 . . . 1
2. 7 6 5 5 5 5 . . . 2
3. 16 10 5 6 6 6 . . . 5
4. 18 10 11 13 13 13 . . . 7
5. 21 10 12 14 14 14 . . . 7
. . . . . . . . . .
. . . . . . . . . .
. . . . . . . . .
250. 42 46 46 43 43 43 . . . 45
Table 2: Non-Anemia sample data.
No. Number of Patient with Hb Levels
1. 5 6 5 6 5 5 . . . 5
2. 5 13 12 7 9 6 . . . 12
3. 6 14 15 9 13 8 . . . 15
4. 10 16 18 12 17 15 . . . 17
5. 10 17 19 15 21 16 . . . 20
. . . . . . . . . .
. . . . . . . . . .
. . . . . . . . .
250. 55 52 46 55 56 47 . . . 53
Based on Table 1 and Table 2, analogous data
were found on the results of anemia measure-
ments in anemic patients and also in non-anemic
patients who had been carried out.
2. Characterization
Table 3: Vector feature values.
Data Maximum Standard Deviation Mean
1 19,06 27,24 48,20
2 21,33 19,46 48,80
3 19,20 26,22 48,80
4 18,78 27,36 48,00
5 16,02 20,66 42,60
. . . .
. . . .
. . . .
100 21,46 24,98 61,20
101 16,47 22,30 45,60
102 20,76 16,04 52,20
103 14,89 24,14 47,20
104 17,05 23,86 44,80
105 17,46 22,80 43,80
. . . .
. . . .
. . . .
200 17,46 22,80 43,80
Table 3 shows the result of the characterization
process, namely the value of the feature vec-
tor. Each data will be searched for the maximum
value, standard deviation and average value. Data
1-100 are data taken from anemic patients, while
data 101-200 are data taken from non-anemic pa-
tients.
3. Feature Extraction Using Principal Component
Analysis (PCA) Method
Feature extraction will be carried out using fea-
ture vector data measuring 200 rows x 3 columns
as shown in Table 3. Where the data will be ex-
tracted using PCA features using Matlab to find
the eigen values which have been sorted from the
largest number as in Table 4 and the eigen vector
values which are sorted according to the order of
the eigen values as shown in Table 5.
Table 4: Eigen values.
Eigen Values
112,5291
16,9215
1,1329
Table 5: Eigen vector.
Eigen Vector
0,8833 -0,3162 -0,3462
0,3112 -0,1570 0,9373
0,3507 0,9356 0,0403
The matrix values of the eigen vectors are then
multiplied by the transpose of the initial matrix
which measures 200 rows x 3 columns to pro-
duce the Principal Component (PC) as shown in
Table 6, with 1-100 anemic data and 101-200 non-
anemic data.
Table 6: Principal Component.
Data PC1 Ekstraksi
PCA PC2
PC3
1 2,9189920 3,7818193 0,8478797
2 1,4286449 -4,0443551 2,4594854
3 3,1339610 2,6162275 0,7277167
4 2,6967718 4,0015579 0,6579699
5 -5,2803313 -0,1259826 -0,3266830
. . . .
. . . .
. . . .
100 14,3562939 -2,8171040 -1,4957786
101 -1,9160600 0,3886640 -0,8788068
102 3,0524977 -8,2283799 0,6027757
103 -0,3493570 1,8525220 -2,8399143
104 -1,8936031 2,0093340 0,0091286
105 -3,0207303 1,2692095 0,6978164
. . . .
. . . .
. . . .
200 -3,0207303 1,2692095 0,6978164
4. Clustering Using the Fuzzy C Means (FCM)
Method
The result of the FCM classification is in the form
of a cluster center point, where there are 2 cluster
Non-Invasive Anemia Detection Tool with Application of Mini Spectrometry Base Machine Learning
43
center points, namely cluster 1 center point (non-
Anemia) and cluster 2 center point (Anemia).
Where is the center point of cluster 1 (c1x,c1y)
and the center point of cluster 2 (c2x,c2y) as
shown in Table 7.
Table 7: FCM classification results.
Cluster Center Point
# X Y
1 -0,5593 1,95906
2 1,25848 -6,5747
Based on the cluster center point that has been ob-
tained. It is known that the cluster 1 center point
is the non- anemia data center point and the clus-
ter 2 center point is the anemia data center point.
Therefore, the PC value of non-anemia data must
be close to the cluster 1 center point and the PC
value of anemia data must be close to the cluster
2 center point. If not, the data is declared wrong.
5. Testing
Table 8 shows the correct amount of data for each
anemic and non-anemia data based on the results
of calculating the minimum distance values in
cluster 1 and cluster 2 for each data. Of the 100
anemia data, there are 10 incorrect data and 90
correct data. In non-anemic data, there are 14 in-
correct data and 86 correct data.
So the total correct data from all data, both anemia
data and non-anemia data, is 176 out of 200 data,
and the accuracy obtained from this tool is 88%.
The results in table 8 are the result of the previous
process, where anemia data must be close to the
cluster 2 center point and non-anemia data must
be close to the cluster 1 center point. If not, the
data is said to be wrong. The amount of data pro-
cessed is 200, of which 100 are anemia data and
100 are non-anemic data.
Table 8: Accuracy of data processing anemia detection tool.
Patient Data Accuracy
Amount of
Data
Correct
Data
Incorrect
Data
Anemia 100 data 90 data 10 data 3*88%
Non-Anemia 100 data 86 data 14 data
Total 200 data 176 data 24 data
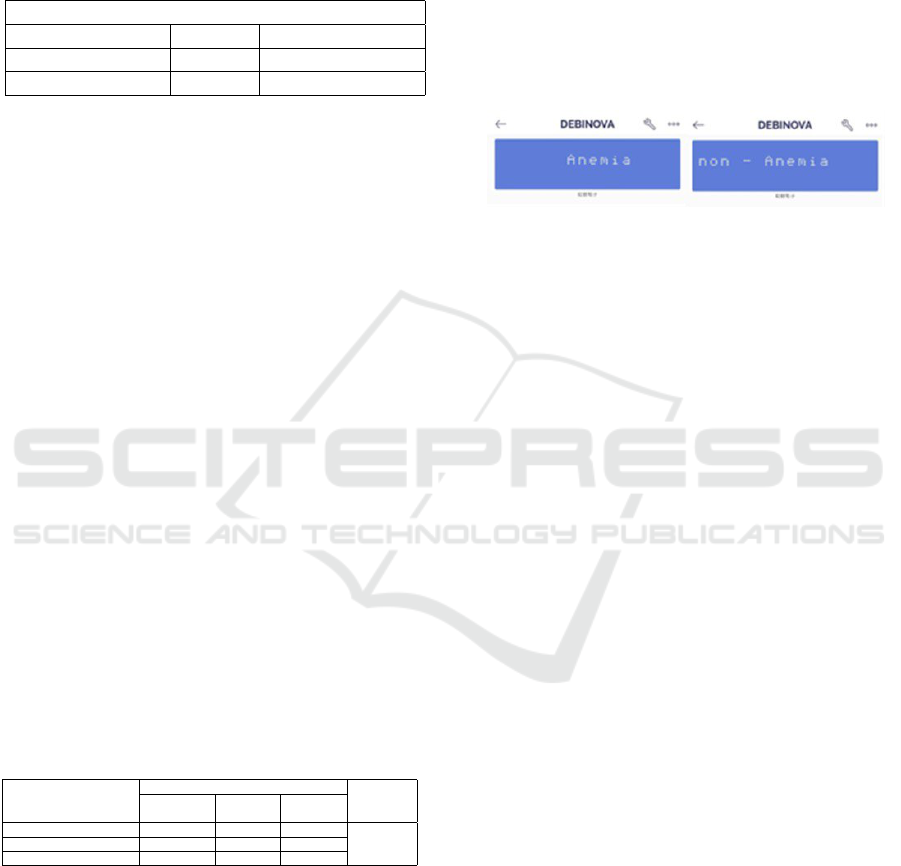
3.3 Blynk IoT
The program code is written using Arduino IDE
1.8.19 environment, this code starts to pre-
pare the necessary library for the ESP32 mod-
ule <ESP32Servo.h> and Blynk application
<BlynkSimpleEsp32.h>. The anemia detection
result signal is read through the ESP32 pin IO26.
The patient’s index finger should be placed so that
it touches the tip of the available finger slot. The
ESP32 microcontroller processes data by converting
analog data to digital information using Analog to
digital conversion. The ESP32 module connects to
the internet hotspot using the same hotspot name
(SSID) and (PASSWORD) and then sends data to
the Blynk application platform. The Blynk IoT
application receives data through a virtual channel
(V5) to be displayed so that it can be seen by users
on their smartphones as shown in Figure 7.
Figure 7: Anemia detection results on the Blynk Applica-
tion.
4 DISCUSSION
The tool designed is a noninvasive anemia detection
tool using the working principle of mini spectrom-
etry as an option in the anemia detection process.
This is because the currently circulating anemia de-
tection devices still use invasive methods. This tool
works by reading the wavelength of the transmitted
light. The less light that is transmitted and captured
by the photo-NIR detector after passing through the
patient’s finger, it is written that the patient is classi-
fied as anemic, conversely if more light is transmit-
ted and captured by the photo-NIR detector, the pa-
tient is included in a non-anemia patient. Because the
finger of an anemic patient will absorb more emitted
light so that the light that is transmitted is less. In-
versely proportional to the finger of a non-anemic pa-
tient (Ningsih et al., 2019).
Many systems have been proposed for an anemia
detection system, but until now the anemia detection
process still uses blood samples. Even though the
blood sampling is small, if it is necessary to do it
repeatedly, it still causes discomfort for the patient
(Septiana et al., 2018). In addition, the anemia de-
tection system is carried out by recognizing images
of patient blood samples (Utari et al., 2019). Because
the tool used still uses blood samples, we made a non-
invasive anemia detection tool without the need for
blood samples in the detection process.
To improve this research, in the future the authors
can develop this tool as a Hb monitoring tool that is
equipped with an alarm so that medical personnel can
provide faster treatment if a patient is detected with
a drastic decrease in Hb. This tool will be a new de-
ICAISD 2023 - International Conference on Advanced Information Scientific Development
44

velopment and produce a sophisticated tool in dealing
with cases of anemia.
5 CONCLUSIONS
This study aims to implement an anemia detection
system using the working principle of mini spectrom-
etry with the PCA data processing method and data
clustering using the FCM method. This tool was cre-
ated to be the tool of choice in the process of non-
invasive detection of anemia.
The results obtained from the manufacture of this
anemia detection system are that this tool can distin-
guish anemic patients from non-anemic patients with
an accuracy of 88%. This tool is very useful in the
process of detecting anemia, which was previously
done with invasive methods now in this tool detection
of anemia is done with non- invasive methods to re-
duce the prevalence of anemia. To improve research,
this tool can be further developed as an Hb monitoring
tool.
ACKNOWLEDGEMENTS
The author would like to thank the Muhammadiyah
Kendal Hospital for giving the author permission to
take samples at the hospital. Respondents who are
willing to carry out the detection process with our tool
and parties who play a direct role in designing this
anemia detection tool.
REFERENCES
Agustina, A., Anam, K., and Bulan, S. (2022). Fabri-
cation of spectro-animation as a learning media to
improve student understanding on bohr’s concept of
atomic structure. Inovasi-Jurnal Diklat Keagamaan,
16:136–149.
Bernecker, C., K
¨
ofeler, H., Pabst, G., Tr
¨
otzm
¨
uller, M.,
Kolb, D., Strohmayer, K., Trajanoski, S., Holzapfel,
G., Schlenke, P., and Dorn, I. (2019). Cholesterol de-
ficiency causes impaired osmotic stability of cultured
red blood cells. Frontiers in Physiology, 10.
Dervieux, E., Bodinier, Q., Uhring, W., and Th
´
eron, M.
(2020). Measuring hemoglobin spectra: searching for
carbamino-hemoglobin. Journal of Biomedical Op-
tics, 25.
Hasan, D. and Ismaeel, A. (2020). Designing ecg moni-
toring healthcare system based on internet of things
blynk application. Journal of Applied Science and
Technology Trends, 1:106–111.
Morscher, S., Driessen, W., Claussen, J., and Burton, N.
(2014). Semi-quantitative multispectral optoacoustic
tomography (msot) for volumetric pk imaging of gas-
tric emptying. Photoacoustics, 2:103–110.
Mumtazmi, N., Bulan, R., and Munawar, A. (2022). Anali-
sis karakteristik spektrum tanah berbasis near infrared
spectroscopy (analysis of soil spectrum characteristics
based on near infrared spectroscopy. Jurnal Ilmiah
Mahasiswa Pertanian, 7.
Nasruddin, H., Syamsu, R., and Permatasari, D. (2021).
Angka kejadian anemia pada remaja di indonesia. Ju-
rnal Ilmiah Indonesia, 1:357–364.
Nidianti, E., Nugraha, G., Aulia, I., Syadzila, S., Suciati, S.,
and Utami, N. (2019). Pemeriksaan kadar hemoglobin
dengan metode poct (point of care testing) sebagai de-
teksi dini penyakit anemia bagi masyarakat desa sum-
bersono, mojokerto. Jurnal Surya Masyarakat, 2:29.
Ningsih, E., Fajrin, H., and Fitriyah, A. (2019). Pendeteksi
hemoglobin non invasive. Medika Teknika : Jurnal
Teknik Elektromedik Indonesia, 1:10 18196 010102.
Septiana, E., Peningkatan, P., Pengenalan, A., Pane, E.,
Wibawa, A., and Purnomo, M. (2018). Peningkatan
akurasi pengenalan emosi pada sinyal electroen-
cephalograpy menggunakan multiclass fisher discrim-
inant analysis.
Sholikhah, A., Mustar, Y. S., and Hariyanto, A. (2021).
Anemia di kalangan mahasiswi: Prevalensi dan kai-
tannya dengan prestasi akademik. Medical Technol-
ogy and Public Health Journal, 5(1):8–18.
Utari, E., Listyalina, L., and Puspaningtyas, D. (2019).
Aplikasi self-organizing mapping sebagai alat deteksi
anemia pada citra sel darah merah. Jurnal Gizi Klinik
Indonesia, 16:64.
Non-Invasive Anemia Detection Tool with Application of Mini Spectrometry Base Machine Learning
45
