
Bandwidth Management Analysis Using Proxy Server-Based Method
Virtual Machine
Abdul Gafur
1
, Suherman
2
and Sawaluddin
3
1
Master of Informatics Program, Universitas Sumatera Utara, Medan, Indonesia
2
Electrical Engineering Department, Universitas Sumatera Utara, Medan, Indonesia
3
Department of Mathematics, Universitas Sumatera Utara, Medan, Indonesia
Keywords:
Bandwidth Management Analysis, Proxy Server-Based Method, Virtual Machine.
Abstract:
Bandwidth is the most important part of internet network traffic. High bandwidth traffic results in slow internet
access. This happens because internet users are increasing rapidly due to shifting habits in the technological
era where everyone uses the internet in every activity meaning communication, business, and learning as well
as expensive infrastructure to build proxy servers and bandwidth management. This problem arises within
the Faculty of Medicine, Islamic University of North Sumatra in the lecture process because students often
access streaming services in the lecture process which makes bandwidth consumption greater. The steps taken
in overcoming this problem are to build a proxy cache and bandwidth management with the Per Connection
Queue (PCQ) algorithm. The analysis was carried out using the Wireshark application based on Quality of
Service (QoS) parameters of throughput, delay, jitter, packet loss, and efficiency as well as time differences.
The test was carried out by accessing the youtube, dikti, and Facebook pages at peak times. Based on the
analysis carried out, shows that there is a decrease in traffic and increased efficiency by up to 58.02analysis
using Wireshark were carried out by monitoring the density experienced when searching so as to produce
values in the Throughput QoS Parameter of 1982k, Packet loss of 0.0of 0.0063 and total jitter -0.00328 with
an average jitter of -0.00021.
1 INTRODUCTION
Developments in the world of technology make the
need for internet access very high. Even today, the in-
ternet has been considered a basic necessity for both
personal and business in supporting work and infor-
mation exchange media (Akmala, 2019).
The COVID-19 pandemic has had a huge impact
on internet usage around the world. Due to social
distancing and remote work orders, many people are
forced to use the internet for various activities such
as working, studying, and communicating. Accord-
ing to data from the Central Statistics Agency (BPS)
in 2021, the percentage of Indonesians who use the
internet is 62.10% in 2021 (Statistik, 2021). This in-
crease is driven by factors such as increased acces-
sibility and more affordable prices of technological
devices such as computers and smartphones, as well
as increased availability of internet networks both in
cities and in rural areas. This is inseparable from
the government’s efforts to increase the accessibility
and availability of the internet network throughout In-
donesia. Meanwhile, according to data from We Are
Social and Hootsuite in 2022 (Social, 2022), . there
has been an increase in the time spent by internet users
every day, the average time spent by internet users ev-
ery day is about 6 hours and 37 minutes. And the
most popular online activities in Indonesia are watch-
ing videos, browsing, and social media where this ac-
tivity results in the use of large bandwidth, causing
high traffic.
Currently, the Faculty of Medicine, Islamic Uni-
versity of North Sumatra (FK-UISU) is experiencing
high network traffic caused by the increasing use of
the internet in the teaching and learning process in the
campus environment. On the other hand, the frequent
access to video streaming services, video conferenc-
ing, and social media turned out to be a lot of burden
on the bandwidth of the faculty’s internet network, re-
sulting in campus services that use internet access be-
ing hampered. The way that can be taken in reducing
network performance decline is by doing bandwidth
management and proxy servers with cache features
in helping to ease large bandwidth loads (Tanwir and
118
Gafur, A., Suherman, . and Sawaluddin, .
Bandwidth Management Analysis Using Proxy Server-Based Method Virtual Machine.
DOI: 10.5220/0012444700003848
Paper published under CC license (CC BY-NC-ND 4.0)
In Proceedings of the 3rd International Conference on Advanced Information Scientific Development (ICAISD 2023), pages 118-125
ISBN: 978-989-758-678-1
Proceedings Copyright © 2024 by SCITEPRESS – Science and Technology Publications, Lda.

Affandi, 2017). On the other hand, expensive infras-
tructure and devices are obstacles in providing server
services in managing bandwidth and proxy caches. A
virtual machine can be used in setting up and man-
aging bandwidth and cache at a fraction of the cost
(Mohammad, 2021).
Based on the above background, to overcome the
large bandwidth consumption load, a bandwidth man-
agement mechanism, and proxy cache are needed to
help reduce the bandwidth consumption load in the
UISU medical school environment. The method pro-
posed in this study is to use a virtual machine-based
proxy server in optimizing stable, structured, and ef-
fective internet access to all clients.
2 LITERATURE REVIEW
2.1 Bandwidth Management
Bandwidth is a quantity to indicate how much data
can be passed in a connection over a network (Nasir
and Andrianto, 2018). Bandwidth is also called band-
width or information channel capacity, which is the
maximum ability of a tool to transmit information in
units of time (Eko, 2017). It is usually denoted as bits
per second (bps), or by some larger denomination of
bits, such as Megabits per second (Mbps) or Kilobits
per second (Kbps). It is now common for the word
bandwidth to be used more to measure digital data
streams (Iqbal and Tambunan, 2021).
2.2 Per Connection Queue (PCQ)
The Per Connection Queue (PCQ) algorithm is an al-
gorithm used for a large number of clients, this algo-
rithm adjusts the number of clients (Rifai, 2017). In
the Mikrotik operating system, the PCQ method is a
program to manage network traffic on Quality of Ser-
vice (QoS) (Kusbandono and Syafitri, 2019). Band-
width management that can be used or applied to the
client is the PCQ method. PCQ is used for bandwidth
management to improve system performance. PCQ
shares the bandwidth from the ISP with all users us-
ing the network at the same time. Each sub-queue has
a data rate limit based on PCQ and PCQ packet limit
(D. Iswadi and Munadi, 2019). The total size of the
PCQ queue should be smaller than the total limiting
PCQ packet how PCQ works with PCQ-rate parame-
ter = 0.
Figure 1: How PCQ Works.
2.3 Simple Queue
Simple Queue is a simple way to limit bandwidth
based on the client’s IP address, either download or
upload bandwidth. the simple queue is a queuing
technology in the bandwidth management system on
the proxy router. This queuing technique can be eas-
ily configured, and bandwidth allocation is the sim-
plest among other methods used to perform band-
width management (Arya, 2020).
2.4 Mikrotik
Mikrotik is an operating system specialized in han-
dling routing on computer networks (T. Rahman and
Nurdin, 2020). Mikrotik router is a hardware router
made by Mikrotik that runs the RouterOS system.
Mikrotik can be used as a Firewall, Routing, Hotspot
for plug-and-play access, remote Winbox GUI, and
Virtual Private Network (VPN) Mikrotik RouterOS
bandwidth type simple queue can control the through-
put or upload and download rate of each client on the
network (Ayubih and Kuswanto, 2021).
2.5 Quality of Service
Quality of Service is the ability to describe a level
of achievement in a data communication system
(Sarmah and Sarma, 2019). Quality of Service is
a network mechanism that allows an application or
service to operate on an implementation basis. The
goal of Quality of Service (QoS) is to use the same
infrastructure to meet different service requirements
(Jang and Lin, 2017). Performance refers to the speed
and reliability of sending different types of data loads
in communication. The following are some QoS pa-
rameters that are often used to measure network per-
formance, namely Throughput, Packet loss, Delay,
and Jitter (M. C. Breaban and Balan, 2018) (Wisesa,
2018).
2.6 Throughput
Throughput is the actual bandwidth measured at any
given time to transfer data. Unlike bandwidth, al-
though the unit is equal to bps, throughput also rep-
resents the actual bandwidth at a time and on certain
Bandwidth Management Analysis Using Proxy Server-Based Method Virtual Machine
119

conditions and networks used to download a file of a
certain size (Mukti and Dasmen, 2019). Throughput
can be divided into four categories according to the
TIPHON version (D. Iswadi and Munadi, 2019).
Table 1: Troughput.
Throughput Throughput Table of
Categories Contents
Perfect 100% 4
Good 75% 3
Medium 50% 2
Poor <25% 1
2.7 Packet Loss
Packet loss is a parameter used to describe a situa-
tion that represents the total number of packets lost
that may occur due to collisions and congestion on the
network . Collision and congestion will affect all ap-
plications, even if the bandwidth is sufficient for the
application. The packet loss value according to the
TIPHON version is divided into four parts (D. Iswadi
and Munadi, 2019).
Table 2: Packet Loss.
Relegation Packet Index
Categories Loss
Perfect 0% 4
Good 3% 3
Medium 15% 2
Bad <25% 1
2.8 Delay
Delay is the time it takes to send data packets from
one computer to another. Delays in the process of
sending data packets on a computer network can be
caused by long queues or the use of other routes to
avoid route congestion (Sari and Sukri, 2018). De-
lays can be affected by distance, physical media, con-
gestion, or long processing times. According to the
TIPHON version, the magnitude of the delay can be
classified (D. Iswadi and Munadi, 2019).
2.9 Jitter
Jitter or delay variation is a change in delay or differ-
ence between the first delay and the subsequent delay.
If the transmission delay changes too much, it will af-
fect the quality of the transmitted data. Jitter is a data
packet delay known as QoS which is very important,
Table 3: Delay.
Latency Delay Index
Category Amount
Perfect ¡150 ms 4
Good 150 – 300 ms 3
Medium 300 – 450 ms 2
Poor >450 ms 1
especially for real-time applications. There are four
categories of network performance reduction based
on jitter magnitude values according to the TIPHON
version (D. Iswadi and Munadi, 2019).
Table 4: Jitter.
Categories Jitter Index
Jitter Magnitude
Perfect < 0 ms 4
Good 0 – 75 ms 3
Medium 75 – 125 ms 2
Poor 125 – 225 ms 1
2.10 Wireshark
Wireshark is a software application used to be able
to view and try to capture network packets and try to
display all the information in the package in as much
detail as possible. Open Source from Wireshark us-
ing Graphical User Interface (GUI) (S. Sandhya and
Deep, 2017). Wireshark is used to view, capture,
and analyze data packets to help troubleshoot wireless
network administrators. It can also help capture traf-
fic from the air and decrypt it into a format that helps
administrators to track down issues causing poor per-
formance, and intermittent connectivity using appro-
priate driver support (Jain and Anubha, 2021).
2.11 Squid
Squid is a high-performance proxy caching server for
web clients, which already supports FTP, gopher, and
HTTP data objects. Unlike the old caching software,
squid handles all nonblocking single requests and I/O-
driven processes. Squid supports SSL, lots of access
control, and full request logging (Wahyudi, 2017).
2.12 Virtual Machine (VM)
A virtual machine (VM) is a software engineer that
has the same functions as a physical computer. The
VM is a standalone operating environment that be-
haves as if it were a separate computer (Amarudin and
Yuliansyah, 2018). There are so many popular vir-
ICAISD 2023 - International Conference on Advanced Information Scientific Development
120
tualization technologies available such as VMWare,
VirtualBox, Parallels, QEMU, UML, and Xen (Naik,
2016).
3 METHOD
This research was conducted by bandwidth man-
agement using a virtual machine-based proxy server
method in optimizing bandwidth. The flow of this
study is presented in Figure 2.
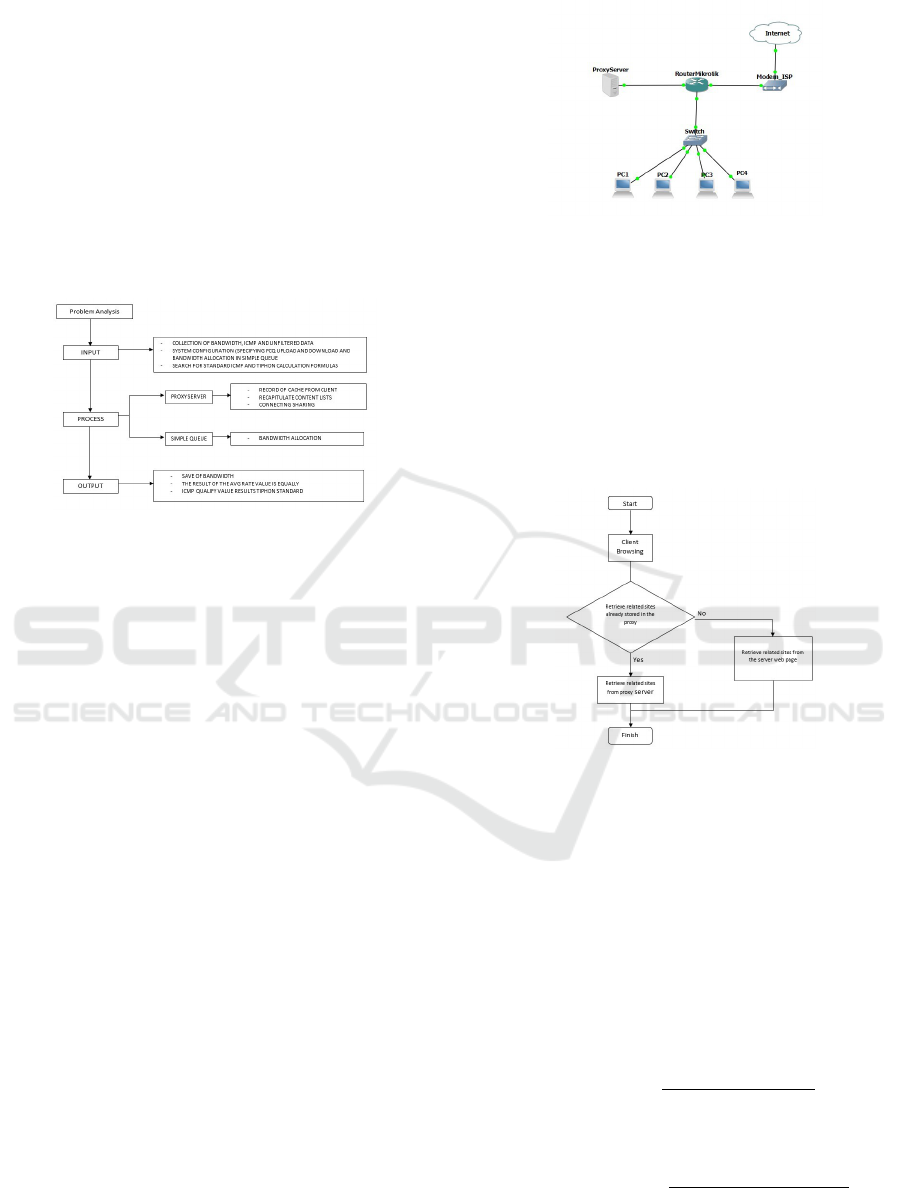
Figure 2: Research Flow Chart.
In Figure 2. There is a research flow chart which
is an illustration of the research carried out along with
an explanation of the research flow chart. The inter-
relationships of problem analysis, inputs, processes,
and outputs lie at the time of the process Optimizing
proxy server and simple queue methods. In the in-
put process, unfiltered data collection is carried out,
and configures the system using the Per Connection
Queue (PCQ) algorithm which determines pcq upload
and download and allocates bandwidth in a simple
queue. In the process of research flowchart, the proxy
server functions as a connection sharing, recording
the cache of the client and recapitulating the list of
content to be created.
The output results will be proven using the avg
rate parameter as well as using the Internet Con-
trol Message Protocol (ICMP) packet parameters
throughput, delay, jitter, and packet loss. Provides
effective bandwidth management improvements by
meeting TIPHON value standards and saving avail-
able bandwidth on the UISU Faculty of Medicine
campus.
The process in this study was carried out by build-
ing an external proxy server based on a virtual ma-
chine using the Debian operating system and Mikrotik
routers as a Quality of Service (QoS) using the PCQ
algorithm which is in apply it to a simple queue. The
topology used in this study is presented in Figure 3.
Bandwidth Management is a method used to man-
age and optimize various types of QoS (Quality of
Service) to determine various types of existing net-
Figure 3: Topology.
work traffic. The proxy server is connection sharing
and caches the client. There is also a proxy caching
that will be done, namely, the browsing client com-
puter will be processed to the proxy to retrieve the re-
lated site that has been saved if the related site is not
in the proxy then it will be in the process of directly
fetching from the web server page, if the related site
is already on the proxy server then it can be directly
retrieved and then finished. As presented in Figure 4.
Figure 4: Flowchart Caching Proxy.
The analysis in this study was carried out based
on the following TX / RX speed test data and avg
rate values from Mikrotik OS in the queue, Traffic
type data and the most frequently accessed by clients,
Data results from Internet Control Message Protocol
such as throughput, delay, jitter, and packet loss.
The analysis was performed using the Wireshark
application based on the standard formula of the
ICMP packet itself. The formula is as follows:
• Throughput
T hroughput =
Packet data sent
Data delivery time
X8 (1)
• Delay
Average delay =
Total Delay
Total packets received
(2)
• Jitter
Judging from the variation in the time delay in the
Bandwidth Management Analysis Using Proxy Server-Based Method Virtual Machine
121
Command Line Interface where the delay value
from time 1 to the following time is stable.
• Packet Loss
Packet loss = (Datasent − Datareceived)x100%
(3)
• Efficiency and Time Difference
The analysis in this study was carried out based
on the following TX / RX speed test data and avg
rate values from Mikrotik OS in the queue, Traf-
fic type data and the most frequently accessed by
clients, Data results from Internet Control Mes-
sage Protocol:
E f =
(Be f ore cache − A f ter cache)
Be f ore cache
x100%
Di f f erence = (Be f orecacheA f tercache)
(4)
4 SIMULATION AND RESULTS
4.1 Proxy Server Configuration
This research was conducted by building a virtual
machine-based proxy server by implementing the
squid3 application and the Debian operating system
with a memory capacity of 4 GB as a connection
sharing and storing cache from the client. The proxy
cache configuration is presented in Figure 5.
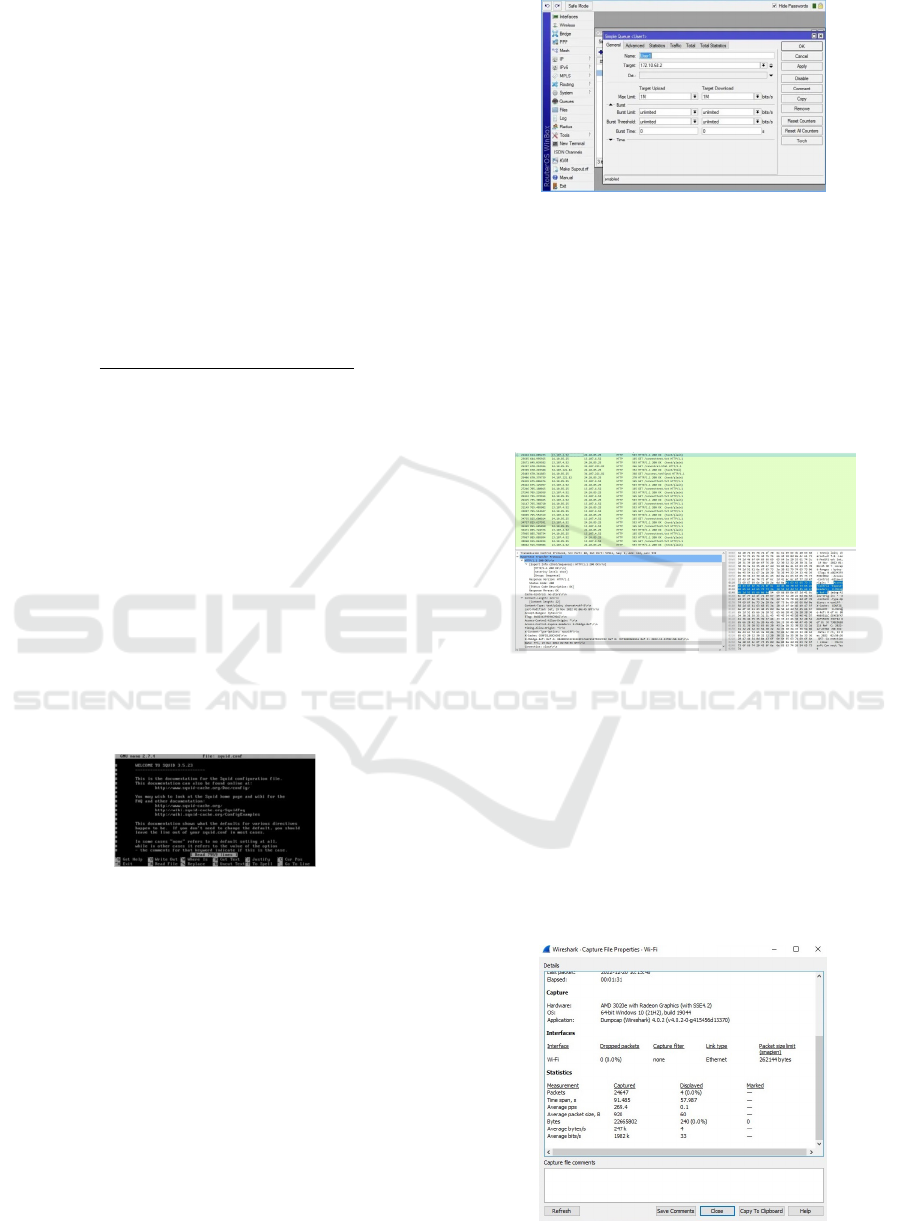
Figure 5: Configuring a Proxy Server with Squid3.
4.2 PCQ Configuration
Meanwhile, bandwidth management is carried out us-
ing a Mikrotik router using the PCQ algorithm. Band-
width allocation is accomplished by using a Queue
List. In the Queue List we select the simple queue
tab, then click + (Add) Before starting to limit internet
bandwidth with Mikrotik, first make sure how much
Internet bandwidth you get from the ISP you are us-
ing. So that later the Bandwidth value that is limited
does not exceed the Bandwidth allocation from the
ISP, and provides limitations to other users in accor-
dance with the Target-Address as happened in Figure
6.
Figure 6: Target queue list.
4.3 Analyze with Wireshark
After configuring the proxy server and bandwidth
management, an analysis is then carried out using the
Wireshark application to monitor data communica-
tion that can be seen from sources and destinations
that always exchange places with the protocol used as
shown in Figure 7.
Figure 7: Analyze with Wireshark.
Testing and analysis were performed using Qos
Throughput parameters, QOS Packet Loss Param-
eters, QOS Delay Parameters, and QOS Jitter Pa-
rameters. In the Troughtput QoS Parameter, testing
was carried out by accessing the youtube page where
the result of the Number of Bytes: Time Span was
247.75429851888 b, then multiplied by the Bytes Re-
sult where 8 is the Byte count, and resulting in 1982k
which is well categorized in the Tiphon formula. The
QoS Throughput catch is presented in Figure 8.
Figure 8: Capture File Throughput.
ICAISD 2023 - International Conference on Advanced Information Scientific Development
122
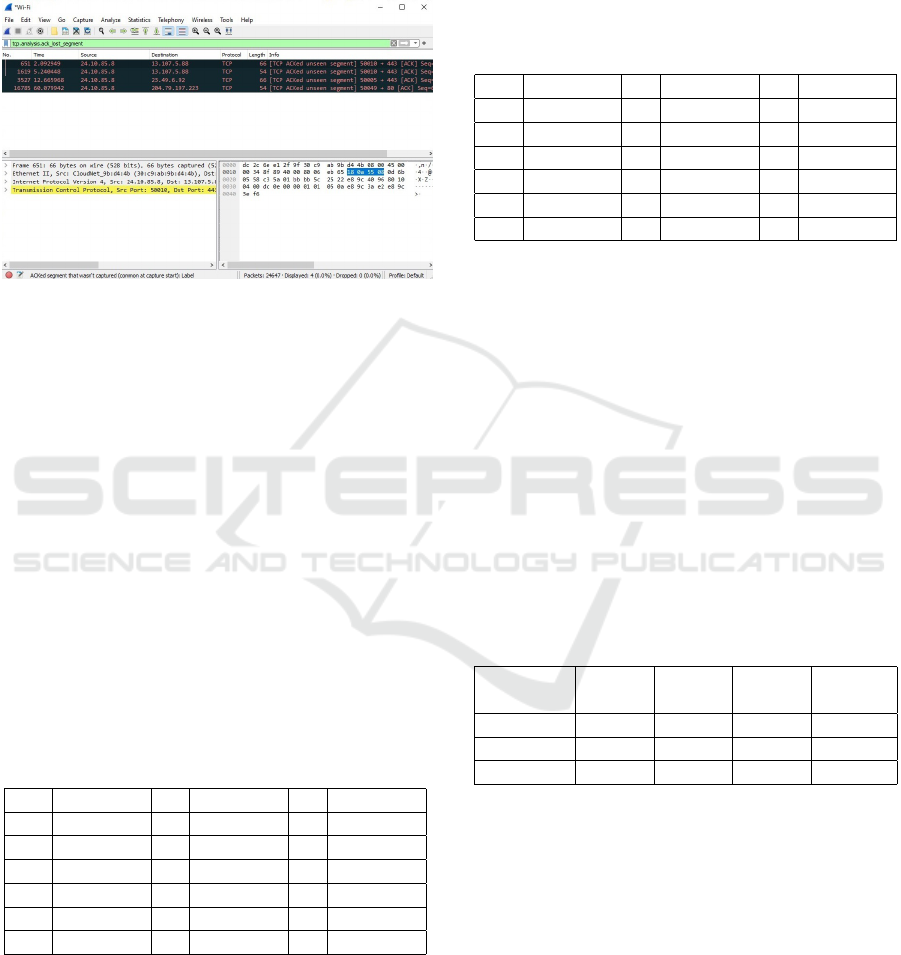
The next analysis is carried out based on the QOS
Packet Loss Parameter. A parameter used to describe
a situation that represents the total number of packet
losses that may occur due to collision and congestion
in the network of packet loss on 4 packet loss.
Figure 9: Capture Packet Loss.
Based on the analysis carried out through the
results in Figure 9, it is stated:
Packet loss :
Packet sent - Packet received:Packet sent *100
= (24647-24644):24647)*100
= (3:24644)*100
= 4 (0.0%)
In analyzing packet loss from the test results us-
ing Youtube states where the number of packets sent
– packets received divided by packets sent times 100
and based on the test results (0.0formula. The analy-
sis was carried out using a sample of 23 of 2501 to-
tal delays based on the capture of network traffic that
was carried out so as to find the total delay to deter-
mine the total jitter of the delay obtained. The delay
analysis obtained is presented in Table 5.
Table 5: Total QoS Delay.
No Time ... Delay ... Delay2
1 0 ... 0.000393 ... -0.00564
2 0.000393 ... 0.003677 ... 0.009011
3 0.00407 ... 0.009315 ... -0.00112
4 0.013385 ... 0.000304 ... -0.00417
... ... ... ... ... ...
23 0.076403 ... 0.00521 ... 0.006815
In Table 5, time1-time2 will produce a delay of 1,
from a delay of 1 minus a delay of 2, from a total delay
of 2501 delays resulting in a total delay of 15.925747
with an average delay of 0.0063.
The next analysis is carried out based on Jitter pa-
rameters by looking at the change in delay or the dif-
ference between the first delay and the subsequent de-
lay. If the transmission delay changes too much, it
will affect the quality of the transmitted data. Jitter
is a data packet delay known as QoS which is very
important, especially for real-time applications. The
result of QoS with jitter parameters is presented in Ta-
ble 6.
Table 6: QoS Jitter.
No Time ... Delay ... Jitter
1 0 ... 0.000393 ... 0.002354
2 0.000393 ... 0.003677 ... -0.01465
3 0.00407 ... 0.009315 ... 0.010127
4 0.013385 ... 0.000304 ... 0.003057
... ... ... ... ... ...
23 0.076403 ... 0.00521 ... -0.00864
Based on the calculations presented in Table 6.
obtained delay1-delay2 will produce a jitter, from the
overall delay of the total capture file of 2501 delay
produces a total jitter of -0.00328 with an average
jitter of -0.00021. Furthermore, the test was car-
ried out based on the time parameter before using the
cache and after using the squid cache by accessing
the youtube page. Based on the analysis done to ac-
cess the youtube page before using the proxy cache
resulted in a time of 65.352 seconds. Meanwhile, af-
ter using the proxy cache, the time forged was 30,310,
resulting in a time difference of 35,042 seconds. The
test was carried out by accessing 3 pages, namely
youtube, dikti, and Facebook. Results based on ef-
ficiency and difference are presented in Table 7.
Table 7: Response Time Comparison Results.
URL Before After Diffe Effi
Cache Cache rence ciency
Dikti 91.485 40.245 51.240 56.01%
Youtube 65.352 30.310 35.042 53.62%
Facebook 14.440 5.134 9.306 64.44%
Based on Table 7. above there is a difference
between URLs that are before being cached and af-
ter being cached, the difference is said to show ef-
ficiency numbers, efficiency numbers show 58.02re-
sponse time by an average of 58.02%.
5 CONCLUSIONS
Based on the results of the analysis carried out, it can
be seen that the proxy server has run according to the
wishes that the author expects and can access the in-
ternet, the client of this proxy server can also access
Bandwidth Management Analysis Using Proxy Server-Based Method Virtual Machine
123

the internet. For website blocks that have been de-
termined by the author, the proxy server can block
websites with the HTTP protocol, while for websites
that use the HTTPS protocol, proxies cannot block it
except all websites that use the HTTPS protocol are
also blocked. So in this study, the author only blocked
websites with the HTTP protocol, in this article, the
web was blocked http://www.youtube.com. Virtual
machines can be applied in building proxy servers and
are able to work optimally.
From the research, the test results using Wire-
shark were obtained with the density experienced
when searching so that the value determined based
on the rules using the packet loss value according to
the version TIPHON is divided into the four parts
QOS Throughput parameters of 1982k, Packet loss
of 0.0with an average of 0.0063 and total jitter of -
0.00328 with an average jitter of -0.00021. Testing
response time against sites using a squid proxy server
as a metadata cache can provide better response time
results than without using a proxy server with a vir-
tual machine.
Please note that ONLY the files required to com-
pile your paper should be submitted. Previous ver-
sions or examples MUST be removed from the com-
pilation directory before submission.
We hope you find the information in this template
useful in the preparation of your submission.
REFERENCES
Akmala, S. (2019). The Development of the Internet in the
Young Generation in Indonesia with the Relation of
the Law Applicable Ite. Cyber Security. dan Forensik
Digital vol. 1, no. 2, pp. 45–49 doi: 10.14421/csecu-
rity.2018.1.2.1371.
Amarudin, A. and Yuliansyah, A. (2018). Analisis penera-
pan mikrotik router sebagai user manager untuk men-
ciptakan internet sehat menggunakan simulasi virtual
machine. Tam, vol. 9, no. 1, pp. 62–66.
Arya, D. M. (2020). Manajemen bandwith pada mikrotik
dengan limitasi bertingkat menggunakan metode sim-
ple queue. J. Inf. Tecnol. Comput. Sci., vol. 3, no. 2,
pp. 270–280.
Ayubih, S. A. and Kuswanto, H. (2021). “implementation
of bandwidth management using queue tree at smk
cipta karya bekasi. Jurnal Mantik, vol. 5, no. 36, pp.
1237–1245.
D. Iswadi, R. A. and Munadi, R. (2019). “adaptive switch-
ing pcq-htb algorithms for bandwidth management in
routeros. In Proc. Cybern. 2019 - 2019 IEEE Int.
Conf. Cybern. Comput. Intell. Towar. a Smart Human-
Centered Cyber World, pp. 61–65, doi: 10.1109/CY-
BERNETICSCOM.2019.8875679.
Eko, A. G. F. (2017). Bandwidth management and user
management on wireless networks mesh network with
mikrotik. J. Pengemb. Teknol. Inf. dan Ilmu Komput.,
vol. 1, no. 11, p. 47.
Iqbal, M. and Tambunan, L. (2021). Samba server design
using ubuntu server and configuration network using
mikrotik routerboard (case study of pt.mesitechmitra
purnabangun). Jar. Sist. Inf. Robot., vol. 5, no. 1, pp.
1–8.
Jain, G. and Anubha (2021). Application of snort and
wireshark in network traffic analysis. IOP Conf. Ser.
Mater. Sci. Eng., vol. 1119, no. 1, p. 012007, doi:
10.1088/1757-899x/1119/1/012007.
Jang, H. C. and Lin, J. T. (2017). “sdn based qos
aware bandwidth management framework of
isp for smart homes. 2017 IEEE SmartWorld
Ubiquitous Intell. Comput. Adv. Trust. Comput.
Scalable Comput. Commun. Cloud Big Data
Comput. Internet People Smart City Innov. Smart-
World/SCALCOM/UIC/ATC/CBDCom/IOP/SCI
2017, pp. 1–6, 2018, doi:
10.1109/UICATC.2017.8397480.
Kusbandono and Syafitri, E. M. (2019). Penerapan quality
of service (qos) dengan metode pcq untuk manajemen
bandwidth internet pada wlan politeknik negeri ma-
diun. Res. Comput. Inf. Syst. Technol. Manag., vol. 2,
no. 1, p. 7, doi: 10.25273/research.v2i1.3743.
M. C. Breaban, A. Graur, A. D. P. and Balan, D. G.
(2018). Bandwidth management application in di-
rectory service environment. 14th Int. Conf. Dev.
Appl. Syst. DAS 2018 - Proc., pp. 88–92, 2018, doi:
10.1109/DAAS.2018.8396077.
Mohammad, S. (2021). a research survey on virtual ma-
chines for efficient computing. Int. J. IT Eng., vol.
Vol.2, no 2.
Mukti, A. R. and Dasmen, R. N. (2019). Prototipe mana-
jemen bandwidth pada jaringan internet hotel harvani
dengan mikrotik rb 750r2. J. Inform. J. Pengemb. IT,
vol. 4, no. 2, pp. 87–92, doi: 10.30591/jpit.v4i2.1322.
Naik, N. (2016). Migrating from virtualization to docker-
ization in the cloud: Simulation and evaluation of dis-
tributed systems. In Proc. - 2016 IEEE 10th Int. Symp.
Maint. Evol. Serv. Cloud-Based Environ. MESOCA
2016, doi: 10.1109/MESOCA.2016.9.
Nasir, J. and Andrianto, E. (2018). Implementation of
quality of service, bandwidth limit and load balanc-
ing by using dd-wrt firmware on the buffalo whr-hp-
g300n router. Simetris J. Tek. Mesin, Elektro dan
Ilmu Komput., vol. 9, no. 1, pp. 403–412, 2018, doi:
10.24176/simet.v9i1.1985.
Rifai, B. (2017). Bandwidth management in dynamic
queue using per connection method queuing. J. Ilmu
Pengetahuan Dan Teknologi Komputer, vol. 2, no. 2,
pp.73–79.
S. Sandhya, S. Purkayastha, E. J. and Deep, A. (2017).
“assessment of website security by penetration test-
ing using wireshark. 2017 4th Int. Conf. Adv. Com-
put. Commun. Syst. ICACCS 2017, pp. 4–7, doi:
10.1109/ICACCS.2017.8014711.
Sari, I. P. and Sukri, S. (2018). Analisis penerapan metode
antrian hirarchical token bucket untuk management
bandwidth jaringan internet. J. RESTI (Rekayasa Sist.
ICAISD 2023 - International Conference on Advanced Information Scientific Development
124

dan Teknol. Informasi), vol. 2, no. 2, pp. 522– 529,
doi: 10.29207/resti.v2i2.458.
Sarmah, S. and Sarma, S. K. (2019). A novel ap-
proach to prioritized bandwidth management in
802.11e wlan. 2019 IEEE 5th Int. Conf. Con-
verg. Technol. I2CT 2019, pp. 1–5, 2019, doi:
10.1109/I2CT45611.2019.9033871.
Social, W. A. (2022). Indonesian Digital Report
2022. We Are Social, [Online]. Available:
https://datareportal.com/reports/digital-2021-
indonesia.
Statistik, B. P. (2021). Statistik Telekomunikasi Indonesia.
Badan Pusat Statistik vol. 13, no. 1. pp. 104–116.
T. Rahman, S. S. and Nurdin, H. (2020). Analisis per-
forma routeros mikrotik pada jaringan internet. IN-
OVTEK Polbeng - Seri Inform., vol. 5, no. 1, p. 178,
doi: 10.35314/isi.v5i1.1308.
Tanwir, G. H. and Affandi, A. (2017). Combination of
fifo-lru cache replacement algorithms on proxy server
to improve speed of response to object requests from
clients. ARPN J. Eng. Appl. Sci., vol. 12, no. 3, pp.
710–715.
Wahyudi, W. (2017). “membangun proxy server cv global
max menggunakan sistem operasi linux blankon
6.0 ombilin sebagai manajemen akses jaringan.
Edik Inform., vol. 1, no. 1, pp. 63–71, doi:
10.22202/ei.2014.v1i1.1441.
Wisesa, B. P. A. (2018). Analisis perbandingan sistem man-
ajemen bandwidth berbasis class-based queue dan hi-
erarchical token bucket untuk jaringan komputer. J.
Pengemb. Teknol. Inf. dan Ilmu Komput., vol. 2, no. 6,
pp. 2067–2074.
Bandwidth Management Analysis Using Proxy Server-Based Method Virtual Machine
125
