
Clustering Diagnostic Assessment of Students with the K-Means
Algorithm Based on Talents and Interests
Mesra Betty Yel
1
, Syahril Efendi
2
, Muhammad Zarlis
3
and Saib Suwilo
2
1
Graduate Program of Computer Science, Department of Computer Science, Universitas Sumatera Utara,
Medan, Indonesia
2
Department of Computer Science, Universitas Sumatera Utara, Medan, Indonesia
3
Information System Management Department, BINUS Graduate Program – Master of Information System Management,
Bina Nusantara University, Jakarta, Indonesia
4
Department of Mathematics, Universitas Sumatera Utara, Medan, Indonesia
Keywords:
Differentiated E-Learning, Diagnostic Assessment Classification, K-Means Clustering Diagnostic
Assessment.
Abstract:
E-Learning is a way of teaching and learning online in virtual classrooms which gives experiences, changes
and needs according to technological developments and new learning paradigms with the flexibility given to
educators in formulating learning designs and assessments. This research contributes to producing a student
classification model using the k-means clustering algorithm to be applied to differentiated e-learning, which
can accommodate all user needs according to abilities, interests, and talents by using artificial intelligence.
The result is a differentiated e-learning model is produced to classify diagnostic assessments. Based on test
data on 20 students, it was successfully classified into 3 clusters, namely students in class 1 with a trend of X
values being in the do not know the value, Y with a very ignorant value while the Y value is in a value between
not knowing and partially understanding with a total of 9 people. Students are in grade 3 with a trend with
a value of X being between not knowing and partial understanding, Y with a partially understanding value,
while the Y value is at a very ignorant value with a total of 6 people with an accuracy level of f1 test score
100%.
1 INTRODUCTION
The development of technology and artificial intel-
ligence, especially in the Industrial Revolution 4.0
era, covers almost all fields, one of which is learn-
ing or e-learning with a machine learning approach.
E-Learning is a way of teaching and learning online
in a virtual classroom via a computer or mobile phone
with a wireless network. In eveloping e-Learning, it is
very important to determine the success factors. The
development of e-Learning quality in an institution
requires good standardization (Jung, 2011). There are
two literature-based and data-defined approaches to
the automatic detection of learning styles. A data-
driven strategy aims to build classifiers based on data.
A literature-based approach uses user models to de-
rive clues and generates simple if-then rules to detect
learning styles (Rasheed and Wahid, 2021). Various
efforts to expand access and improve the quality of
education delivery have not resulted in satisfactory
learning outcomes (Ree et al., 2018). However, the
expansion of access to education has not been fully
proportional to the improvement and equity in the
quality of education. The results of PISA in 2018 sur-
vey showed that 60% to 70% of students in Indone-
sia are still below the minimum proficiency standards
in science, mathematics, and reading. The disparity
in the quality of education between regions is also
still an issue. Virtual Reality (VR) is useful for in-
creasing student engagement and retention rates, for
some topics, compared to traditional learning tools
such as books, and videos. However, a student can
still be distracted and detached due to various fac-
tors including unwanted stress, thoughts, and noise
(Asish et al., 2022). Recent research, particularly in
the fields of psychology and human-computer inter-
action, shows that text and audio- based learning is
effective. According to the Modality Principle, on-
screen speech is superior to on-screen text for learn-
ing (Butcher, 2017) in the case of complex graphical
Yel, M., Efendi, S., Zarlis, M. and Suwilo, S.
Clustering Diagnostic Assessment of Students with the K-Means Algorithm Based on Talents and Interests.
DOI: 10.5220/0012457200003848
Paper published under CC license (CC BY-NC-ND 4.0)
In Proceedings of the 3rd International Conference on Advanced Information Scientific Development (ICAISD 2023), pages 295-301
ISBN: 978-989-758-678-1
Proceedings Copyright © 2024 by SCITEPRESS – Science and Technology Publications, Lda.
295

representations that include dual channel processing
in working memory. Sarune (Baceviciute et al., 2020)
found that reading texts from virtual books was su-
perior to listening to learning, specifically for knowl-
edge retention, but found no significant difference for
knowledge transfer. Han (Han et al., 2022) proposed
several intervention strategies to increase students’ at-
tention and their findings indicated that instruction
from real-world teachers can be transferred to virtual
classrooms. Various problems in achieving quality
resources, especially vocational education, including
the disparity in the quality of education between re-
gions, the competence of teachers in Indonesia is also
inadequate, it is believed that the teaching model of
teachers in Indonesia is still not on target, the lack of
readiness of students in participating in learning, ei-
ther due to lack of nutrition from childhood, minimal
family welfare conditions, as well as a lack of basic
literacy skills, lack of competence and motivation of
teachers in teaching, lack of learning resources, man-
agement and governance of education has not devel-
oped well. Learning competencies must be achieved
by students at each stage of development in primary
and secondary education. The learning outcomes con-
tain several competencies within the scope of the ma-
terial in the form of a comprehensive narrative then
adjust the mapping of learning outcomes in the devel-
opmental stages of students who are classified in the
age phase (Wickramasinghe, 2022).
The presence of the concept of machine learn-
ing brings major changes in various fields, especially
in terms of prediction and classification. Due to
the recent advances in the field of artificial intelli-
gence, there has been an increase in research on how
machine learning can help in detection, and predic-
tion (Nordin et al., 2022). Machine learning and
artificial intelligence techniques have proven help-
ful when pragmatic for complex problems and fields
such as energy optimization, workflow scheduling,
video games, and cloud computing (Kumar et al.,
2022). Data heterogeneity and large data volumes
create many problems regarding digital system speed
and data storage security. The solution can be found
in artificial intelligence technologies, specifically ma-
chine learning (Kuklin et al., 2023; Alani and Tawfik,
2022). In research on skin cancer classification, the
SVM method excels in classification results, namely
KNN at 92.70%, SVM at 93.70%, Decision tree (DT)
at 89.5%, and boosted tree (BT) at 84.30% (Victor
and Ghalib, 2017). Machine learning can be federated
on patient datasets with the same set of variables but
separated across stores. But federated learning can-
not handle situations where different data types for a
given patient are vertically segregated across organi-
zations and when matching patient IDs across multi-
ple institutions is difficult (Liu et al., 2022; Sukanya
et al., 2022). Recently, a segmentation method based
on multi-task learning was proposed, and it can group
more than two images simultaneously and easily add
different types of previous images. The use of mobile
technology has an important role in educational insti-
tutions, including achieving distance learning goals.
Various media can also be used to support the imple-
mentation of E-learning. For example, virtual classes
use Google Classroom, Google Meet, Zoom, Ed-
modo, and Schoology services and instant messaging
applications such as WhatsApp. E-learning is a form
of learning model that is facilitated and supported by
the use of information and communication technol-
ogy (Moore, 2016).
To achieve effective learning, students need to be
classified based on their talents and interests before
starting the teaching and learning process so that ed-
ucators know students’ talents and interests and pro-
vide learning materials according to their needs, it is
necessary to classify students based on diagnostic as-
sessments.
2 RESEARCH FRAMEWORK
This research is focused on classifying students ac-
cording to their interests and talents so that they can
be used for differentiated e-learning models according
to the needs and interests of students by study learning
style models, dimensions, values, and their combi-
nations to identify students’ competencies, strengths,
weaknesses. The proposed methodology is a machine
learning approach for early detection and the results
of evaluating the development of the learning process
of students, as a research framework using the follow-
ing concepts:
Figure 1: Research Framework.
Beginning with the determination of learning out-
comes which become standards and learning targets
that must be achieved by students who will be tested
during a diagnostic assessment. Diagnostic assess-
ment according to the number of subjects to be tested
ICAISD 2023 - International Conference on Advanced Information Scientific Development
296

and the weighting is complete understanding, partial
understanding and not understanding. The results of
the diagnostic assessment were classified and clus-
tered using the k-mean algorithm for proximity Eu-
clidean distance. Cluster results become an alterna-
tive solution in classifying students, which then learn-
ing materials are adapted to each cluster. Continu-
ously evaluate and cluster student development to de-
velop and improve the quality of student learning.
3 RESULT AND DISCUSSION
The most important issue in the discussion about clas-
sification is the determination of similarity, namely
the degree to which the student data considered re-
sembles the data of other participants. In fact the
measure of similarity is very important for clustering.
(Keogh and Kasetty, ; Fu, 2011; Serra and Arcos, ;
Lauwers and Moor, 2017). Grouping sets W(s) re-
quires understanding the distance with the length w.
There are several possibilities and options for mea-
suring distances in finding rules. The simplest option
is to treat the subsequence of length w as the element
of R
w
and then apply the Euclidean distance (that is,
metric L
2
). (Jiang et al., 2019) has proven empiri-
cally that the Euclidean distance is unbeatable. Eu-
clidean distance is a method that is parameter free,
fast computation time and suitable for various data
mining optimizations such as indexing. The meaning
is, for ˆx = (x
1
,...,x
w
) and ˆy = (y
1
,..., y
w
) defined
d (ˆx, ˆy) =
∑
i
(x
i
− y
i
)
2
!
1/2
(1)
As a metric in grouping. Other metrics include
common metrics L
p
that are defined with
L
p
( ˆx, ˆy) =
∑
i
(x
i
− y
i
)
2
!
1/p
(2)
For p ≥ 1 and L
∞
= max
i
|
x
i
− y
i
|
In various uses, we want to obtain a subsequent
shape as the main factor determining the distance.
This means that two subsequences can essentially
have the same shape even though they have different
amplitudes and baselines. One way to achieve this is
to normalize the subsequences and then apply metrics
L
2
in the normalized subsequence. State the sequence
version ˆx normalized with κ (ˆx), defined distance be-
tween ˆx and ˆy by
d (ˆx, ˆy) = L
2
(κ ( ˆx)) −(κ( ˆy)) (3)
Normalization can be done in a number of ways
κ( ˆx)
i
= x
i
− E ˆx
i
(where E ˆx
i
is the expected or aver-
age value of the sequence value), which results in the
average value of the sequence being 0. Can also be
used κ(ˆx )
i
= (x
i
−E ˆx
i
)/D ˆx (where D ˆx is the variation
of the sequence), which will force sequence mean to
0 and variance to 1. To evaluate the quality of cluster-
ing using cross entropy (Geyer et al., 2019) which is
stated as follows:
Crossentropy =
k
∑
j=i
n
j
|
SDB
|
−
m
∑
i=1
P
i j
log(P
i j
)
!
(4)
K : number of clusters
n
j
: number of sequences in j cluster
m : the number of classes in the sequence
database
P
i j
: probability randomly j cluster
SDB : database sequences
Normalized mutual information (NMI) is one sig-
nificant comparison measure for evaluating cluster or
algorithm results. This can help researchers to assess
the performance and analysis of improvement of an
algorithm. Specifically determined as follows. Sup-
pose C
T
and C
E
are a set of class labels and a set
of cluster labels calculated using the clustering algo-
rithm, then NMI between C
T
and C
E
is:
NMI (C
T
,C
E
) =
H (C
T
) − H (C
E
)
H (C
T
,C
E
)
= 1 +
I (C
T
,C
E
)
H (C
T
,C
E
)
(5)
where H(P), H(P,Q) and I(P,Q) represents the
entropy, joint entropy and mutual information vari-
ables P dan Q. When C
T
and C
E
independent from
one variable to another, NMI(C
T
,C
E
) = 1, because
H(C
T
,C
E
) = H(C
T
) + H(C
E
) must be met. The
greater the NMI(C
T
,C
E
) the more accurate the clus-
ter results will be (Umatani et al., 2023). Sampling
efficiency depends on the choice of sampling den-
sity. A sampling density close to optimal can be found
through the application of the cross entropy method.
The cross-entropy method is an adaptive sampling ap-
proach that determines the sampling density by min-
imizing the Kullback-Leibler divergence between the
theoretically optimal needs sampling density and a se-
lected group of parametric distributions(Marelli and
Sudret, 2018).
Clustering Diagnostic Assessment of Students with the K-Means Algorithm Based on Talents and Interests
297

4 DIFFERENTIATED
ELEARNING MODELS
The resulting differentiated e-learning model is de-
scribed by the following formula.
ET =
k
∑
i−1
l
∑
i=1
x
i j
+
X
i j
∑
n
i=1
y
i j
+
X
i j
∑
n
j=1
y
i j
+
s
p
∑
k=1
y
ik
− c
jk
2
+
N
∑
n=1
a
n
−
1
2
N
∑
n=1
N
∑
m=1
a
n
a
m
t
n
t
m
k (x
n
,x
m
)
(6)
ET : differentiated elearning
X : matrix element data set
y : The value of the elements of the diagnostic
assessment
c : centroid distance
N : number of super vector
a : super vector
t : classification data
k : number of classes
Available data is denoted as x
i j
, where k is the
number of participants and l is the number of di-
agnostic assessment variables so that x
i j
∈ k,l, clus-
ters formed after the diagnostic assessment is denoted
by p, then c ∈ p while the respective labels are de-
noted n
a
∈
{
−1,+1
}
f orn = 1,2,. . . ,N, where N is
the number of data labels.
1. Perform a Diagnostic Assessment
A =
k
∑
i=1
l
∑
j=1
x
i j
(7)
A : diagnostic assessment
x
i j
: identify the competencies, strengths,
weaknesses of participant data
k
∑
i=1
l
∑
j=1
x
i j
> 1,i = 1, j = 1...k (8)
where k=data set or the number of students carry-
ing out a diagnostic assessment while l is the com-
petency variable being tested. Diagnostic assess-
ment data is data from the results of a student’s
diagnostic assessment of a particular subject.
2. Normalization with individual max value matrix
P
i j
=
X
i j
∑
n
i=1
y
i j
(9)
N
+
:
(maxP
i j
| jεk,i = 1,2,3,...,n)
N
−
:
(minP
i j
| jεk,i = 1,2,3,...,n)
P : Diagnostic assessment value
N
+
carried out to seek advantage with the poten-
tial value of competence, strength, where as N
−
function to find the value of the cost or constraints
to be optimized. By normalizing the matrix, the
average and comparison of the diagnostic assess-
ment values between participants were produced.
3. Determine the max value of all participants
S
i j
=
X
i j
∑
n
j=1
y
i j
(10)
NS
+
:
(maxS
i j
| jεk,i = 1,2,3,...,n)
NS
−
:
(minS
i j
| jεk,i = 1,2,3,...,n)
NS
+
used for the maximum value of the diagnos-
tic assessment of all participants, meanwhile NS
−
to determine the minimum value.
4. Carry out classification and clustering based on
talent interests
d =
s
p
∑
k=1
(x
i j
− v
i j
)
2
(11)
Each element has a potential corresponding con-
straint NS
+
and constraints NS
−
, where each ele-
ment is taken into consideration in classifying ac-
cording to interests, talents, strengths and compe-
tencies, strengths and weaknesses. For each el-
ement that has similarities, it will form a group
based on the distance function d to determine the
proximity distance.
The model found produces a classification with the
K-Means algorithm clustering approach, with the fol-
lowing stages:
1. Diagnostic Assessment. Diagnostic assessment
is the result of student assessment with certain
fields and criteria before the learning process be-
gins. Test data using cognitive diagnostic assess-
ment data is shown in the table 1.
2. Normalization. The process of normalization is
to compare the results of the diagnostic assess-
ment between participants, with normalization a
comparison value is produced between students
along with the maximum and minimum scores of
students with the formula:
P
i j
=
x
i j
∑
n
i=1
y
i j
and S
i j
=
x
i j
∑
n
j=1
y
i j
Then the matrix normalization of the results of
the diagnostic assessment is produced in the table
2.
ICAISD 2023 - International Conference on Advanced Information Scientific Development
298

Table 1: Diagnostic assessment data.
ID X Y Z
1 fully understand fully understand Partly Understand
2 Don’t know Partly Understand Partly Understand
3 fully understand Don’t know Partly Understand
4 fully understand Partly Understand Don’t know
5 fully understand Don’t know fully understand
6 Don’t know Partly Understand fully understand
7 Partly Understand Don’t know fully understand
8 Don’t know Partly Understand Don’t know
9 Partly Understand fully understand Partly Understand
10 Don’t know fully understand Don’t know
11 Don’t know Don’t know fully understand
12 Partly Understand Partly Understand fully understand
13 fully understand Don’t know fully understand
14 fully understand fully understand Don’t know
15 Don’t know fully understand Partly Understand
16 Partly Understand Don’t know Don’t know
17 Partly Understand Don’t know fully understand
18 Don’t know Partly Understand fully understand
19 fully understand Don’t know Partly Understand
20 fully understand Partly Understand Don’t know
Table 2: Matrix normalization.
ID Tranformation Normalization
x y z x y z
1 3 3 2 1.463414634 1.62162 0.95238
2 1 2 2 0.487804878 1.08108 0.95238
3 3 1 2 1.463414634 0.54054 0.95238
4 3 2 1 1.463414634 1.08108 0.47619
5 3 1 3 1.463414634 0.54054 1.42857
6 1 2 3 0.487804878 1.08108 1.42857
7 2 1 3 0.975609756 0.54054 1.42857
8 1 2 1 0.487804878 1.08108 0.47619
9 2 3 2 0.975609756 1.62162 0.95238
10 1 3 1 0.487804878 1.62162 0.47619
11 1 1 3 0.487804878 0.54054 1.42857
12 2 2 3 0.975609756 1.08108 1.42857
13 3 1 3 1.463414634 0.54054 1.42857
14 3 3 1 1.463414634 1.62162 0.47619
15 1 3 2 0.487804878 1.62162 0.95238
16 2 1 1 0.975609756 0.54054 0.47619
17 2 1 3 0.975609756 0.54054 1.42857
18 1 2 3 0.487804878 1.08108 1.42857
19 3 1 2 1.463414634 0.54054 0.95238
20 3 2 1 1.463414634 1.08108 0.47619
3. Cluster Classification Model.
(a) The basic concept of K-Means is iterative
search for cluster centers.
(b) The cluster center is determined based on the
distance of each data to the cluster center.
(c) The clustering process begins by identifying
the data to be clustered, x
i j
(i = 1,...,n; j =
1,..., m) with n is the amount of data to be clus-
tered and m is the number of variables.
(d) At the beginning of the iteration, the center of
each cluster is assigned independently (arbitrar-
ily), c
k j
(k = 1,...,K; j = 1,..., m).
(e) Then the distance between each data and each
cluster center is calculated.
(f) To calculate the i-th data distance (X
i
) at the
center of the k-cluster (C
k
), named (d
ik
), the Eu-
clidean formula can be used, namely:
d =
s
p
∑
k=1
x
ik
− z
jk
2
(g) A data will be a member of the J-cluster if the
data distance to the center of the J-cluster is the
smallest compared to the distance to the center
of the other clusters.
(h) Next, group the data that are members of each
cluster.
(i) The new cluster center value can be calculated
by finding the average value of the data that is
a member of the cluster.
Table 3: Model formulation data sample.
X Y Z
1.463414634 1.621621622 0.952380952
0.487804878 1.081081081 0.952380952
1.463414634 0.540540541 0.952380952
1.463414634 1.081081081 0.476190476
1.463414634 0.540540541 1.428571429
0.487804878 1.081081081 1.428571429
0.975609756 0.540540541 1.428571429
0.487804878 1.081081081 0.476190476
0.975609756 1.621621622 0.952380952
0.487804878 1.621621622 0.476190476
0.487804878 0.540540541 1.428571429
0.975609756 1.081081081 1.428571429
1.463414634 0.540540541 1.428571429
1.463414634 1.621621622 0.476190476
0.487804878 1.621621622 0.952380952
0.975609756 0.540540541 0.476190476
0.975609756 0.540540541 1.428571429
0.487804878 1.081081081 1.428571429
1.463414634 0.540540541 0.952380952
1.463414634 1.081081081 0.476190476
1. Grouping the data into 3 clusters K = 3. Suppose
the cluster center is set arbitrarily
C
1
: (1.463414634, 1.621621622, 0.952380952);
C
2
: (0.487804878, 0.540540541, 0.952380952);
C
3
: (0.952380952, 1.081081081, 1.621621622)
2. Calculate the distance of each data to each cluster
center, for example, to calculate the distance of
the first data (No.1) to the first cluster center is:
(a) K1 = (1.463414634 + 1.463414634)
2
+ (1.621621622 + 1.621621622)
2
+
(0.952380952 + 0.952380952)
2
=
(b) K2 = (0.487804878 + 1.463414634)
2
+ (0.540540541 + 1.621621622)
2
+
(0.952380952 + 0.952380952)
2
=
(c) K3 = (0.952380952 + 1.463414634)
2
+ (1.081081081 + 0.952380952)
2
+
(1.621621622 + 0.952380952)
2
=
Clustering Diagnostic Assessment of Students with the K-Means Algorithm Based on Talents and Interests
299
The complete distance calculation results are nor-
malized data are classified based on similarity, where
each element is considered in classifying accord-
ing to interests, talents, strengths and competencies,
strengths and weaknesses formed in 3 clusters with a
cluster center.
Cluster 1:
X : 0.9756
Y : 0.5405
Z : 1.4286
Cluster 2 :
X : 0.4878
Y : 1.0811
Z : 0.9524
Cluster 3 :
X : 1.4634
Y : 1.6216
Z : 0.4762.
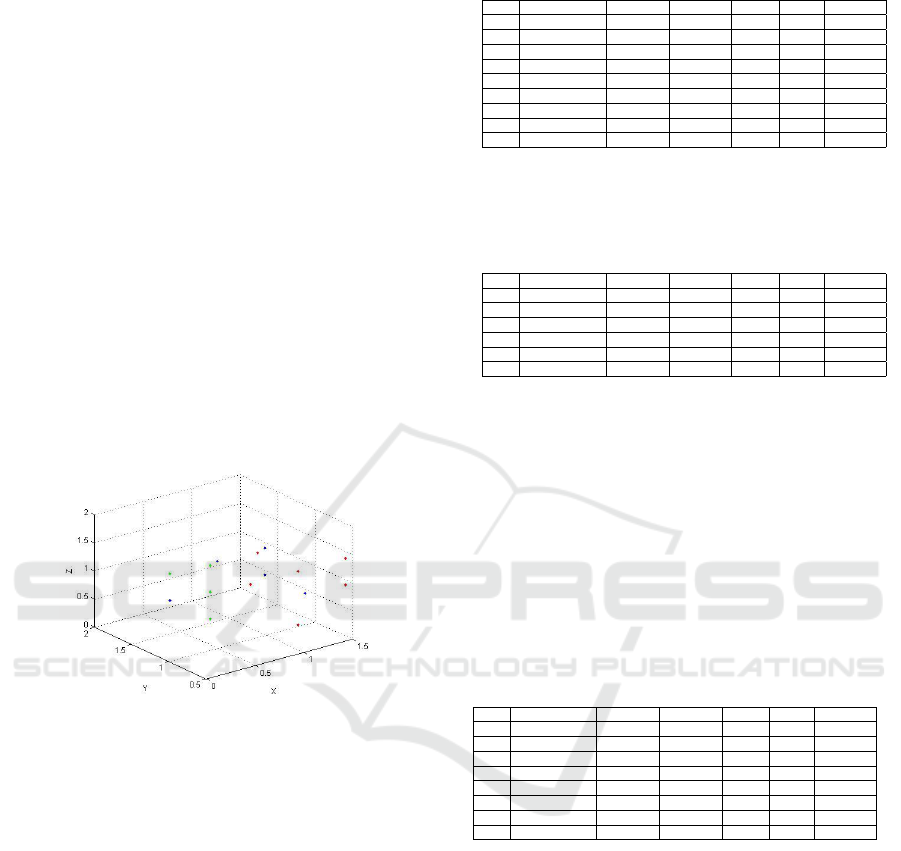
Figure 2: Cluster Diagnostic Assessment.
The results of the student’s diagnostic assessment
were clustered into 3 clusters, cluster 1 where the
value of X was in the do not know value, Y was
in the value of not knowing very much, while the
value of Y was in the value between not knowing
and partially understanding. Cluster 2 is where the
X value is very ignorant, Y is partially understood,
while Y is partially understood. Cluster 3 is where
the value of X is in the value between not knowing
and partially understanding, Y with the value of
partially understanding while the value of Y is in the
value of not knowing very much. Follow-up of the
results of the diagnostic assessment cluster becomes
a decision support for educators to provide learning
materials to students according to their abilities,
talents and interests which are represented by the
variables X, Y and Z. Formed 3 clusters, namely:
Cluster 1
There are 9 students in cluster 1 with an X value of
not knowing, Y with a very ignorant value while the
Table 4: Results of cluster 1 diagnostic assessment.
ID x y z Max Min Cluster
3 1.463414634 0.54054 0.95238 3 1 1
5 1.463414634 0.54054 1.42857 3 1 1
7 0.975609756 0.54054 1.42857 3 1 1
11 0.487804878 0.54054 1.42857 3 1 1
12 0.975609756 1.08108 1.42857 3 2 1
13 1.463414634 0.54054 1.42857 3 1 1
16 0.975609756 0.54054 0.47619 2 1 1
17 0.975609756 0.54054 1.42857 3 1 1
19 1.463414634 0.54054 0.95238 3 1 1
Y value is between not knowing and partially under-
standing, the average max value= 3 and minimum=1.
Table 5: Results of cluster 2 diagnostic assessment.
ID x y z Max Min Cluster
ID x y z Max Min Cluster
2 0.487804878 1.08108 0.95238 2 1 2
6 0.487804878 1.08108 1.42857 3 1 2
8 0.487804878 1.08108 0.47619 2 1 2
15 0.487804878 1.62162 0.95238 3 1 2
18 0.487804878 1.08108 1.42857 3 1 2
Cluster 2
There are 5 students in cluster 2 with X values being
very ignorant, Y with partial understanding scores
while Y scores are partially understanding scores,
average max score = 2.8 and minimum = 1.
Cluster 3
There are 6 students in cluster 3 with an X value be-
tween not knowing and partial understanding, Y with
a partial understanding value while the Y value is very
ignorant, max average value = 3 and minimum = 1.2.
Table 6: Results of cluster 3 diagnostic assessment.
ID x y z Max Min Cluster
ID x y z Max Min Cluster
ID x y z Max Min Cluster
1 1.463414634 1.62162 0.95238 3 2 3
4 1.463414634 1.08108 0.47619 3 1 3
9 0.975609756 1.62162 0.95238 3 2 3
10 0.487804878 1.62162 0.47619 3 1 3
14 1.463414634 1.62162 0.47619 3 1 3
20 1.463414634 1.08108 0.47619 3 1 3
5 CONCLUSIONS
The existence of e-learning system with a new
paradigm that provides flexibility for educators to for-
mulate learning designs and assessments according to
the characteristics and needs of students can be opti-
mized by applying artificial intelligence using the k-
means clustering algorithm.
The results of the classification of the diagnostic
assessment can accommodate all the needs of students
according to abilities, interests, and talents by using
artificial intelligence in identifying the level of abili-
ties and needs of participants to get a label after the
diagnostic assessment.
ICAISD 2023 - International Conference on Advanced Information Scientific Development
300

Based on test data on 20 people, it was success-
fully classified into 3 clusters, namely students in
class 1 with a trend of X values being in the do not
know the value, Y with a very ignorant value while
the Y value is in a value between not knowing and par-
tially understanding with the total 9 people. Students
in class 2 with the trend that the value of X is in the
very ignorant value, Y with a partial understanding
value while the Y value is in the partial understanding
value with a total of 5 people. Students are in class
3 with a trend with a value of X being between not
knowing and partially understanding, Y with a partial
understanding value while the Y value is at a very ig-
norant value with a total of 6 people with an accuracy
level of the f1 test score of 100%.
REFERENCES
Alani, M. and Tawfik, H. (2022). Phishnot: A cloud-based
machine-learning approach to phishing url detection.
Comput. Networks, 218:109407,. doi:.
Asish, S., Kulshreshth, A., and Borst, C. (2022). Detect-
ing distracted students in educational vr environments
using machine learning on eye gaze data. Comput.
Graph, 109:75–87,. doi:.
Baceviciute, S., Mottelson, A., Terkildsen, T., and Makran-
sky, G. (2020). Investigating representation of text and
audio in educational vr using learning outcomes and
eeg. In Proceedings of the 2020 CHI Conference on
Human Factors in Computing Systems, pages 1–13,.
Butcher, K. (2017). The multimedia principle. In The
Cambridge handbook of multimedia learning, page
174–205. Cambridge University Press, New York,
NY, US, 2nd edition.
Fu, T. (2011). Engineering applications of artificial intelli-
gence a review on time series data mining. Eng. Appl.
Artif. Intell, 24(1):164–181,.
Geyer, S., Papaioannou, I., and Straub, D. (2019). Cross
entropy-based importance sampling using gaussian
densities revisited. Struct. Saf, 76:15–27,. doi:.
Han, Y., Miao, Y., Lu, J., Guo, M., and Xiao, Y. (2022). Ex-
ploring intervention strategies for distracted students
in vr classrooms.
Jiang, G., Wang, W., and Zhang, W. (2019). A novel dis-
tance measure for time series: Maximum shifting cor-
relation distance. Pattern Recognit. Lett, 117:58–65,.
doi:.
Jung, I. (2011). The dimensions of e-learning quality: From
the learner’s perspective. Educ. Technol. Res. Dev,
59(4):445–464,.
Keogh, E. and Kasetty, S. On the need for time series data
mining benchmarks : A survey and empirical demon-
stration.
Kuklin, V., Alexandrov, I., Polezhaev, D., and Tatarkanov,
A. (2023). Prospects for developing digital
telecommunication complexes for storing and ana-
lyzing media data. Bull. Electr. Eng. Informatics,
12(3):1536–1549,.
Kumar, Y., Kaul, S., and Hu, Y.-C. (2022). Machine learn-
ing for energy-resource allocation, workflow schedul-
ing and live migration in cloud computing: State-
of-the-art survey. Sustain. Comput. Informatics Syst,
36:100780,. doi:.
Lauwers, O. and Moor, B. (2017). A time series distance
measure for efficient clustering of input / output sig-
nals by their underlying dynamics.
Liu, D., Fox, K., Weber, G., and Miller, T. (2022). Confed-
erated learning in healthcare: Training machine learn-
ing models using disconnected data separated by in-
dividual, data type and identity for large-scale health
system intelligence. J. Biomed. Inform, 134:104151,.
doi:.
Marelli, S. and Sudret, B. (2018). An active-learning algo-
rithm that combines sparse polynomial chaos expan-
sions and bootstrap for structural reliability analysis.
Struct. Saf, 75:67–74,. doi:.
Moore, D. (2016). E-learning and the science of instruc-
tion: Proven guidelines for consumers and design-
ers of multimedia learning. Educ. Technol. Res. Dev,
54(2).
Nordin, N., Zainol, Z., Noor, M., and Chan, L. (2022).
Suicidal behaviour prediction models using machine
learning techniques: A systematic review. Artif. In-
tell. Med, 132:102395,. doi:.
Rasheed, F. and Wahid, A. (2021). Learning style detection
in e-learning systems using machine learning tech-
niques. Expert Syst. Appl, 174(February).
Ree, J., Muralidharan, K., Pradhan, M., and Rogers, H.
(2018). Double for nothing? experimental evidence
on an unconditional teacher salary increase in indone-
sia. Q. J. Econ, 133(2).
Serra, J. and Arcos, J. An empirical evaluation of similarity
measures for time series classification.
Sukanya, J., Gandhi, K., and Palanisamy, V. (2022). An
assessment of machine learning algorithms for health-
care analysis based on improved mapreduce. Adv.
Eng. Softw, 173:103285,. doi:.
Umatani, R., Imai, T., Kawamoto, K., and Kunimasa, S.
(2023). Time series clustering with an em algorithm
for mixtures of linear gaussian state space models.
Pattern Recognit, pages 109375,. doi:.
Victor, A. and Ghalib, M. (2017). Automatic detection and
classification of skin cancer. Int. J. Intell. Eng. Syst,
10(3):444–451,.
Wickramasinghe, I. (2022). Applications of machine learn-
ing in cricket: A systematic review. Mach. Learn. with
Appl, 10:100435,. doi:.
Clustering Diagnostic Assessment of Students with the K-Means Algorithm Based on Talents and Interests
301
