
Deep Learning Models for Stock Price Prediction of Companies
Associated with Indian Natural Gas Value Chain Underpinning Their
ESG Commitments
Pratyush Prasad
Data Science and Engineering Department, Manipal University, Jaipur, Rajasthan, India
Keywords: ESG, Natural Gas, Deep Learning, Long Short-Term Memory, Multi-Layer Perceptron Model Recurrent
Neural Network.
Abstract: Globally, stockholders are investing in companies strategizing to create a tangible, practical strategy for
quantifying ESG value for investors, in tandem with decarbonization, to enhance sustainability and combat
climate change. Natural Gas (NG), recognized as the preferred transitional fuel, accounts for 24.2% of the
world's primary energy(PE) consumption mix. India seeks to increase the proportion of NG in the country's
PE mix from 6% to 15% by 2030 to sustain decarbonized economic growth with NG transition. In this context,
this article aims to forecast and compare the stock prices of eight Indian companies associated with the NG
value chain, contributing to India's transition to a gas-based economy. These companies with a robust ESG
framework are associated with activities like NG exploration, Liquified NG import, transmission, distribution,
and retailing. The researcher applied deep learning techniques like CNN, LSTM, the RNN model, and MLP
to forecast stock prices and evaluate performance using historical data with seven attributes imported from
yahoo-finance get data module. LSTM model prediction is the best with the lowest RMSE value. The research
novelty lies in integrating ESG commitments into the prediction framework, acknowledging the growing
importance of sustainability factors in the financial market while the end consumers enhance NG consumption
for a gas-based economy transition.
1 INTRODUCTION
Climate Change is a global debate, with different
counties setting aspirational targets for "Net Zero"
emissions to decarbonize their energy ecosystems. As
a result, global investors have switched their
investment decisions to companies manifesting
progressive and responsible Environmental, Social,
and Governance (ESG) commitments(Sarangi, 2021).
India aims to achieve its Net Zero target by
2070(MoEFCC, 2022), with stiff diverse energy
domain intermittent milestones for 2030. One such
target is to enhance the share of Natural Gas (NG) in
India's primary energy consumption mix from 6 % to
15 % by 2030 (MoPNG, 2023) to support economic
growth, and decarbonization plans concurrently. NG
is the cleanest fossil fuel, with 24.2 % share in the
global primary energy consumption mix, while only
6.3 % in India (BP, 2022). India companies associated
with the NG Value Chain strive to increase NG
availability and access to the natural gas supply chain
(NGSC) to enhance consumption. Oil and Natural
Gas Corporation (ONGC) and Reliance Industries
Limited (RIL) are upstream companies associated
with domestic NG production. ONGC aims to
maximize shareholder's value by enhancing domestic
gas availability promising sustainable growth. RIL
aims at building trust with stakeholders, consistently
achieving high productivity and growth. Midstream
and downstream companies like GAIL (India)
Limited, operating 15,413 km of NG pipelines, intend
to create stakeholder's value through affordable NG
access by enhancing its spread to pipelines and
penetration through City Gas Distribution (CGD)
Network for gas retailing. The Petronet LNG Limited
(PLL), operating India's largest Liquified NG(LNG)
terminal of 17.5 MMTPA capacity at Dahej, Gujarat,
builds stakeholder's trust by ensuring uninterrupted
LNG re-gasification service for the continuous supply
of degasified LNG(RLNG) for downstream
customers. Hindustan Petroleum Company Limited
(HPCL) and Bharat Petroleum Corporation Limited
(BPCL), are new entrants in establishing the CGD
454
Prasad, P.
Deep Learning Models for Stock Price Prediction of Companies Associated with Indian Natural Gas Value Chain Underpinning Their ESG Commitments.
DOI: 10.5220/0012517300003739
Paper published under CC license (CC BY-NC-ND 4.0)
In Proceedings of the 1st International Conference on Artificial Intelligence for Internet of Things: Accelerating Innovation in Industry and Consumer Electronics (AI4IoT 2023), pages 454-460
ISBN: 978-989-758-661-3
Proceedings Copyright © 2024 by SCITEPRESS – Science and Technology Publications, Lda.

projects independently. They aim to fulfill its social
commitment through customer care, environmental
protection, continuous improvement, and innovation.
Indraprastha Gas Limited (IGL), the pioneer in India's
gas retailing, adopts a customer-centric approach to
improve quality of life and shareholder's value.
National Thermal Power Corporation (NTPC), the
largest electricity producer in India, creates
shareholder's value by providing a reliable power
supply in an environmentally friendly, economical,
and efficient way. These companies follow their
management-approved, universally accepted ESG
reporting guidelines, which attract socially conscious
prospective investors to invest in their companies.
The guidelines underpin the requirements of the
Securities & Exchange Board of India and the
Ministry of Corporate Affairs, Government of
India(RIL, 2022).
Companies globally are giving high importance to
their ESG performance(Zumente & Bistrova, 2021).
Companies set their own targets to report
performance standards under various ESG criteria
(Edward & Evan, 1990), reflecting responsible
business growth. The environmental criteria reflect
company's policies, standards, and guidelines for
environmental protection, sustainability, energy
management, waste management, biodiversity, etc.
The social criteria manifest how the companies
handle their customers, employees, suppliers, and
communities within their operating domain. The
governance criteria relate to the company's leadership,
internal controls, audit systems, risk management,
shareholder rights protection, ethics etc. On scanning
the annual and sustainability report of a few of the
companies above, it is seen that apart from standard
financial performance parameters, economic, social,
and environmental parameters are also reported.
Some of these parameters are economic value
generated vs distributed, health safety and
environmental score, customer satisfaction index,
value added per employee, procurement from
government e-marketplace, energy consumption and
saving, GHG emission and saving, water
consumption and recycling, tree plantation,
environmental expenditure, audit para status, major
decisions in board meetings and AGM etc.(GAIL,
2022; RIL, 2022).
With growing concern for climate change and
enhanced awareness of corporate governance,
investors globally select their own set of criteria to
judge ESG performance before making investment
decisions for short-term and long-term profit
maximization. These may be related to the growth of
the top line, cost reductions, regulatory compliances,
productivity, and investment decisions(Henisz et al.,
2019). However, accurate prediction of future stock
prices is paramount for profit maximization and
shareholder value creation. In this context, this
exploratory quantitative research adopts data
analytics for predicting stock prices using Deep
learning techniques (Hu et al., 2021; Vijh et al., 2020).
The research has applied techniques such as CNN,
LSTM, RNN, and MLP to predict stock prices and
performance evaluation of the above-named Indian
companies associated with the NGSC.
2 DEEP LEARNING
TECHNIQUES
Machine learning's subfield, "Deep Learning" (DL),
utilizes multilayered neural networks. These artificial
neural networks aim to mimic the human brain so that
computers can learn from vast datasets like humans.
The following four models applied.
Artificial Neural Network (ANN) is a branch of
AI that takes its cues from the brain. Computational
networks inspired by the biological neural networks
used in brain development are the basis for most
artificial neural networks. Like the neurons in a
human brain, the neurons in an ANN are connected in
different layers. Nodes refer to these neurons.
A multi-layer perception (MLP) is a neural
network that has multiple layers. It's a deep layer with
many connections that can map one dimension to
another. Neural networks are constructed by linking
neurons together in such a way that the results of
certain neurons are used as inputs for other neurons.
Recurrent Neural Network (RNN) is a type of
neural network where the output from the previous
step is fed as input to the current step. The output from
the previous stage is used as input for the stage at
hand in RNN. The Hidden state, which retains some
data about a sequence, is RNN's primary and most
crucial characteristic. Since the state recalls the
Network's prior input, it is sometimes called the
Memory State. All inputs or hidden layers undergo
the same operation with the same parameters to
generate the output.
Long Short-Term Memory Networks (LSTM) are
DL, sequential neural networks that can retain
knowledge. It is a subset of RNNs that solves the
issue of vanishing gradients.
Deep Learning Models for Stock Price Prediction of Companies Associated with Indian Natural Gas Value Chain Underpinning Their ESG
Commitments
455

3 LITERATURE REVIEW
A comprehensive literature review was conducted to
understand the various concepts applied to the
research problem.
Hu et al., 2021 provide a detailed review from
2015 to the present on the prediction of stock price
value through DL methods. The models were
evaluated by analyzing the dataset through techniques
such as CNN, LSTM, DNN, RNN & reinforcement
learning. It also discusses the main performance
metrics of all models. In this paper, the hybrid
networks show promising signs for future research.
Islam & Nguyen, 2020 compares three models
ARIMA, ANN & geometric Brownian model. These
models could predict the stock price for the next day.
In this paper, the models ARIMA and geometric
Brownian model are better than the ANN model for
short-term next-day stock price prediction. ARIMA
model and Brownian model performed almost the
same. These models are good on time-series data, and
researchers and investors can examine some different
models to predict the prices of each stock to find the
best prediction model.
Nikou et al., 2019 used four data mining
techniques to predict the close price of iShares MSCI
UK. The results showed that the RNN method with
an LSTM block was better than the other methods,
and the SVR method had higher precision than neural
networks and random forests. Recommendations
were made to use the DL method, investigate
different types of LSTM models, and consider the
role of other influential factors in future studies.
Vijh et al., 2020 argued that predicting stock
market returns is challenging due to constantly
changing stock values. They created new variables to
obtain higher accuracy. ANN is used for predicting
the next-day closing price of the stock, and RF is for
comparative analysis. Results show that ANN gives
better prediction of stock prices than RF. DL models
could be developed considering financial news
articles and financial parameters such as closing price,
traded volume, profit, and loss statements.
Kumbure et al., 2022 systematically reviewed and
analyzed machine-learning literature for stock market
prediction. It found that indices and stocks in the USA
were the most investigated, while stocks linked to
health care, information technology, and consumer
discretionary were most frequently found. 2173
unique variables were used in the selected literature,
with the largest type being Technical Indicator with
1348 variables. Our review found that machine
learning-based prediction models for stock market
forecasting were based on the ANN, SVM, and fuzzy
theory. DL techniques have received much attention
in the last three years, with GAs, PCA, and wavelet
transforms being the most popular methods. All DL-
based papers have applied improved LSTM models to
predict stock market variables.
This paragraph summarizes the findings of the
literature review focused on predicting stock price
values using various DL and traditional models. The
first paper(Hu et al., 2021) comprehensively
evaluates DL models such as CNN, LSTM, DNN,
RNN, and reinforcement learning. Hybrid networks
show promise for future research. The second
paper(Islam & Nguyen, 2020) compares three models
(ARIMA, ANN, and geometric Brownian model) and
concludes that ARIMA and geometric Brownian
model outperform ANN for short-term next-day stock
price prediction. The third paper (Nikou et al., 2019)
explores four data mining techniques and finds that
RNN with LSTM performs best, while SVR has
higher precision than neural networks and random
forest. The fourth paper (Vijh et al., 2020) focuses on
predicting stock prices using ANN and RF,
suggesting including financial news articles and
parameters for improved accuracy. The fifth paper
(Vijh et al., 2020) systematically reviews machine
learning literature, highlighting the use of ANN,
SVM, fuzzy theory, and DL techniques, such as
improved LSTM models for stock market prediction.
Overall, DL methods, especially LSTM models,
demonstrate potential for accurate stock market
forecasting, while traditional models like ARIMA
and the geometric Brownian model also yield good
results in short-term predictions.
4 METHODOLOGIES
The researcher adopted an exploratory approach with
a comprehensive literature review to understand the
applicability of existing models like LSTM, ANN,
MLP, RNN, etc., to the research problem. The
following seven steps were applied to predict the
stock prices of the eight companies associated with
the NG value chain. Further, from these companies'
annual reports, the financial parameters like revenue,
net profit, EPS, BVPS, ROE, and Debt Equity ratio
were compared to plot the graphical trend for
visualizing their financial performance. The
methodology flow chart is in Figure 1.
AI4IoT 2023 - First International Conference on Artificial Intelligence for Internet of things (AI4IOT): Accelerating Innovation in Industry
and Consumer Electronics
456
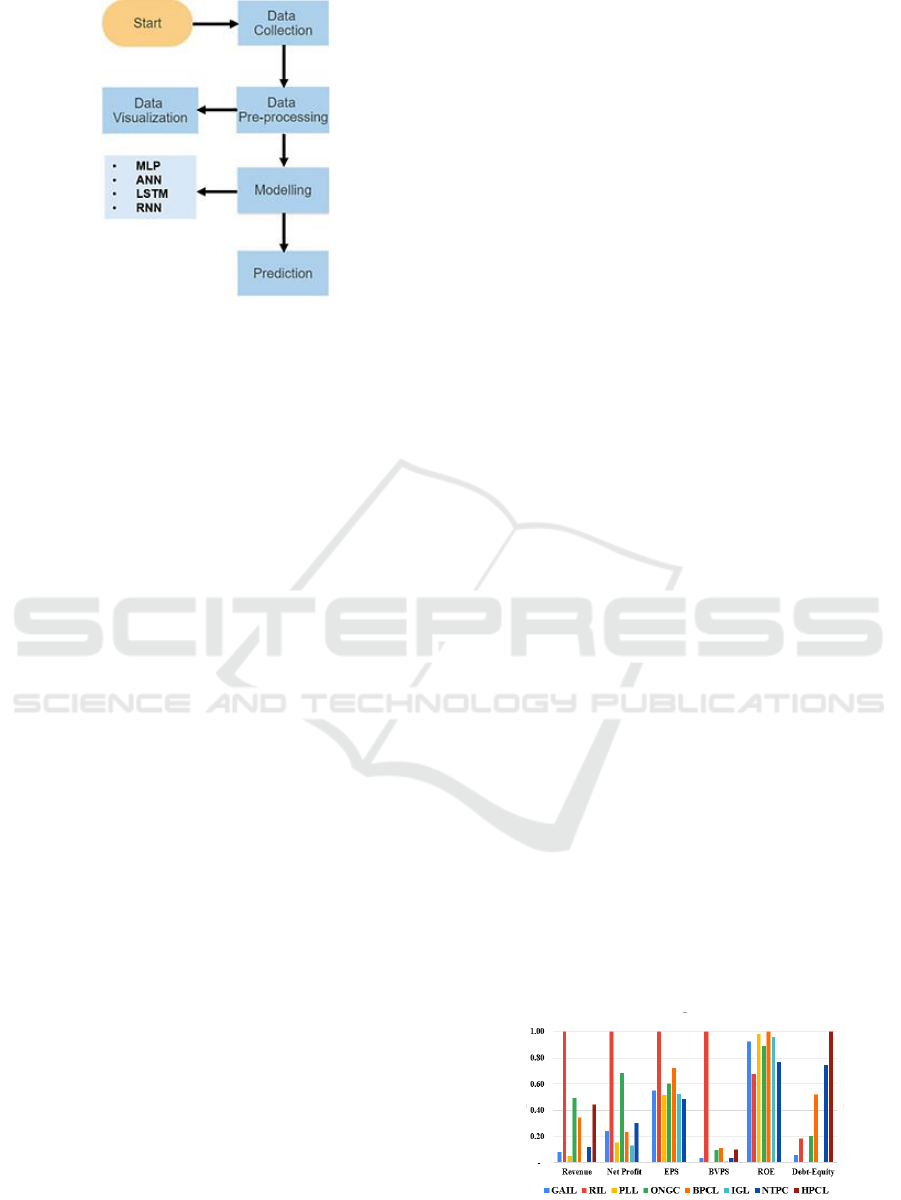
Figure 1: Methodology Flow Chart.
The seven steps are as under:
Step 1: Import the twelve Python libraries from
Google Colab applied to predict stock prices.
(i) Yahoo Finance gets
data
(ii) SweetViz
(iii) Matplotlib inline
(iv) NumPy
(v) Pandas
(vi) Seaborn
(vii) Matplotlib.pyplot
(viii) Plotly graph objects
(ix) TensorFlow
(x) Keras.models –
sequential, Model
(xi) Keras layers -
dense, LSTM,
SimpleRnn, Dense,
Dropout, Flatten,
Conc2D,
MaxPooling2D,
LeakyReLU
(xii) MLP Regressor
Step 2 Data Import: The data for the eight
companies were imported using the yahoo-finance
get data module with dates starting 1st Jan 2005 unto
14th May 2023 having one day time interval. The
Data consisted of seven attributes: Date, Open, High,
Low, Close, AdjClose (adjusted close), and
Volume(traded). The size of each company dataset
was 4546.
Step 3 Overview of the Data: SweetViz module was
used for obtaining statistical information about the
data.
Step 4 Data Cleaning: The data were cleaned by
removing null-valued entries/rows.
Step 5 Data Visualization: This section is divided
into two parts. Part one is the relation between all the
attributes, and Part two is the relation between
companies' stock values. Data Visualization was done
to display the relationship among attributes for a
company and the relationship between stocks of
different companies.
Step 6 Modelling: The modeling was done through
four techniques, namely ANN, LSTM, RNN, MLP,
by taking sixty data points at a time to predict the
sixty-first datapoint.
The ANN consists of one input layer and eleven
hidden layers. The number of neurons in each layer
was 1024, 512, 256, 128, 64, 32, 16, 8, 4, 2, and the
output layer had one neuron. The activation function
on each layer was LeakyRelu. The loss function was
mean squared error, and the optimizer Adam had a
learning rate of .01. The Number of epochs was fifty.
The Multi-Layer Perceptron model had an
activation function as Relu with 10x100 hidden layers.
The Recurrent Neural Network had one input
layer and three hidden layers. Activation for the first
three was LeakyRelu and the output layer's activation
was linear. The neurons in each layer were 1, 16, 4,
and 1. Optimizer used was Adam with a learning
rate .01 and loss function mean squared error. The
number of epochs was fifty.
The LSTM had seven layers, one input and six
hidden layers. The six hidden layers had three LSTM
layers and three dense layers. The loss function was a
mean squared error, and optimizer Adam with a
learning rate of .01 and number of epochs considered
was ten.
Step 7 Prediction: The model was tested with the
dataset of size 490. The results were plotted to make
the predictions against each model. Comparison
among the model was made based on the root mean
squared model.
5 RESULTS
The researcher has discussed the various results
obtained through applying the four different models,
which interest prospective investors in assisting in
their decision-making during investment in any of
these companies' stock suiting their short or long-
term investment objectives. The financial
performance for FY 2021-22 plotted on a min-max
scale is shown in Figure 2. The relative comparison
reveals that the revenue, net profit, EPS and BVPS
are highest for RIL. The ROE and Debt-Equity are the
highest for BPCL and HPCL, respectively. The debt-
equity is negligible for PLL.
Figure 2: Financial Performance Trend.
Deep Learning Models for Stock Price Prediction of Companies Associated with Indian Natural Gas Value Chain Underpinning Their ESG
Commitments
457
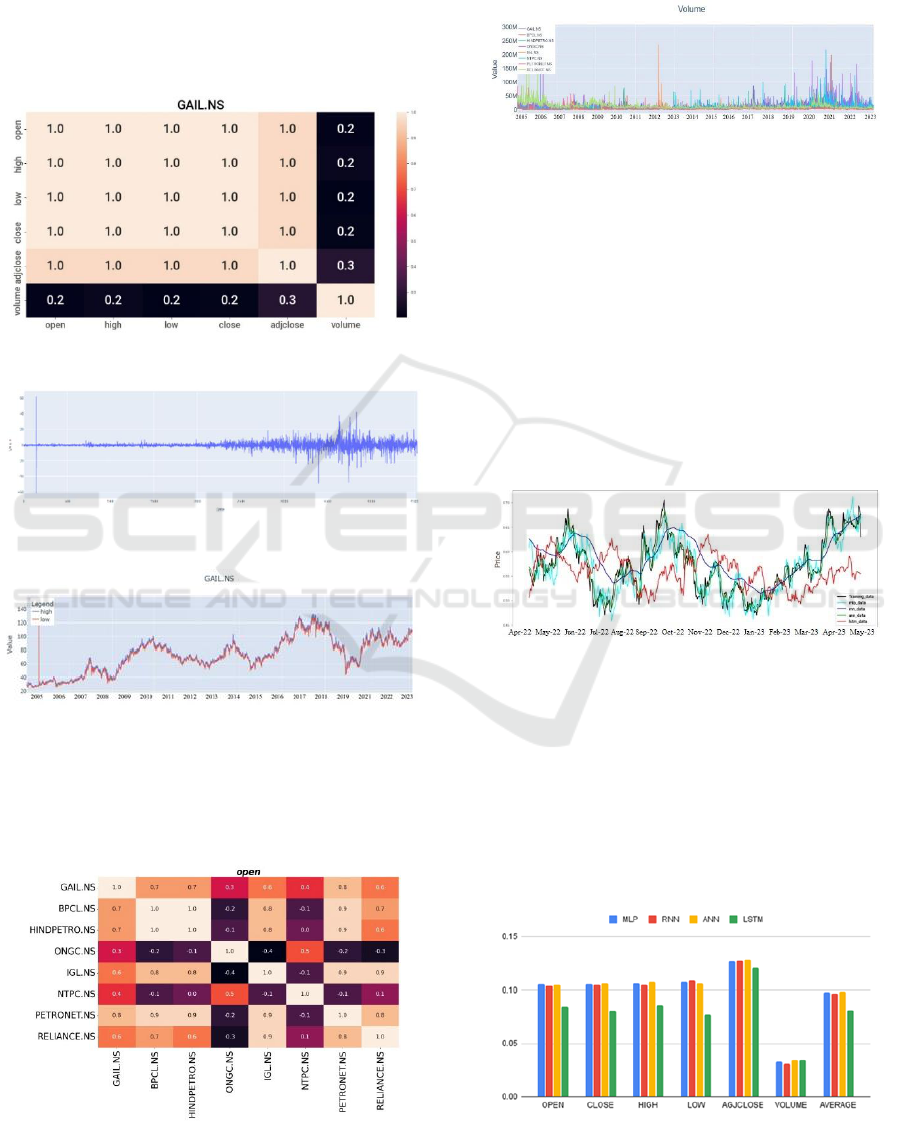
Relation Between Attributes: The relationship
between attributes for each company was obtained
from seaborn and matplotlib modules. A few sample
figures are shown. Figure 3 is the correlation heat map
with all attributes for GAIL. Figure 4 is the residual
AdjClose value for BPCL. Figure 5 is the stock price
variability for GAIL. These plots help investors make
an informed decision by viewing the visual images.
Figure 3: Correlation heat map for GAIL.
Figure 4: Residual Adj-Close for BPCL.
Figure 5: Stock price variability for GAIL.
The relationship between company’s stocks is
represented using matplotlib.pyplot. Each attribute
has one image. Figure 6 shows the correlation of
opening stock prices between companies.
Figure 6: Correlation of opening stock prices.
Volume of stock traded for all companies from 1st
Jan 2005 till 14th May 2023 is plotted using the
Matplotlib.pyplot library in Figure 7. This provides
real-time stock price comparison to the investors.
Figure 7: Volume of Stock Traded.
The stock price prediction is shown in Figure 8,
plotted using Matplotlib. The pyplot model represents
the predicted opening stock price for GAIL from 10th
April 2022 to 14th May 2023. The Black line in the
image represents the actual opening stock price, the
Cyan line represents predicted values using MLP
model, the Dark blue line represents the predicted
values of the RNN model, the green line represents
the predictions of the ANN model, and the red
represents predicted values of the LSTM model. It is
seen that the LSTM model predicts the stock prices
with the least error since the predictions are very close
to the actual values.
Figure 8: Predicted opening stock prices for GAIL all
models.
The average RMSE of stock prices based on six
attributes is in Figure 9. The RMSE obtained from
MLP, RNN, and ANN models is very close and
higher compared to the LSTM model, where the value
is comparatively smaller. So, the application of the
LSTM model by prospective investors may provide
better results, positively impacting their decisions for
investment.
Figure 9: Average RMSE for all models on all attributes.
AI4IoT 2023 - First International Conference on Artificial Intelligence for Internet of things (AI4IOT): Accelerating Innovation in Industry
and Consumer Electronics
458
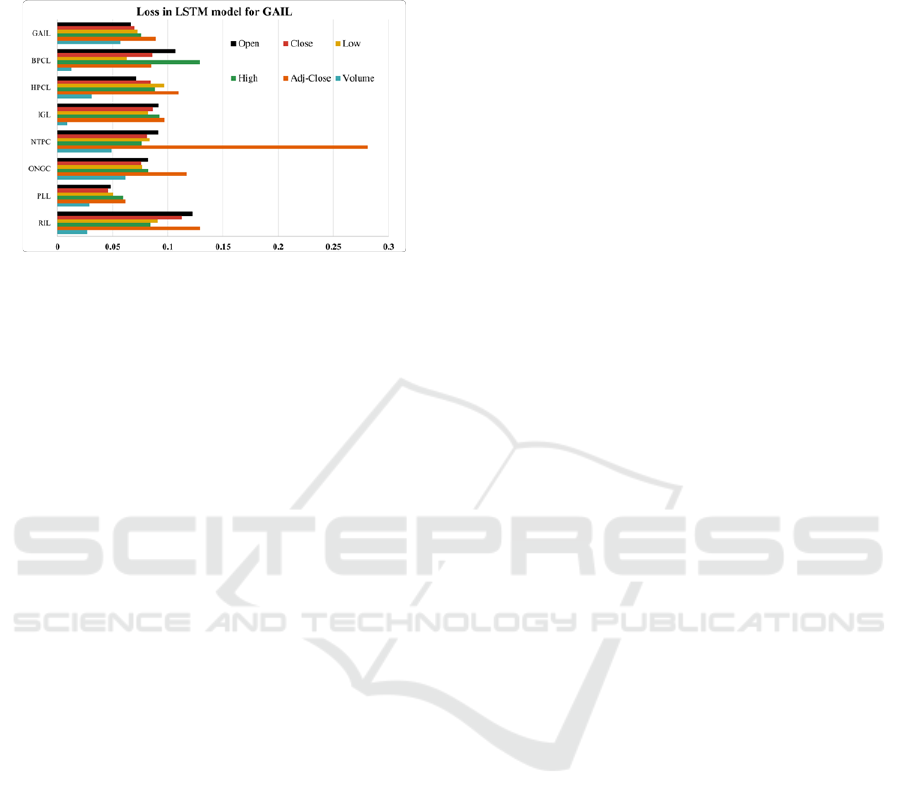
The Average of RMSE for LSTM model, which
provides the best prediction among all models, for all
companies is in Figure 10.
Figure 10: Average RMSE for LSTM Model.
6 DISCUSSION AND
CONCLUSIONS
Increasing awareness of climate change has driven
companies in the NG value chain to prioritize cleaner
energy consumption and lower carbon footprints,
aligning with investor preferences. This research
applied DL techniques to predict the stock prices of
eight Indian natural gas companies while considering
their ESG commitments. The study revealed that GAIL,
responsible for promoting SDG-7, exhibits relatively
steady stock prices despite environmental changes.
Additionally, RIL demonstrates the highest earnings
per share (EPS) in 2022, while BPCL exhibits the
highest return on equity (ROE). The LSTM model
outperforms other models in accuracy. The findings
surpass previous studies, highlighting practical
applications for prospective investors. DL models for
stock price prediction specifically applied to
companies associated with the Indian NG value chain
and their ESG commitments, hold significant practical
implications for real-world investors.
Individuals traditionally rely on various methods
to predict stock market movements, including
fundamental, technical, and sentiment analysis.
However, these conventional approaches often
struggle to capture financial markets' complex and
non-linear relationships. On the other hand, DL
models offer a more sophisticated and effective
solution for predicting stock market trends. These
models leverage the power of neural networks and
large-scale data processing capabilities to identify
intricate patterns and correlations that might not be
apparent to human analysts. These models utilize
large amounts of historical stock price data and
relevant ESG metrics to generate predictions about
future price movements. This information enables
investors to identify potential investment
opportunities aligned with their ESG commitment, as
it provides insights into companies' financial
performance and their adherence to ESG practices.
This provides a significant advantage to investors
seeking to anticipate market movements, enabling
them to make timely and informed investment
decisions, ultimately maximizing their potential
returns while minimizing risks associated with
uncertainty in the stock market. By leveraging these
models, investors gain access to advanced analytics
that can aid in making informed investment decisions.
Consequently, real-world investors can allocate their
capital in a manner that supports sustainable and
responsible business practices, aligning with their
values and contributing to a more socially and
environmentally conscious investment landscape.
The researcher found that the results obtained by
applying the ANN model provided an average RMSE
of 0.125, which is better than Vijh et al.,2020, which
showed an average RMSE of 1.528. Further, the
researcher used the 3-layer model with seven attributes
for input, including hidden and an output layer which
Vijh et al., 2020 did not use. The performance of
models in this research are better than Islam & Nguyen,
2020 that used ARIMA(0,2,1)0 model with an RMSE
of 0.14553. The researcher's model is also better than
Nikou et al., 2019 due to lower RMSE value of LSTM
model. Further comparing the results with Nikou et al.,
2019 where the RMSE value for LSTM was 0.3065, it
is seen that the current result RMSE value for LSTM is
0.090, which is better. Overall the current results are
better than previous findings offering higher reliability
and accuracy to prospective investors. The findings of
the research suggest that ESG-integrated companies
have outperformed their counterparts, indicating the
financial benefits related to ROE as also recommended
by Naeem et al., 2022. Further, results suggest that
ESG offers long-term value creation for the
shareholders, as also recommended by Zumente &
Bistrova, 2021. Since investors provide capital to
companies to expand and grow, resulting in surplus
funds to manage environmental concerns, companies
must give high importance to ESG performance to
attract global shareholders(Cornell & Shapiro, 2021).
This research paper addressed the need for accurate
stock price prediction in the context of companies
operating in the Indian NG sector. By incorporating
DL models, which have shown great promise in other
domains, the research provided enhanced predictive
capabilities for stock prices. Moreover, by
underpinning the analysis with ESG commitments, the
paper took a comprehensive approach to consider both
Deep Learning Models for Stock Price Prediction of Companies Associated with Indian Natural Gas Value Chain Underpinning Their ESG
Commitments
459

financial performance and sustainability factors, which
are increasingly influential in investment decision-
making while reducing investment risk(Hoepner et al.,
2017).
7 FUTURE WORK
Several researchers have recently applied different
models for predicting global companies' financial
performance and stock prices in diverse sectors. The
domain being contemporary, new applications with
accurate forecasting is the demand of end users.
Considering these, the researcher suggests future
work involving the following.
• Feature Engineering: Explore new techniques to
identify and extract relevant features the data. This
can provide additional insights and improve models'
performance.
• Applying Alternative Data Sources: An
Investigation to integrate alternate data sources to
capture second-period data. The Analysis will
provide unique perspectives to enhance model
prediction capabilities.
• Real-time Prediction: The Scope to develop models
conducting real-time prediction exists by streaming
real-time data using a fast interface algorithm.
• Interpretable and Explainable Models: Focus on
developing interpretable and explainable models that
can provide insights into the factors driving share
price predictions. This is particularly important for
regulatory compliance, risk management, and
gaining trust from investors and stakeholders.
• Robustness and Generalization: Enhance the
robustness and generalization capabilities of share
prediction models to handle various market
conditions, including market crashes, economic
downturns, or abnormal events. Investigate
techniques for model recalibration and adaptation to
changing market dynamics.
• Real-world Evaluation: Validate share prediction
models in real-world scenarios and compare their
performance against benchmarks and industry
standards. Conduct rigorous evaluation using
historical data and consider factors like transaction
costs, slippage, and trading volume impact.
REFERENCES
BP. (2022). BP Statistical Review of World Energy.
Cornell, B., & Shapiro, A. C. (2021). Corporate
stakeholders, corporate valuation and ESG. European
Financial Management, 27(2), 196–207.
https://doi.org/10.1111/eufm.12299
Edward, R., & Evan, M. (1990). Corporate governance: A
stakeholder interpretation. The Journal of Behavioral
Economics, 19(4), 337–359.
GAIL. (2022). GAIL (India) Limited, Sustainability Reports.
GAIL. https://www.gailonline.com/SBReports.html
Henisz, W., Koller, T., & Nuttall, R. (2019). Five ways that
ESG creates value. McKinsey Quarterly, November, 1–
12.
Hoepner, A. G. F., Oikonomou, I., Sautner, Z., Starks, L.
T., & Zhou, X. (2017). ESG Shareholder Engagement
and Downside Risk. SSRN Electronic Journal,
November. https://doi.org/10.2139/ssrn.2874252
Hu, Z., Zhao, Y., & Khushi, M. (2021). A survey of forex
and stock price prediction using deep learning. Applied
System Innovation, 4(1), 1–30.
https://doi.org/10.3390/ASI4010009
Islam, M. R., & Nguyen, N. (2020). Comparison of
Financial Models for Stock Price Prediction. Dmouj
2006. https://doi.org/10.3390/jrfm13080181
Kumbure, M. M., Lohrmann, C., Luukka, P., & Porras, J.
(2022). Machine learning techniques and data for stock
market forecasting: A literature review. Expert Systems
with Applications, 197(February), 116659.
https://doi.org/10.1016/j.eswa.2022.116659
MoEFCC. (2022). India’s Stand at COP-26. PIB, 1–2.
https://pib.gov.in/PressReleasePage.aspx?PRID=17950
71
MoPNG. (2023). Government has set target to increase share
of gas in energy mix up to 15 per cent by 2030. PIB.
Naeem, N., Cankaya, S., & Bildik, R. (2022). Does ESG
performance affect the financial performance of
environmentally sensitive industries? A comparison
between emerging and developed markets. Borsa
Istanbul Review, 22, S128–S140.
https://doi.org/10.1016/j.bir.2022.11.014
Nikou, M., Mansourfar, G., & Bagherzadeh, J. (2019). Stock
price prediction using DEEP learning algorithm and its
comparison with machine learning algorithms.
Intelligent Systems in Accounting, Finance and
Management, 26(4), 164–174.
https://doi.org/10.1002/isaf.1459
RIL. (2022). Business Responsibility Report. RIL.
http://www.ril.com/DownloadFiles/IRStatutory/Code-
of-Conduct.pdf
Sarangi, G. K. (2021). Resurgence of ESG Investments in
India: Towards a Sustainable Economy (No. 1284;
ADB Working Paper Series, Issue 1284).
www.adbi.org
Vijh, M., Chandola, D., Tikkiwal, V. A., & Kumar, A.
(2020). Stock Closing Price Prediction using Machine
Learning Techniques. Procedia Computer Science,
167(2019), 599–606.
https://doi.org/10.1016/j.procs.2020.03.326
Zumente, I., & Bistrova, J. (2021). Esg importance for long-
term shareholder value creation: Literature vs. practice.
Journal of Open Innovation: Technology, Market, and
Complexity, 7(2).
https://doi.org/10.3390/joitmc7020127
AI4IoT 2023 - First International Conference on Artificial Intelligence for Internet of things (AI4IOT): Accelerating Innovation in Industry
and Consumer Electronics
460
