
Mathematical Modeling and Optimization of System Parameters of
Feed Plant Using Machine Learning
Shakuntla Singla
a
and Komalpreet Kaur
b
Department of Mathematics and Humanities, MMEC, Maharishi Markandeshwar (Deemed to be University),
Mullana, Ambala, India
Keywords: Machine Learning Algorithms, Regenerative Point Graphical Technique (RPGT).
Abstract: In this study, RPGT is applied for mathematical modelling system constraints of cattle, poultry, and fish feed
plant and stand optimized by machine learning. The plant is made up of three grinder units (A1A2A3) that
grind three distinct raw materials into precipitate depending on the type of feed that needs to be prepared, as
well as a single cold standby (A) aimed at aimed at all these grinders, each of these grinders has a common
standby grinder that is operated by an imperfect switch-over device whose probability of successful replacing
is p, so that, if any one of the three grinders fails, the standby grinder can still input the ingredients into the
system, a mixer (B) that combines the powder by syrup, using stuffing unit and a packing (D). Optimization
of system parameters is carried out using Machine Learning Algorithms as Linear SVC Classifier (LC),
Logistic Regression (LR), and Decision Tree Classifier (DT). Tables and charts are likewise created to explain
the system's practical trend using specific situations.
1 INTRODUCTION
Due to religious restrictions, the beef and pork feed
industries in India are nonexistent, and these only
produce dairy, poultry, and aqua feeds. Numerous
feed plants have sprouted up in the NCR region
(especially Rohtak-Haryana) because of the high
standard and international standard of the feeds
produced there, as well as the abundance of materials
readily available for their production. Maize, rice
bran, groundnuts, and other raw materials are utilized
in a chicken, cow, and fish feed facility. Due to the
fertile soil and numerous rivers that bring water to the
region, the agriculture industry in the Rohtak region
is thriving. Farmers grow a wide variety of crops,
including Makka, barely, maize, wheat, and rice.
They are also engaged in fish farming and work in
other sectors. Numerous cattle feed plants, or cattle
feed plants, have sprung up in the region to
supplement the cattle feed. In addition, since fish
require water to grow and the Yamuna, and Ghaggar
rivers provide abundant water; many farmers in the
region have chosen to pursue fish farming as a
profession.
a
https://orcid.org/0009-0000-5659-2330
b
https://orcid.org/0000-0002-5713-2982
System Description. In a feed plant, there are
typically three grinders that grind the different
ingredients. Each of these grinders has a common
standby grinder that is operated by an imperfect
switch-over device whose probability of successful
replacing is p, so that, if any one of the three grinders
fails, the standby grinders can still input the
ingredients into the system. Following processing in
mixtures, the feed is transported via conveyor belts to
open fields where it is derivate, cold weighed, and
packaged. These ground in grinded are mixed with a
bonding material. Thus, in a feed plant, there are three
different types of unit grinder’s mixture and packing
units arranged in series. If any one of these flops, the
organization is in a down state, or fails. However, the
standby unit has a lower working capacity than the
main grinders, so when it is online, the plant's
working capacity is decreased.
The plant has three grinders, A
1
, A
2
, A
3
which
mills the uncooked resources there is a cold stand-in
grinder; it is swapped in through an imperfect switch-
over device to altogether these three grinders, a
blender unit B which mixes the raw resources in the
obligatory 0fraction by treacle and a considering of
158
Singla, S. and Kaur, K.
Mathematical Modeling and Optimization of System Parameters of Feed Plant Using Machine Learning.
DOI: 10.5220/0012608200003739
Paper published under CC license (CC BY-NC-ND 4.0)
In Proceedings of the 1st International Conference on Artificial Intelligence for Internet of Things: Accelerating Innovation in Industry and Consumer Electronics (AI4IoT 2023), pages 158-162
ISBN: 978-989-758-661-3
Proceedings Copyright © 2024 by SCITEPRESS – Science and Technology Publications, Lda.
stuffing unit. When the backup unit is online, the
classification operates at a reduced rate. The
arrangement malfunctions when a standby unit,
mixer, or packing repair unit fails. Performance
analysis also identifies the primary contributors to
repairable spinning machines. It has been created to
increase system availability by managing
maintenance factors and minimum maintenance and
repair rates, which are crucial to system availability.
Priority in repair to the three units is in order A>B>D
taking single repair facility is who is always available
carries out all types of repairs. System parameters are
obtained using RPGT. (Shakuntla et al., 2011)
discussed the behavior analysis of polytube using
supplementary technique; the behavior of a bread
plant was examined by (Kumar et al. 2018). To do a
sensitivity analysis on a cold standby framework
made up of two identical units with server failure and
prioritized for preventative maintenance, (Kumar et
al. 2019) used RPGT. The comparative analysis of the
subsystem failed simultaneously was discussed by
(Shakuntla et al. 2011). In a paper mill washing unit,
(Kumar et al. 2019) investigated mathematical
formulation and behavior study. PSO was used by
(Kumari et al. 2021) to research limited situations.
Using a heuristic approach, (Rajbala et al. 2022)
investigated the redundancy allocation problem in the
cylinder manufacturing plant. The tables and graphs
are created using analytical cases, and they are then
discussed and concluded.
2 ASSUMPTION AND
NOTATIONS
1. There is single repairman who is always presented.
2. The circulations of failure/repair periods are
constant and diverse.
3. Nothing can flop when organization is in
unsuccessful state.
4. The organization is conferred on behalf of
steady-state circumstances.
R
i
(t) : Reliability of the organization at
period t, specified that classification go in the un-
failed Re-forming state ‘i’ at t = 0.
μ
i
: Mean sojourn time expended in state i,
previously visiting several additional states.
𝜇
=
𝑅
𝑡
𝑑𝑡
ξ : Base state of the organization.
f
j
: Fuzziness portion of the j-state.
A/a : Unit in working state / failed state,
correspondingly for other units.
w
i
/ λ
i
: Denote repair failure rates of units
p: probability of switching successfully
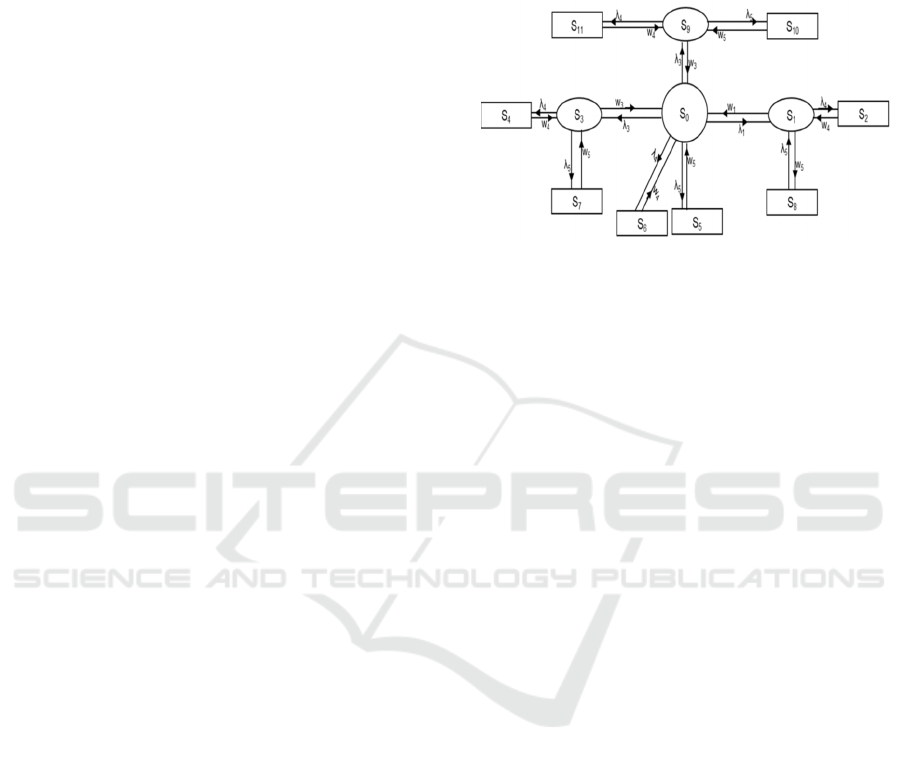
3 TRANSITION DIAGRAM
Figure 1: Transition Diagram of the feed plant.
Where various states are as under,
S
0
= A
1
A
2
A
3
BD(a); S
1
= AA
2
A
3
BD(a
0
); S
2
=
AA
2
A
3
bD; S
3
= A
1
AA
3
BD(a
2
); S
4
= A
1
AA
3
bD(a
2
); S
5
= A
1
A
2
A
3
Bd; S
6
= A
1
A
2
A
3
bD; S
7
= A
1
AA
3
Bd(a
2
); S
8
= AA
2
A
3
Bd(a
1
); S
9
= A
1
A
2
ABD(a
3
); S
10
=
A
1
A
2
ABd(a
3
); S
11
= A
1
A
2
AbD(a
3
)
3.1 Probability Density Function (Q
i,j
(t)
)
𝑞
,
= 𝜆
𝑒
𝑞
,
= 𝜆
𝑒
𝑞
,
= 𝜆
𝑒
𝑞
,
= 𝜆
𝑒
𝑞
,
= 𝜆
𝑒
𝑞
,
= 𝜆
𝑒
;𝑞
,
= 𝜆
𝑒
𝑞
,
= 𝑤
𝑒
; 𝑞
,
= 𝑤
𝑒
𝑞
,
= 𝜆
𝑒
; 𝑞
,
= 𝜆
𝑒
𝑞
,
𝑞
,
𝑞
,
= 𝑞
,
= 𝑤
𝑒
𝑞
,
𝑞
,
𝑞
,
𝑞
,
= 𝑤
𝑒
𝑞
,
= 𝑤
𝑒
; 𝑞
,
= 𝜆
𝑒
𝑞
,
= 𝜆
𝑒
Cumulative Density Functions in moving from
state ‘i’ to state ‘j’ by taking Laplace Transform
of above functions, P
ij
= q*
i,j
(t)
, for infinite time
intervals is given as under: -
𝑝
,
= λ
1
/(λ
1
+λ
3
+λ
4
+λ
2
+λ
5
),; 𝑝
,
=
λ
5
/(λ
1
+λ
4
+λ
3
+λ
2
+λ
5
),; 𝑝
,
= λ
6
/(λ
1
+λ
3
+λ
4
+λ
2
+λ
5
)
;
𝑝
,
= λ
2
/(λ
1
+λ
3
+λ
4
+λ
2
+λ
5
); 𝑝
,
=
λ
3
/(λ
1
+λ
4
+λ
3
+λ
2
+λ
5
); 𝑝
,
= λ
4
/(λ
5
+λ
2
+w
1
)
;
𝑝
,
=
λ
5
/(λ
5
+λ
2
+w
1
); 𝑝
,
= w
1
/(λ
5
+λ
2
+w
1
); 𝑝
,
=
w
2
/(w
2
+λ
4
+λ
5
); 𝑝
,
= λ
5
/(w
2
+λ
4
+λ
5
)
;
𝑝
,
=
Mathematical Modeling and Optimization of System Parameters of Feed Plant Using Machine Learning
159
λ
4
/(w
2
+λ
5
+λ
4
); 𝑝
,
= w
3
/(w
3
+λ
4
+λ
5
); 𝑝
,
=
λ
5
/(w
3
+λ
5
+λ
4
), 𝑝
,
= λ
4
/(w
3
+λ
5
+λ
4
)
3.2 Probability Density Functions Ri(t)
and Mean Sojourn Times µi=Ri*(0)
𝑅
= 𝑒
; 𝑅
= 𝑒
;
𝑅
= 𝑒
; 𝑅
= 𝑒
; 𝑅
𝑅
𝑅
= 𝑒
; 𝑅
𝑅
𝑅
𝑅
= 𝑒
;
𝑅
= 𝑒
Value of the parameter µ
i
giving Mean Sojourn
Times
µ
0
= 1/(λ
1
+λ
5
+λ
4
+λ
2
+λ
3
); µ
1
= 1/(λ
4
+λ
5
+w
1
); µ
3
=
1/(w
2
+λ
5
+λ
4
); µ
2
=µ
4
=µ
11
=µ
6
= 1/(w
4
); µ
7
=µ
5
=µ
10
=µ
8
= 1/w
5
; µ
9
= 1/(w
3
+λ
5
+λ
4
)
3.2.1 Transition Probabilities from the
Initial Vertex ‘0’ (or Base State)
V
0,0
= 1 (Verified); V
0,1
= p
0,1
/(1-p
1,2
p
2,1
) (1-p
1,8
p
8,1
)
V
0,2
=
[{λ
1
/(λ
1
+λ
5
+λ
2
+λ
4
+λ
3
)}{λ
4
/(λ
5
+λ
4
+w
1
)}]/[{1-
(λ
5
/λ
4
+λ
5
+w
1
)}]; V
0,3
= ………..Continuous
MTSF (T
0
): The working states to which system can
join from primary state ‘0’, earlier going one down
state are: ‘i’ = 2, 4, 5, 6, 7, 8, 10, 11. Taking initial
state or base state as ‘ ’ = ‘0’.
T
0
=
∑
⎯
⎯
⎯
⎯
⎯
Π
-
,
÷ 1-
∑
⎯
⎯
⎯
⎯
⎯
Π
-
(1)
= (μ
0
+{p
0,1
/(1-p
1,2
p
2,1
) (1-p
1,8
p
8,1
) μ
1
}
+{[{λ
2
/(λ
1
+λ
3
+λ
5
+λ
4
+λ
2
)}]/[{1-λ
5
(w
2
+λ
5
+λ
4
)} {1-
λ
4
(w
2
+λ
5
+λ
4
)}] μ
3
} +{[{λ
3
/(λ
1
+λ
4
+λ
3
+λ
2
+λ
5
)}]/[{1-
λ
5
(w
3
+λ
5
+λ
4
)} [{1-λ
4
(w
3
+λ
4
+λ
5
)}] μ
9
)}
Availability of the System: The states (regenerative)
classification is in partial / full working state are ‘j’ =
0, 1, 3, 9 and all states are regenerative, taking ‘ξ’ =
‘0’ the total fractional availability using RPGT is
given by
A
0
=
∑
→
,
Π
-
,
÷
∑
→
Π
-
,
(2)
=
∑
𝑉
,
,𝑓
,𝜇
∑
𝑉
,
,𝑓
,𝜇
Busy Period of the Server: The states in which
server is busy for inspection/ repairing the units are
‘j’ = 1 to 11, taking ξ = ‘0’, the using RPGT is given
by
B
0
=
∑
→
,
Π
-
,
÷
∑
→
Π
-
,
(3)
=
∑
𝑉
,
,𝑛
∑
𝑉
,
,𝜇
Expected Number of Examinations by the repair
man (V
0
): The situations where the overhaul man
visits anew are j = 1, 3, 9 the reformative states stand
i = 0 - 11, and ‘ξ’ = ‘0’,
V
0
=
∑
→
Π
-
,
÷
∑
→
Π
-
,
(4)
=
∑
𝑉
,
∑
𝑉
,
,𝜇
4 MODEL EVALUATION
To evaluate the implementation of our model
performance, we have estimated different execution
evaluation confusion matrix (Recall, Accuracy
Precision, and F1- Measure). The evaluation of model
phase proposes to appraise the generalization
precision exactness of the design model on an
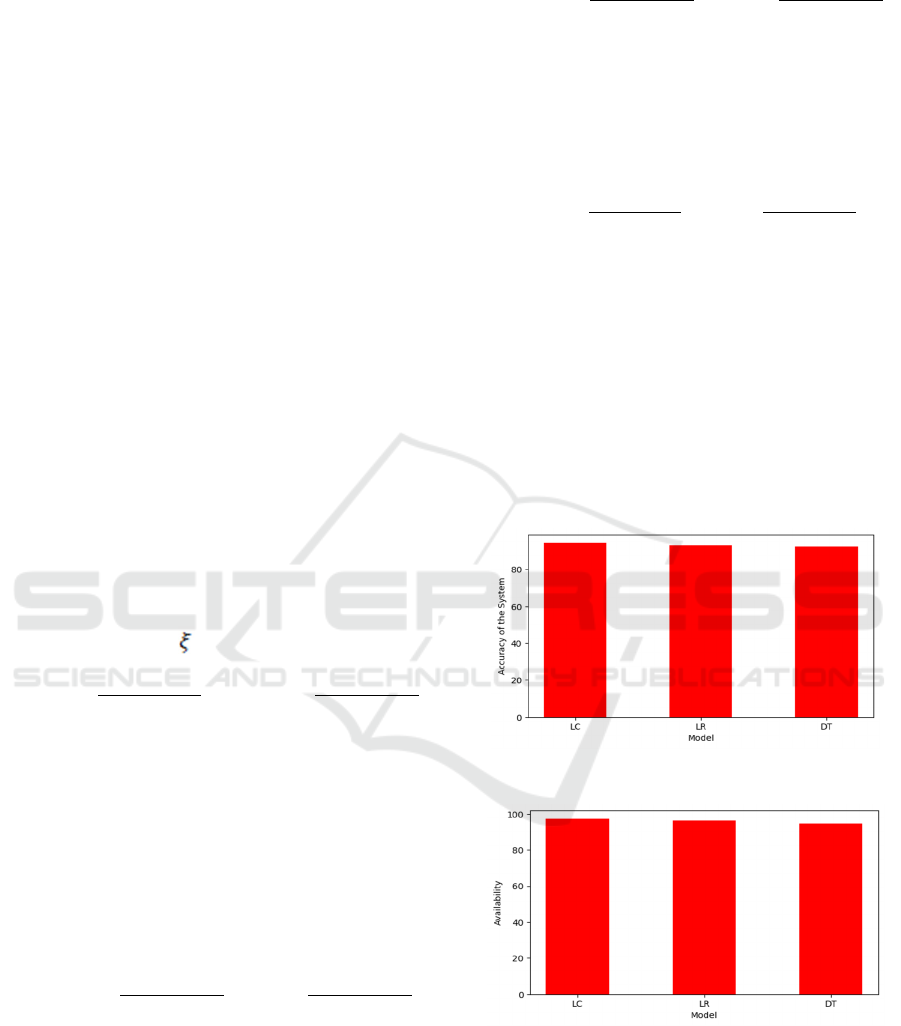
Figure 2: Comparison between Accuracy of models.
Figure 3: Comparison between Availability of models.
AI4IoT 2023 - First International Conference on Artificial Intelligence for Internet of things (AI4IOT): Accelerating Innovation in Industry
and Consumer Electronics
160
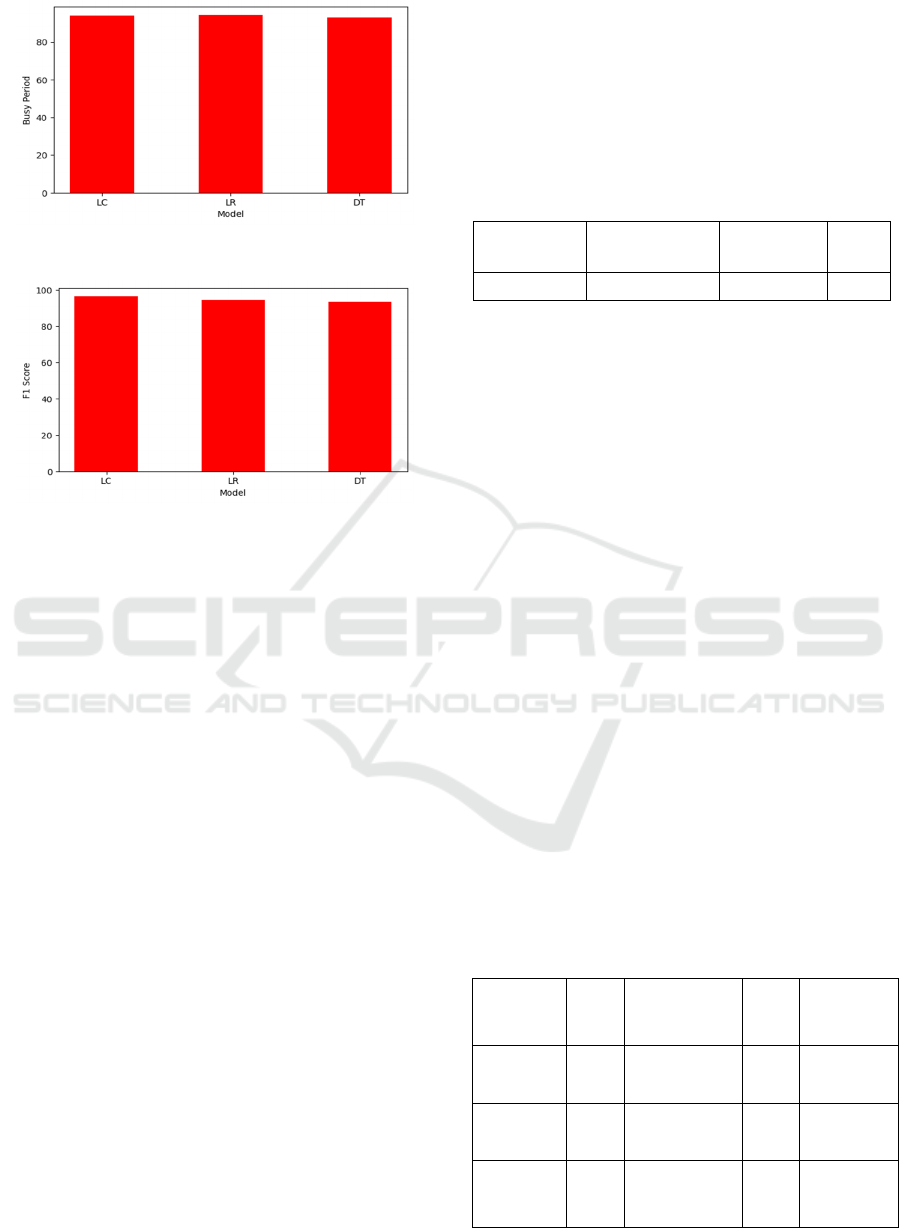
Figure 4: Comparison between Busy periods of models.
Figure 5: Comparison between F1 score of models.
Availability of the System by applying the precision,
MTSF, Busy Period, Expected Number of repair
man, that are imported from the metrics module
available into the Scikit-learn Python library that
depends on the following formula in equations 1, 2, 3
and 4 respectively. Overall, the availability analysis
is an important tool for identifying the factors that
impact the production and profitability of a feed plant
[1, 2, 3]. By understanding these factors, plant
managers can make informed decisions about
investments in equipment, raw materials, and labor
that can improve production efficiency and
profitability [4, 5, 6,].
Dataset: Availability analysis of a fish feed plant can
benefit from the use of machine learning for dataset
analysis. Machine learning algorithms can assistance
to identify decorations and trends in large datasets
that may not be closely apparent to human analysts.
This can help to improve the accuracy of the
availability analysis and enable plant managers to
make more informed decisions about how to improve
production efficiency and profitability. For example,
machine learning algorithms can be trained on
historical data from the plant to predict future demand
for feed products. This can help managers to adjust
production levels and raw material orders to match
expected demand, reducing waste and improving
profitability. Similarly, machine learning can be used
to identify patterns in raw material availability and
price fluctuations, enabling managers to optimize
purchasing decisions and reduce costs [4, 5, 6,].
Another potential application of machine learning in
availability analysis is predictive maintenance. By
scrutinizing statistics from machine beams and added
fonts, machine learning algorithms dismiss identifies
patterns that could indicate an impending breakdown
or maintenance issue.
Table 1: Table of parameter.
This can enable plant managers to schedule
maintenance proactively, reducing downtime and
improving overall equipment availability. Overall,
machine learning can remain a commanding tool for
educating the accuracy and efficiency of availability
analysis for poultry, cattle, and fish feed plant. By
enabling more accurate predictions and insights,
machine learning can help plant managers to optimize
production, reduce costs, and improve profitability in
Table 1.
5 RESULTS AND DISCUSSION
In general, availability analysis involves examining
the factors that influence the availability of a
particular product or service. For a poultry, cattle, or
fish feed plant, these factors might include the
availability of raw materials, labor, equipment, and
other resources required for production. The analysis
would also consider any constraints that might limit
the plant's ability to produce feed, such as market
demand or regulatory requirements. According to
Table 2, fig. 2, Fig. 3, Fig. 4 and Fig. 5 show,
comparison among model of linear classifier is better
than other model of machine learning.
Table 2: Performance of model.
Model MTSF
Expected
Number of visits
by repair man
Busy
Period
Availability
Linear SVC
Classifier
0.941 0.961 0.941 0.97
Logistic
Regression
0.9312 0.9412 0.942 .96
Decision
Tree
Classifier
0.9234 0.9323 0.932 .94
W (w1, w2, -----
--, wn)
ƛ
(
ƛ
1, ƛ2,…….
ƛ
𝑛 S (s1, s2, -----,
sn)
p
(0-50, 51-100) 0 to 0.1 (0-50, 51-100) (0-75)
Mathematical Modeling and Optimization of System Parameters of Feed Plant Using Machine Learning
161

Without more specific information about the plant
and the analysis conducted, it is difficult to provide a
meaningful discussion of the results. However, some
potential areas for discussion might include:
• The availability of key raw materials: If the
availability analysis identified a shortage or high
cost of key raw materials, such as soybean meal
or corn, this could have significant implications
for the plant's ability to produce feed at a
reasonable cost.
• Labor availability and skill levels: If the plant
relies on skilled labor to operate machinery and
produce feed, a shortage of qualified workers
could limit production capacity.
• Equipment availability and maintenance: If the
plant relies on specialized equipment, such as
pellet mills or extruders, any breakdowns or
maintenance issues could reduce production
capacity and profitability.
• Market demand and competition: The
availability analysis might also consider the
demand for feed products in the local market and
the level of competition from other feed
producers. If the market is saturated or demand
is low, this could limit the plant's ability to sell
its products at a profitable price.
Overall, the availability analysis is an important
tool for identifying the factors that impact the
production and profitability of a feed plant. By
understanding these factors, plant managers can make
informed decisions about investments in equipment,
raw materials, and labor that can improve production
efficiency and profitability.
6 CONCLUSION
The results of the behavior analysis can be used to
optimize the input variables for the poultry, cattle, or
fish feed plant. For poultry, cattle, or fish feed plant,
these factors might include the availability of raw
materials, labor, equipment, and other resources
required for production. By identifying which input
variables have the greatest impact on the output
variable, decision-makers can make informed choices
about which variables to prioritize for optimization.
This can help to improve the efficiency and
profitability of the industry, as well as the quality of
the final product. These insights can be used to
optimize processing parameters, improve the quality
of raw materials, and ultimately increase the
efficiency and profitability of the industry.
REFERENCES
Zhu, C. (2013). Discussion on countermeasures of supply
chain integration of fresh agricultural products in big
cities, Price Monthly, 1(1), 60–65.
Shamshirband, S, Anuar, N. B. and Patel, A. (2013). An
appraisal and design of a multi-agent system based
cooperative wireless intrusion detection
computational Intelligence technique, Engineering
Applications of Artificial Intelligence, 2105–2127.
Naphade, S. T. and Badhe, S. G. (2021). Study of smart
management system in poultry farming, Journal of
scientific Research, 65(6), 153–156.
Shalev, B. A. and Pasternak, H. (1989). Meat production
efficiencies of turkey, chicken and duck broilers,
worlds Poultry Science Journal, 45(2), 109–114.
Mosavi, A., Salimi, M., Faizollahzadeh Ardabili, S.,
R.abczuk, T., Shamshirband, S. and Varkonyi- Koczy,
A. R. (2019). State of the art of machine learning
models in energy systems, a systematic review,
Energies, 12(7), 1301.
Shakuntla, Lal, A, K., and Bhatia, S. S. (2011).
Comparative study of the subsystems subjected to
independent and simultaneous failure, Eksploatacja
INiezawodnosc-Maintenance and Reliability, 63-71.
Kumar, A., Garg, D., and Goel, P. (2019). Mathematical
modelling and behavioral analysis of a washing unit
in paper mill, International Journal of System
Assurance Engineering and Management, 1(6),
1639-1645.
Kumar, A., Garg, D., and Goel, P. (2019). Sensitivity
analysis of a cold standby system with priority for
preventive maintenance, Journal of Advance and
Scholarly Research in Allied Education, 253-258.
Shakuntla, Lal, and Bhatia S., (2011). Reliability analysis
of polytube tube industry using supplementary
variable Technique. Applied Mathematics and
Computation, 3981-3992.
Kumar, A., Goel, P. and Garg, D. (2018). Behavior analysis
of a bread making system, international journal of
Statistics and Applied Mathematics, 3(6), 56-61.
Kumari, S., Khurana, P., Singla, S., Kumar, A. (2021).
Solution of constrained problems using particle swarm
optimization, International Journal of System
Assurance Engineering and Management, 1-8.
Rajbala, Kumar, A. and Khurana, P. (2022). Redundancy
allocation problem: Jayfe cylinder Manufacturing
plant. International Journal of Engineering, Science &
Mathematic, 11(1), 1-7.
AI4IoT 2023 - First International Conference on Artificial Intelligence for Internet of things (AI4IOT): Accelerating Innovation in Industry
and Consumer Electronics
162
