
Sales Prediction Through Time Series Analysis with Machine
Learning
Kamal Kumar
1,*
, Reena Devi
1,†
and Pardeep Goel
2,*
1
Department of Mathematics, Baba Mastnath University Asthal Bohar, Rohtak, Haryana, India
2
Department of Mathematics, Himalayan Garhwal University, Uttarakhand, India
Keywords: Time Series, Sales, Machine Learning, Regression.
Abstract: In this article, we examine how machine learning models are used in sales predictive analytics. This paper's
primary goal is to investigate the key methods and research methods of applying machine learning to sales
forecasting. It has been thought about how machine learning (ML) generalization would affect things. Such
result may be used to forecast sales whenever there is just a little quantity of past records for a certain sales
time series, such as after the opening of a new store or product. Researchers have researched to create
regression groups by overlaying individual models. The results suggest that stack tactics can enhance the
prognostic accuracy of predictive methods aimed at selling period series forecasts.
1 INTRODUCTION
Modern business intelligence heavily includes sales
forecasting (Mentzer et al. 2004). A dearth of
information, incomplete information, and the
existence of extremes can make this a challenging
challenge. It is likely to contemplate about sales as a
data series. Various time series representations must
be released as of late-night, counting those through
Holt-Winters, SARIMAX, ARIMA, GARCH, etc. In
(Taieb et al. 2012), various methods of various levels
forward time series forecasting are taken into account
or contrasted. (Graefe et al. 2014) investigates a
variety of forecasting techniques. It is demonstrated
that there may be a significant improvement in
reliability when several models are derived from
various data and methods. In situations where there is
a lot of ambiguity, reliability improvement is crucial.
Numerous ensemble-based approaches for
classification issues are taken into consideration in
(Gomes et al. 2017). Various factors for efficient
prediction merging were taken into consideration in
the work. There are substantial disadvantages to using
time-series approaches for predictive analysis. The
following are: When detecting periodicity,
researchers require historical data that spans a
*
Professor
†
Research Scholar
significant amount of time. Moreover, frequently,
such as when a new model is introduced, we lack past
information for an attribute value. We can predict that
the sales trend of their product will be equivalent
because we already obtain sales time series about a
similar item. There could be numerous thrilling
values and absolute statistics facts in the sales
statistics. When smearing a period series practice,
they first eliminate outliers and try to interpret the
data. There are several external elements that affect
sales that we must consider. As practice has shown,
regression procedures can frequently outperform time
series approaches in positions of returns. Machine
learning approaches can be second-hand to search
aimed at trend in period series. With the use of
controlled machine learning techniques, we may
identify complicated trends in marketing behavior.
Regression algorithms are built on the fundamental
assumption that designs in past statistics will reoccur
in fresh datasets. We examined probabilistic, ML, and
linear methods for time series modeling in
(Pavlyshenko 2016). We investigated the custom of
copulas too Bayesian inference methods in
probabilistic modeling. We looked at logistic
deterioration in the context of the difficulty of
identifying production issues (Pavlyshenko 2016)
and (Ensafi et al. 2020).
Kumar, K., Devi, R. and Goel, P.
Sales Prediction Through Time Series Analysis with Machine Learning.
DOI: 10.5220/0012608500003739
Paper published under CC license (CC BY-NC-ND 4.0)
In Proceedings of the 1st International Conference on Artificial Intelligence for Internet of Things: Accelerating Innovation in Industry and Consumer Electronics (AI4IoT 2023), pages 163-169
ISBN: 978-989-758-661-3
Proceedings Copyright © 2024 by SCITEPRESS – Science and Technology Publications, Lda.
163
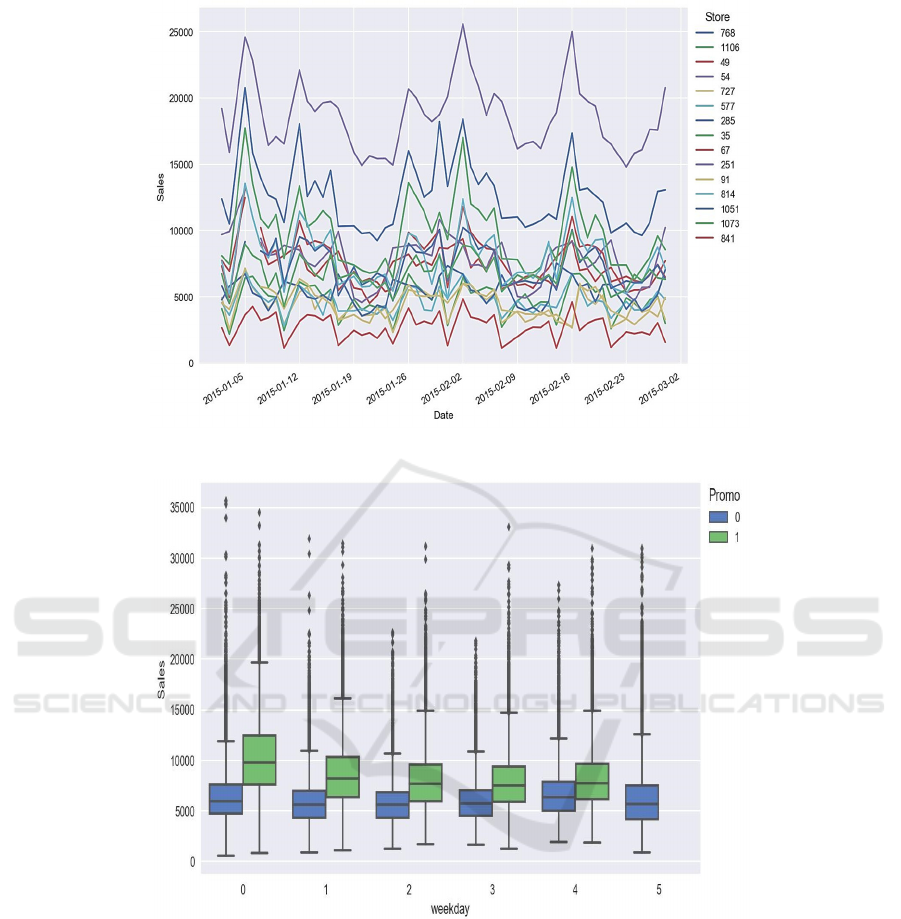
Figure 1: Typical sales time series.
Figure 2: Boxplots showing day of the week vs sales distribution.
We looked at extended linear models, and Bayesian
models aimed at logistic deterioration. (Shafali et al.
2021) his paper explores a combined inventory model
(IM) when the collapse rate shadows histrionic
movement under conversation acclaim. (Kumar et al.
2020) studied on the Inventory Control Policy aimed at
Imperfect Manufacture Procedure on Numerous
Demand. In (Pavlyshenko 2018), we looked at stacking
methods for logistic regression and time-series
forecasting with severely skewed data. We can spot a
variety of trends and impacts in the sales figures. They
are: themes, periodicity, covariance, and structures
generated by the influence of outside variables like
promotions, prices, and rivals' actions. Additionally, we
notice sales turbulence. The elements we don't take into
consideration contribute to noise. We could also find
outliers extreme values in the sales figures. If risk
assessment is necessary, noise and extreme values
should be considered. Some special elements, such as
promotional events, price reductions, climatic
conditions, etc., might be the source
of
outliers.
We
may
offer
a
new
feature
that will draw attention to
AI4IoT 2023 - First International Conference on Artificial Intelligence for Internet of things (AI4IOT): Accelerating Innovation in Industry
and Consumer Electronics
164
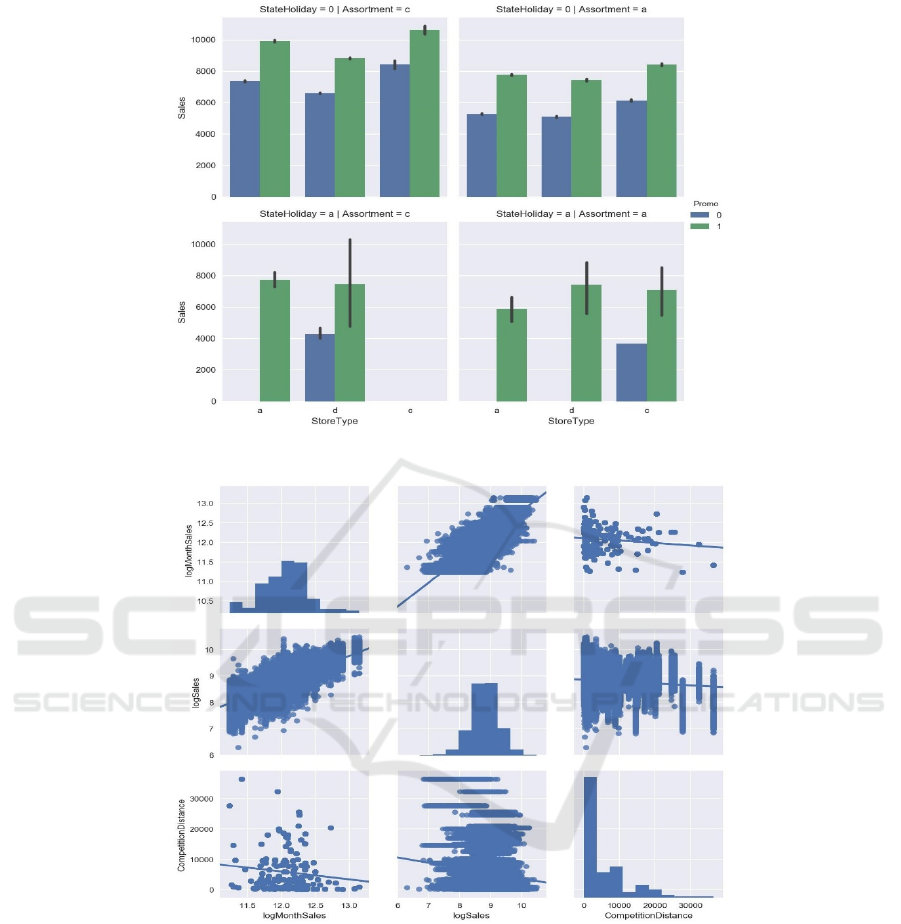
Figure 3: Sales factor charts for total sales.
Figure 4: Plots of the data for the competition distance, sales, and month sales in pairs.
to these specific events and explain the target
variable's remarkable values if they happen
frequently. In this study, we look at how ML
algorithms could be used to predict sales over time.
The effects of ML generalization, the influence of a
single model, and the stacking of many models will all
be taken into account.
2 PREDICTIVE MODELS OF
ARTIFICIAL INTELLIGENCE
As part of their study, we looked at past shop sales
information of the "Rossmann Store Sales" Kaggle
competition. Such numbers show shop sales for
Rossmann. The calculations relied primarily on the
following Packages numpy, pandas, sea born, sklearn,
matplotlib, and eras. The research was carried out
using
Jupyter Notebook. The sales time series in
Sales Prediction Through Time Series Analysis with Machine Learning
165
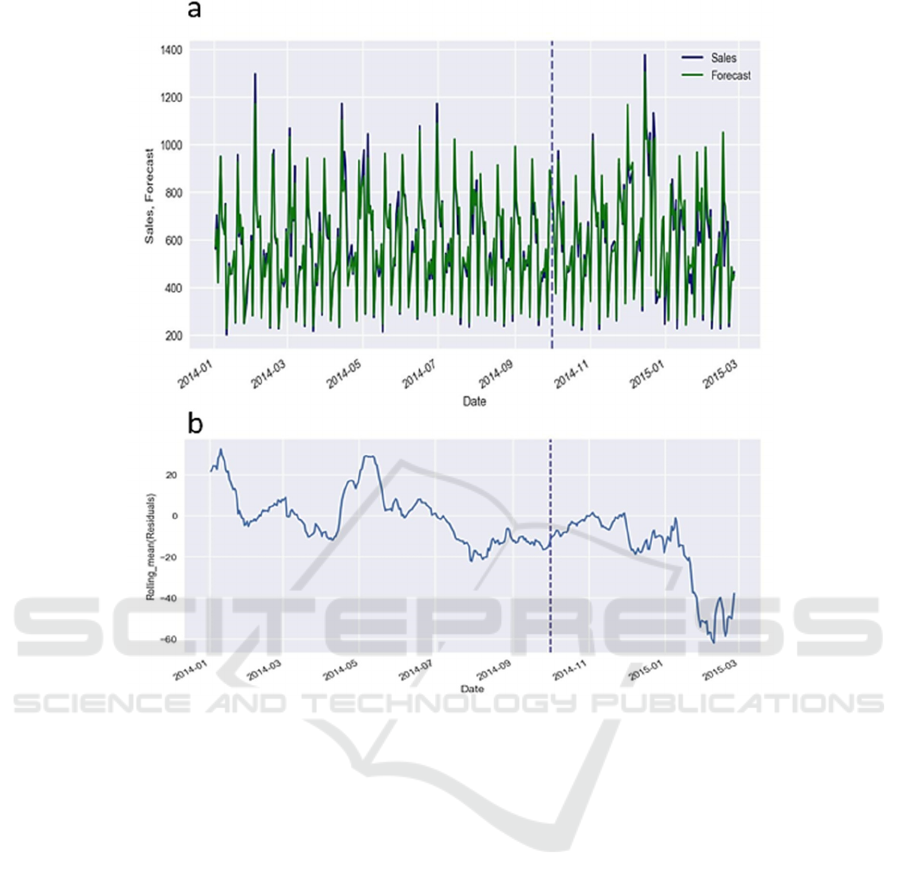
Figure 5: (a) Forecasting of sales with a 3.9% train set error and an 11.6% validation set error 5(b) Feature significance.
Figure 1 are typical; the numbers are standardized
to arbitrary units. The first step in our advanced
analysis process was to analyses sales distributions
and visualizes the data using different pair plots.
Identifying connections and the factors that influence
revenue is useful. The outcomes of the data
exploration are displayed in Figures 2–4. The fact that
almost all machine-learning techniques are limited to
being with use of stationary data is one of their unique
characteristics. If there is a little pattern, we may use
linear regression also on confirmation set to identify
bias. Let's take the supervised machine learning into
consideration when employing sales previous time
series. We had used Random Forest method to the
research study. We utilized the categorical variables
of the promo, every-day, month day, and month as
variables. We used one-hot decoding for categorical
features, which involved replacing one category
factor with n binary variables, somewhere n is the
number of categorical variables' distinct standards.
The projection for such Figure 5a displays sales time
- series data. The projections for Figure 5 depicts the
time - series data of sales. The characteristic
significance is portrayed in Fig. 5b. We employed a
relative mean absolute error (MAE), which is defined
as error = MAE/mean 100%, for error estimate.
Whenever the prediction is expected to be lower or
higher than real values, we may see bias in the
prediction, which is a consistent (stable) under- or
overestimation of revenue. Whenever non-stationary
sales are subjected to machine learning techniques,
this frequently manifests itself. On the validation set,
we may use linear regression to carry out the bias
correction. The efficiency of an exercise dataset and
an authentication set must be distinguished from one
another. It could be extremely high on the exercise set
but significantly lower on the authentication set. In
ML algorithms, the number of rounds is largely
determined by how reliable is the “validation set”.
AI4IoT 2023 - First International Conference on Artificial Intelligence for Internet of things (AI4IOT): Accelerating Innovation in Industry
and Consumer Electronics
166
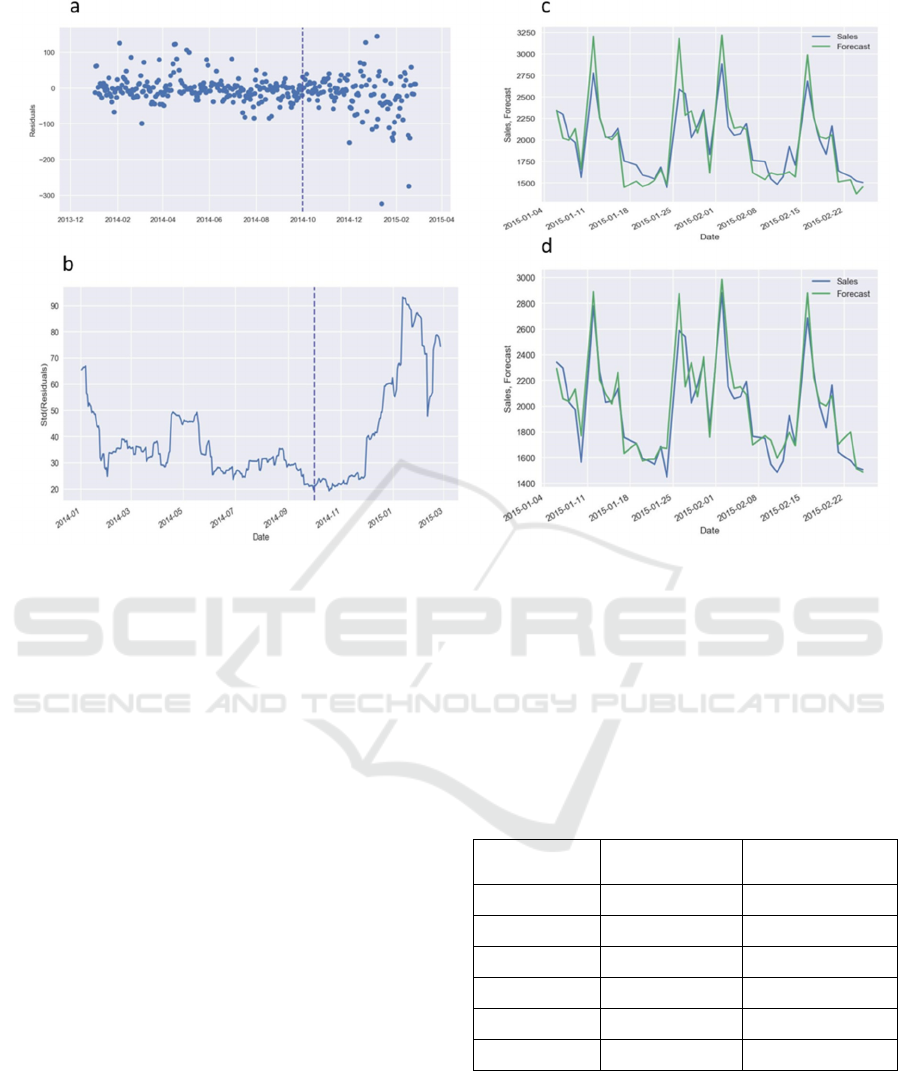
Figure 6: (a) Forecasting of sales with a 3.9% train set error and an 11.6% validation set error 5(b) Residuals' continuing mean
(c) and(d) sales forecast's standard deviation.
3 THE IMPACT
GENERALIZATION IN
MACHINE LEARNING
As a result of ML generality, a regression method
may detect trends that exist among all firms or
commodities. If the sales have stated trends,
generalization allows us all to acquire more detailed
results that really are unaffected to auctions noise. We
employed more of the following characteristics in the
machine-learning generalization research study
compared to the last research study: school and state
holidays, shop selection, and average market
valuation for a certain span of time, according to
historical information. Figure 10 depicts the
prediction for statistical information with a large time
horizon (3 years) for a particular store, whereas
Figure 6d depicts prediction for past records with a
short horizon (4 days) for the exact same store. In
cases of short period intervals, we dismiss obtain
extra precise answers. Whenever we introduce a new
service or shop, it is essential that we are able to make
predictions, even with a relatively limited amount of
past sales figures, thanks to the influence of machine
learning generalization. In command to allow for
transitory operations, such as the procedure of
product cannibalization, where new items replace
existing goods, we may apply professional
corrections whenever predicting the sales of brand-
new items by increasing the forecast by a time-
dependent coefficient.
Table 1: Many models' forecasting errors.
Validation Error
Out-of-Sample
Error
Model
13.6% 11.3% Neural Network
13.4% 11.5% Lasso
13.6% 11.9% Random Forest
13.8% 11.4% ARIMA
14.6% 13.9% Extra Tree
12.6% 10.2% Stacking
Sales Prediction Through Time Series Analysis with Machine Learning
167
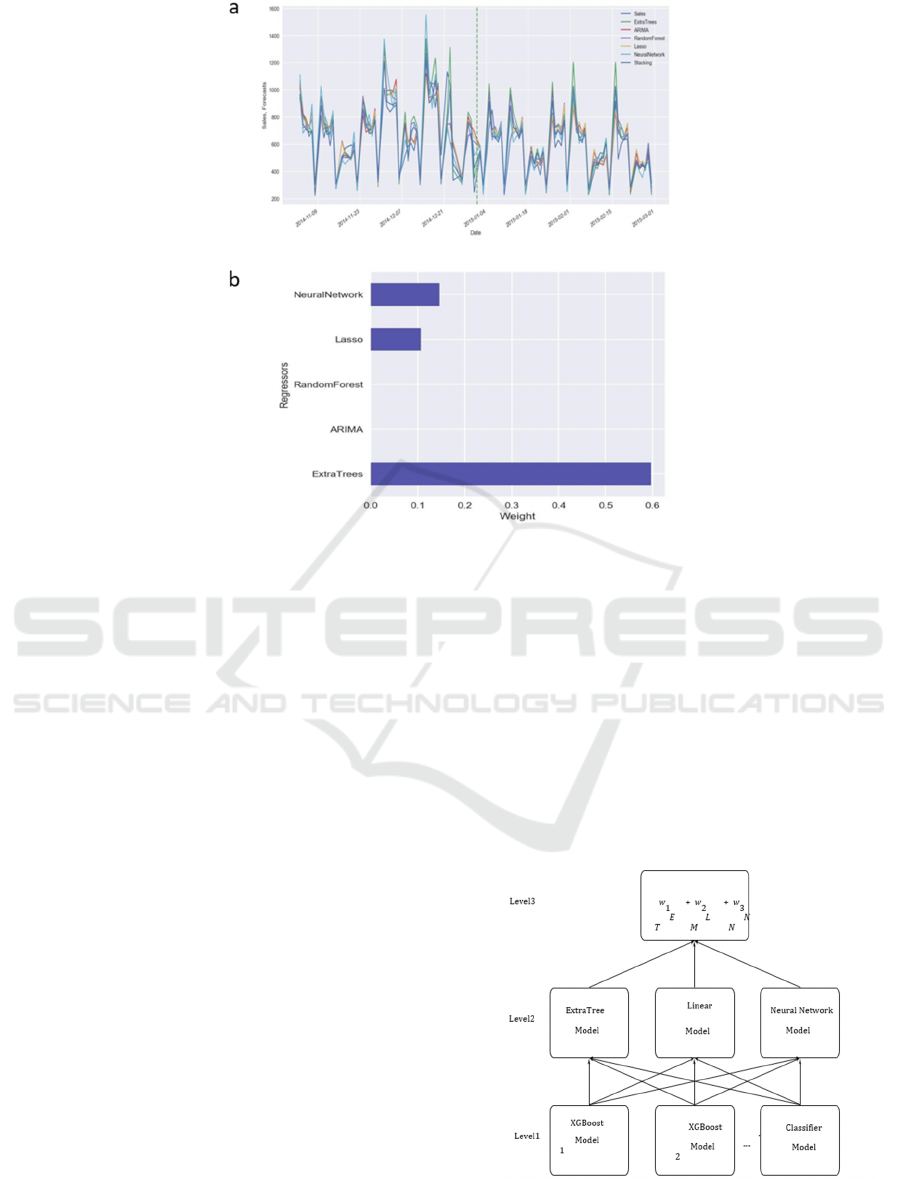
Figure 7: (a) Time series forecasting utilising several models on the authentication sets (b) Repressor weight stacking.
4 STACKING OF
MACHINE-LEARNING
MODELS
The findings from many prediction models
containing various feature sets should be combined
into one. The outcomes of the assumptions made on
the testing dataset are considered input in such a
method repressors of models for the following level
we may take into account a linear model, such as the
following level model, or a different type of machine
learning technique, such as random woodland or
neural networks. It is crucial to note that for the
scenario of time series calculation, we cannot apply a
traditional cross-validation method. Instead, we
obligation use period excruciating to rift a sequential
statistics set into exercise and testing sets, by the
supervised learning falling during the first period
retro and the validation data falling within the second.
Prediction of time - series data on the procedures for
assessing derived using various models are displayed
in Figure 7a&b. The out-of-sample set and the
validation set, that are not utilized during model the
following is required, are divided by a vertical dotted
line in Figure 7a &b Stacked errors may be calculated
using the out-of-sample set in equation (1).
Y=w1ET+w2LM+w3NN (1)
Where ET= extra tree model, LM =Linear model,
NN= neural network model,
The linear model with Lasso regularisation treats
predictions made on the endorsement gangs as
repressors. The results of the second-level Lasso
deterioration model are shown in Figure 7b. Only
three models (Extra Tree, Lasso, and Neural
Network) from the initial level contain coefficients
that are not zero. The outcomes may change if
alternative models play a more significant role in
predicting for various situations of sales datasets.
Figure.8: 2019 IEEE Forecasting sales period series by a
multilevel machine learning model Reprinted with
approval from Bohdan Pavlyshenko.
AI4IoT 2023 - First International Conference on Artificial Intelligence for Internet of things (AI4IOT): Accelerating Innovation in Industry
and Consumer Electronics
168

The mistakes on the out-of-sample set and the
validation set are displayed in Table 1. These findings
demonstrate that the stacking method may increase
accuracy for both the validation and the output data.
Some businesses submit their analytical
challenges for data science contests, such as those at
Kaggle (2018), in order to get insights and discover
fresh strategies. Grupo Bimbo Inventory Demand was
one of these contests. This competition's aim
remained to estimate inventory demand. I remained
an associate of the outstanding team, "The Slippery
Appraisals," that won this tournament. Our winning
solution's specifics may be found in (Chen et al.
2016). Our response is stranded in a three-level model
(Figure 8). We employed several solitary models at
the first level, the mainstream of which were built
using XG Boost machine learning process. For the
second level of layering, the Extra Tree modeling as
well as the linear regression model from of the Python
scikit-learn package are utilized, in addition to the
model of neural networks were used. On the third
level, the outcomes since the second level are added
by weights. The most important of the numerous
additional structures we created founded upon be
around the target mutable with its interruptions when
group by various morals. Anil et al. (2023) has further
information. (Kaggle et al.2018) contains a
straightforward R script with a ML model.
5 CONCLUSIONS
We inspected various ML approaches for period
series forecasting during our investigation study.
Deterioration instead of period series examination
would be the improved method aimed at foreseeing
sales. Regression models may typically produce
better results for forecasting demand than time-series
techniques. Intended for machine learning
procedures, productivity on the corroboration
established is a decisive criterion aimed at indicating
the right numeral of restatements. ML generalization
has the impact of identifying patterns crossways the
whole dataset. When there are few past sales data
aimed at an exact sales Time series, like the launch of
a new store or product, this effect can be used to
forecast sales. Several expected numbers from the
authentication set remain used as contribution
repressors aimed at the ensuing level replicas in the
loading strategy. Quality may be increased by using
piling to account aimed at dissimilarities in the results
from numerous models through many sets of
strictures on the out-of-sample data sets and
validation.
REFERENCES
Mentzer, J. T. and Moon, M. A. (2004). Sales Forecasting
Management: A Demand Management Approach. Sage
Publication, Inc. DOI: https://doi.org/10.41
35/9781452204444
Taieb, S.B., Bontempi, G., Atiya, A.F., and Sorjamaa, A.
(2012). A review and comparison of strategies for
multi-step ahead time series forecasting based on the
NN5 forecasting competition. Expert Syst. Appl., 39,
7067–7083.
Graefe, A., Armstrong, J. S., Jones, R. J., Jr., and Cuzán, A.
G. (2014). Combining forecasts: An application to
elections. Int. J. Forecast, 30, 43–54.
Gomes, H. M., Barddal, J. P., Enembreck, F., Bifet, A.
(2017). A survey on ensemble learning for data stream
classification. ACM Comput. Surv. (CSUR), 50, 1-23.
Pavlyshenko, B. (2018). Using Stacking Approaches for
Machine Learning Models. In Proceedings of the 2018
IEEE Second International Conference on Data Stream
Mining & Processing (DSMP). IEEE, 255–258.
Kaggle (2018). Competition ’Grupo Bimbo Inventory
Demand’ Bimbo XG Boost R Script LB: 0.457.
Available online: https://www.kaggle.com/ bpavlyshen
ko/bimbo-xgboost-r-script-lb-0-457 (accessed on 3
November 2018).
Anil, G. A., Shankar, C. R., Santosh, B. P., Rajendra, G. A.
and Thorat, B. D. (2023). Sales Forecasting Using
Machine Learning Techniques. International Research
Journal of Modernization in Engineering Technology
and Science, 1882-1885.
Ensafi, Y., Amin, S. H., Zhang, G. and Shah, B. (2020).
Time-series forecasting of seasonal items sales using
machine learning – A comparative analysis.
International Journal of Information Management Data
Insights, 2(1), 1-10.
Shafali, C., Vikas, S. and Pardeep, G. (2021). Role of
manufacturing process in waste reduction and
contribution in environmental sustainability,”
International conference on recent innovation and
interdisciplinary research, 150-157, 2021.
K. Kumar, A. Kumar and Promila (2020). Inventory
Control Policy for Imperfect Production Process on
Various Demand and Fuzzy Nature: Latest Trend,
International Journal of Trade & Commerce-IIARTC,
9(1), 148-158
Sales Prediction Through Time Series Analysis with Machine Learning
169
