
Prediction of Breast Cancer Using Classification Algorithms
Harshitha R.
*
and S. Manju Priya
†
Department of Computer Science, Karpagam Academy of Higher Education, India
Keywords: Breast Cancer, SVM Algorithm, Data Science, R Program.
Abstract: Breast cancer is the most widespread aliment in women, an average of 1,78,000 new cases have been
diagnosed every year. The work done in this research paper has been tested using the Breast cancer Data sets.
This study was carried out to analyze Breast cancer data using the SVM algorithm. Support Vector Machine
& Naïve Bayes algorithm are the two classifiers used in this research. The algorithms effectiveness, timeliness
and precision are evaluated. Based on the findings, the optimal classification strategy for categorising breast
cancer is chosen.
1 INTRODUCTION
Compared to other cancer kinds, breast cancer occurs
more frequently, especially in women. In the
glandular tissue of the breast, this cancer type
develops in the lining cells (epithelium) of the ducts
(85%) or lobules (15%).
To lower the death rate, breast cancer must be
discovered and treated early. The most prevalent type
of cancer worldwide is Breast cancer, with 7.8 million
people alive as of the end of 2020 who had received
a diagnosis in the previous five years. Breast cancer
comes in two forms: invasive and non-invasive.
Cancerous and malignant, invasive spreads to other
organs. Precancerous and non-invasive, benign it stays
in the original organ. It ultimately progresses to
aggressive breast cancer. Many breast cancer
identification techniques have been developed in
recent years, and their effectiveness has been
confirmed. The accuracy and time of the performances
were compared, and it was shown that SVM's
robustness contributed to its high accuracy rate.
The most often utilised data mining techniques in
the healthcare industry are categorization approaches.
The specific application that is trained using the
existing data set is the classification model. With this
idea Support Vector Machine & Naïve Bayes
algorithm available in R package are studied. An
analysis of above two algorithms has been done based
on their accuracy, performance and timing.
*
II MSc
†
Professor
2 LITERATURE REVIEW
Several machine learning techniques have been
suggested by different researchers to detect breast
cancer. Here, we spoke about a few different ways
others researched to diagnose breast cancer. Dr. R.
Vijaya Kumar Reddy, et.al., (Reddy 2020) showed
the effectives of techniques and extraction of
techniques. Lina Alkhathlan, et.al. (Namik Kemal
2018) has done a comprehensive analysis of recent
research on ML to help researchers. Md. Milon Islam,
et.al, [5 Suggested that a clinical aid for the diagnosis
of Breast cancer could be provided by machine
learning technique (Senapati et al 2013). Kemal has
shown multilayer perceptron method with high
accuracy rate (Amin et al 2021). Amin Ul Haq, et.al.
For the purpose of accurately identifying BC, the
proposed technique is simple to integrate into e-
healthcare systems. Juneja K, et.al., has enhanced the
weighted decision tree technique for predicting breast
cancer (Jhajharia et al 2016). Muhammet Fatih Ak,
employing data visualization and machine learning
applications, evaluated the identification and
diagnosis of breast cancer. The key benefit of LR is
that it produces correct results in complicated
algorithms and is very effective at training.
276
R, H. and Priya, S.
Prediction of Breast Cancer Using Classification Algorithms.
DOI: 10.5220/0012613600003739
Paper published under CC license (CC BY-NC-ND 4.0)
In Proceedings of the 1st International Conference on Artificial Intelligence for Internet of Things: Accelerating Innovation in Industry and Consumer Electronics (AI4IoT 2023), pages 276-280
ISBN: 978-989-758-661-3
Proceedings Copyright © 2024 by SCITEPRESS – Science and Technology Publications, Lda.
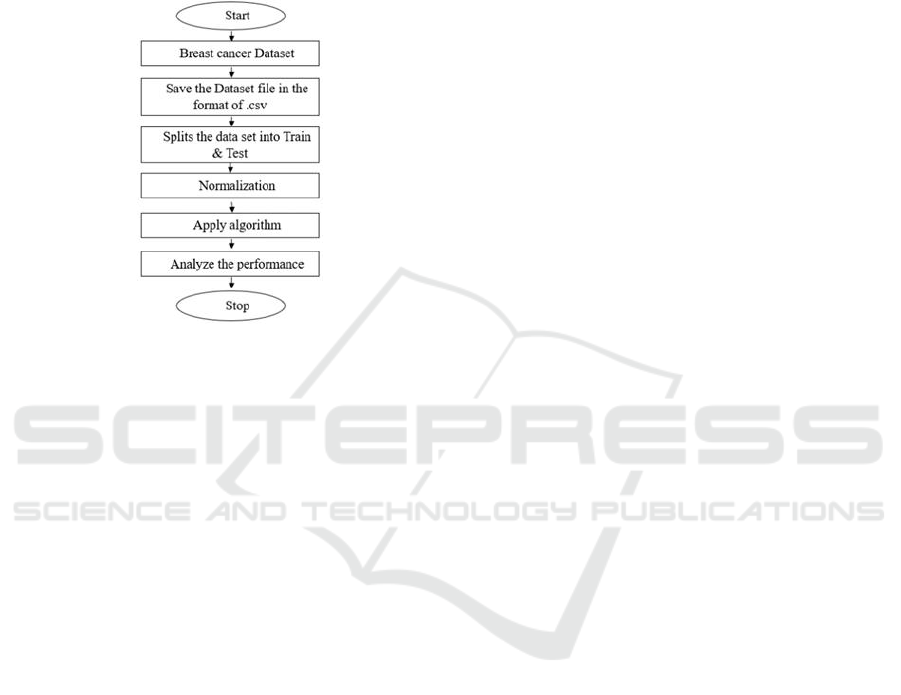
3 METHODOLOGY
The main objective of the work is to assess the
effectiveness of the two algorithms that were selected
for the investigation and identify which algorithm is
most suitable. The second objective is to conduct an
investigation into Breast cancer using particular data.
Figure 1: Flow chart of the proposed method.
The Breast Cancer dataset was used to implement
the study using SVM (Support Vector Machine
Algorithm). Among the R-based classification
approaches available, SVM was chosen because of its
quick findings and high accuracy level.
Here the data set for this classification has been
taken from Breast Cancer Wisconsin (Diagnostic)
Data Set (WBC), from UCI machine learning
repository is a classification dataset, which records
the measurements for Breast Cancer Cases.
4 RESULTS AND DISCUSSIONS
This research report analysed classification systems
and offered a basis for accuracy percentage
comparisons between them. The confusion matrix is
used to calculate the effectiveness level.
And the R programming language, which is
supported by the R core and used for statistical
computing and graphics, was utilized to implement it.
One of the most popular programming languages for
data research is R. R comes with a large number of
pre-installed packages, and each of these packages
contains a collection of functions for various analyses
and graphical displays.
Support Vector Machine (SVM) algorithm has
been applied since its accuracy level and working
process is better than the other algorithm used for the
study, The algorithm known as supervised machine
learning (SVM) evaluates and divides data into one
or more categories. Since SVM can handle both
classification and regression on both linear and non-
linear data, it is one of the machine learning
techniques we use. It is used in applications like
Recognition, Detection, and Classification. Naive
Bayes Algorithm is kind of simple probabilistic
Bayesian-Based classification technique. Statistical
independence is utilised by a family of machine
learning algorithms, not by a single one. This is
mainly used for text classification. Statistical
classifiers include, for example, Bayesian classifiers.
They are able to forecast the likelihood that a
given set of data will belong to a certain class. The
cornerstone of Bayesian classification is the Bayes
theorem. The results of the study are as follows from
the algorithm SVM. At first the overall frequency
level is analysed from the dataset, to know the
frequency level in both Benign & Malignant. Figure
2a shows the overall average of women affected in
Benign & Malignant. This means there is a 1in 10
chance a woman will have breast cancer and this also
means there is 8 in 10 chance a woman will won’t be
affected by Breast cancer. The incidence of
Malignant increases in 2
nd
decade to 5
th
decade and
100% in the 8
th
decade. The incidence of Malignant
increases with age with a maximum incidence in the
older age group. Figure 2b shows Correlation Matrix
is a graphical display to find potential relationships
between variables and to understand the strength of
these relationships. This is an effective tool for
compiling a sizable dataset and for finding and
displaying data trends. Figure 2c shows the Concavity
of Benign vs Malignant, where Concavity in medical
term mean the ranges from the stage 1 to stage 4,
which mean the cancer has spread more. So, this
result shows the range of Malignant is higher than the
range of Benign. Since the concavity mean is most
important attribute in breast cancer, indicates the
shape & color to identify the disease. Concave
represents the number of indentations present on the
nuclear border.
Figure 2d shows Fractional Dimension in breast
cancer analyses the breast tissue specimens provides
a clearance of tumor growth patterns. It is an
objective and measure of the complexity of the tissue
of specimen. This helps to shoe how scaling changes
a model or modelled object. This have been measured
using the formula D=log N/log S. This has to be
measured to see how completely the fractals embed
themselves.
Prediction of Breast Cancer Using Classification Algorithms
277
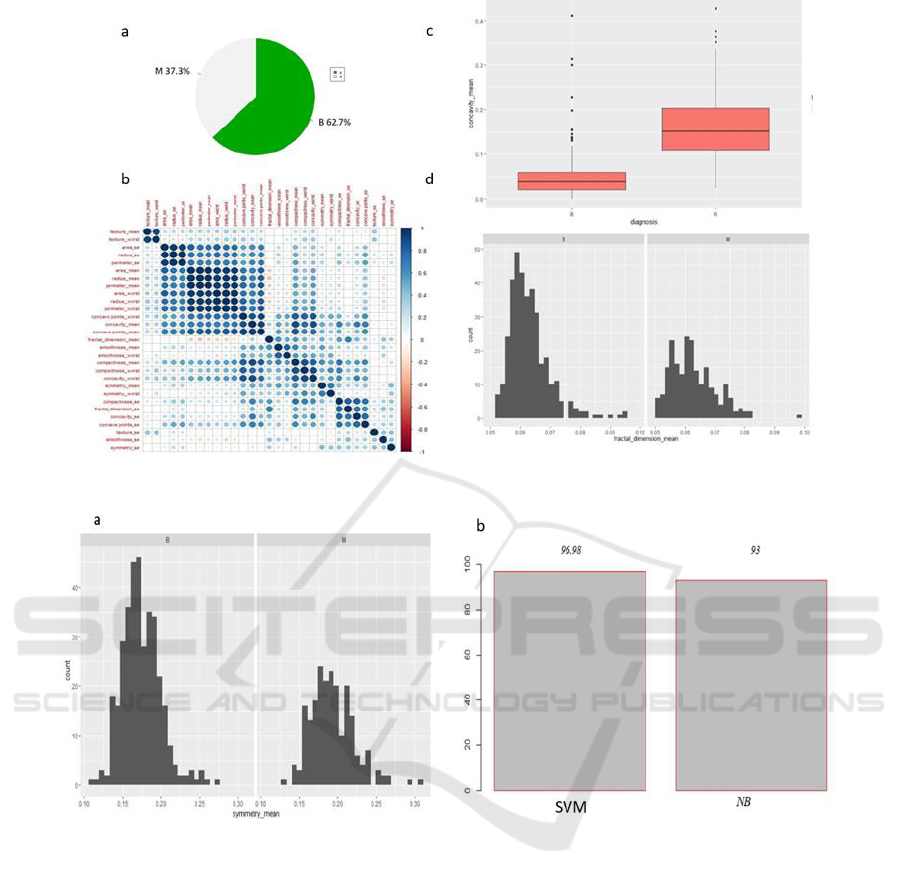
Figure 2: (a) overall average of women affected in Benign & Malignant; (b) Correlation Matrix; (c) Concavity of Benign vs
Malignant; (d) Fractional Dimension in breast cancer.
Figure 3: (a) Symmetry means of breasts; (b) Accuracy levels.
Fig 3a shows the breasts are generally symmetric
in their density and architecture. Some studies have
shown women with breast cancer had a greater breast
asymmetry. This shows at a different position,
volume and form of the breasts.
While deducting in Naïve Bayes the accuracy
level was 93%. So SVM is better compared to Naïve
Bayes.
The Classifier, Accuracy and the Error level of the
SVM algorithm are:
Classifiers:
svm(formula=diagnosis~.,data=training_set,type=’C
-classification’, kernel=’linear’)
Parameters:
SVM-Type: C-classification
SVM-Kernel: Linear
Cost: 1
Support Vectors: 24
Accuracy: 96.98%
Error: 0.30%
5 CONCLUSIONS
Using classification techniques, one can reliably
predict the early breast cancer detection. In this
research paper SVM C-classification method were
compared and suggested as one of the best that can
outperform the competition. It is observed that among
the two algorithms compared namely “SVM” and
“Naïve Bayes”, considering the performance metric
accuracy, which stands out from the other employed
AI4IoT 2023 - First International Conference on Artificial Intelligence for Internet of things (AI4IOT): Accelerating Innovation in Industry
and Consumer Electronics
278

measures, "SVM" is the best. The "SVM" method has
the highest precision (1), leading us to draw the
conclusion that it is the best choice for cancer
analysis. To further improve the classification of
breast cancer, we will apply other classification
algorithms and additional data sets in the future.
Table 1.
Attribute Name
Attribute Description
Values
Id
Identification Number for Each
and Every Patient
(0-9)
Diagnosis
Breast Tissue Diagnostic (M =
Malignant, B = Benign)
M&B
(0&1)
Radius _Mean
Average Separation Between the
Centre and the Perimeter’s Point
(0-9)
Texture_Mean
Standard Deviation of Values in
Gray Scale
(0-9)
Perimeter_Mean
Core Tumor's Average Size
(0-9)
Smoothness_Mean
Mean of Localised Radius
Length Fluctuation
(0-9)
Compactness_ Mean
Perimeter2/Area-1.0
(0-9)
Concavity_Mean
Average Degree of Contour's
Concave Areas' Severity
(0-9)
Concave _Points _Mean
Average for the Proportion of
The Contour That’s Concave.
(0-9)
Fractal_Dimension_Mean
Mean for “Approximation of
The Coastline”-1
(0-9)
Radius_Se
The Mean of The Centre-To-
Point Grids 3*3 Distances
Standard Deviation
(0-9)
Texture_Se
Grey-Scale Values Standard
Deviation Standard Error
(0-9)
Smoothness_Se
Standard Deviation for Regional
Differences in Radius Length
Grid 3*3
(0-9)
Compactness_Se
Standard Error for Perimeter^2 /
Area - 1.0
(0-9)
Concavity_Se
Standard Error for Severity of
Concave Potions of the Contour
Grid_3*3
(0-9)
Concave_Points_Se
Standard Deviation for the
Quantity of Concave Parts of the
Contour
(0-9)
Fractal_Dimension_Se
“Coastline Approximation”
Standard Error=1
(0-9)
Radius_Worst
Highest or "Worst" Figure for
the Average Distance Between
the Centre and Points on the
Periphery
(0-9)
Texture_Worst
The “Worst” or Largest Mean
Standard Deviation for Gray
Scale Values
(0-9)
Smoothness_Worst
The Worst Value, or Greatest
Mean Value, for Differences in
Radius Lengths by Region
(0-9)
Compactness_Worst
The Perimeter2 / Area - 1.0
Mean Value That Is "Worst" Or
Largest Is 1.0
(0-9)
Concavity_Worst
"Worst" or Greatest Mean Value
for The Degree to Which the
Contour Is Concave
(0-9)
Concave Points_Worst
The Number of Concave
Contour Segments “Worst” or
Greatest Average Value
(0-9)
Fractal_Dimension_Worst
The Biggest or Worst Mean
Value for "Coastline
Approximation" was 1.
(0-9)
REFERENCES
Vijay kumar Reddy, Shaiksubhani, G. Rajesh Chandra, B.
Sriniva Rao “Breast cancer classification
methodologies, International Journal of Emerging
trends in engineering research, Vol 8, No 9, 2020.
Lina Alkhathlan1 and Abdul Khader Jilani saudagar
“Machine Learning Methods for Breast Cancer
Analysis: A Systematic Literature Review, IJCSNS
International Journal of Computer Science and
Network Security, Vol. 20 No.6,2020.
Md. Milon Islam, Md. Rezwanul Haque, Hasib Iqbal, Md.
Munirul Hasan, Mahmudul Hasan, and Muhammad
Nomani Kabir “Breast cancer prediction: A
comparative study using machine learning techniques”
SN Computer Science, 2020.
Namık Kemal University, Çorlu Engineering Faculty
“classification and diagnostic prediction of breast
cancers via different classifiers” International scientific
and vocational journal (ISVOS) Vol 2, 2018.
Ebrahim Edriss Ebrahim Ali1, Wu Zhi Feng “Breast Cancer
Classification Using Suppssort Vector Machine and
Neural Network” International Journal of Science and
Research (IJSR), 2014.
Senapati, Mohanty Ak, Dash S, Dash PK. Local linear
wavelet Neural Network for breast cancer recognition.
Neural comput Apppl, 2013.
Amin Ul Haq, Jian Ping Li, Abdus Saboor, Jalaluddin
Khan1, Samad Wali2, Sultan Ahmad3, (Member,
IEEE), Amjad Ali4, Ghufran Ahmad Khan5, And
Wang Zhou6 “Detection of Breast Cancer Through
Clinical Data Using Supervised And Unsupervised
Feature Selection Techniques” Ieee Access ,2021.
Jhajharia S, Verma S, Kumar R. A cross-platform
evaluation of various decision tree algorithms for
prognostic analysis of breast cancer data. In: Proc.
International conference on inventive computation
technogies (ICICT), 2016.
Muhammet Fatih Ak “A Comparative Analysis of Breast
Cancer Detection and Diagnosis Using Data
Visualization and Machine Learning Applications”
Healthcare,2020.
M. M. Islam, H. Iqbal, M. R. Haque, And M. K. Hasan,
‘‘Prediction of Breast Cancer Using Support Vector
Machine And K-Nearest Neighbours,’’ In Proc. IEEE
Region Humanitarian Technol. Conf. (R-Htc),2017.
Senapati, Panda G, Dash Pk. Hybrid approach using KPSO
and RLS for RBFNN design for breast cancer detection.
Neural comput Appl. 2014.
Prediction of Breast Cancer Using Classification Algorithms
279

Juneja K, Rana C. An Improved weighted decision tree
approach for breast cancer prediction. In: International
journal of Information technology, 2018.
V. Chaurasia, And S. Pal, “A Novel Approach for Breast
Cancer Detection Using Data Mining Techniques”,
International Journal of Innovative Research In
Computer And Communication Engineering, Vol.2,
2014.
A. T. Azar and S. A. El-Said, ‘‘Probabilistic Neural
Network for Breast Cancer Classification,’’ Neural
Comput. Appl., Vol. 23.
F. Ahmad, N. A. M. Isa, Z. Hussain, And S. N. Sulaiman,
‘‘A Genetic Algorithm-Based Multi-Objective
Optimization of An Artificial Neural Network
Classifier for Breast Cancer Diagnosis,’’ Neural
Comput. Appl., Vol. 23.
R. Sheikhpour, M. A. Sarram, And R. Sheikhpour,
‘‘Particle Swarm Optimization for Bandwidth
Determination and Feature Selection of Kernel Density
Estimation-Based Classifiers in Diagnosis of Breast
Cancer’’, Appl. Soft Comput, Vol 40.
A. H. Osman and H. M. A. Aljahdali, ‘‘An Effective of
Ensemble Boosting Learning Method for Breast Cancer
Virtual Screening Using Neural Network Model,’’
IEEE Access, Vol. 8, 2020.
C. A. Peña-Reyes and M. Sipper, ‘‘A Fuzzy-Genetic
Approach to Breast Cancer Diagnosis’’, Artif. Intell.
Med., Vol. 17, No. 2.
AI4IoT 2023 - First International Conference on Artificial Intelligence for Internet of things (AI4IOT): Accelerating Innovation in Industry
and Consumer Electronics
280
