
Support Vector Machine for Crop Yield Prediction Towards Smart
Agriculture
Meenakshi
1
, G. Annalakshmi
2
, Domenic T. Sanchez
3
and Malik Jawarneh
4
1
Apeejay Stya University Sohna, Haryana, India
2
Department of Computer Science and Engineering, Koneru Lakshmaiah Education Foundation, KL (Deemed to be
University), Hyderabad, Telangana, India
3
Cebu Technological University-NEC, Cebu, Philippines
4
Gulf College, Muscat, Oman
Keywords: Smart Agriculture, Artificial Intelligence, Crop Yield, Prediction, Accuracy.
Abstract: Agriculture is absolutely necessary for the continued existence of the human race. The agriculture industry
provides a living for a great number of people in a great number of countries. People now have access to a
more diverse range of options when it comes to their job trajectories. In spite of the fact that conventional
farming brings in pitiful returns in today's market, many farmers harbour a deep-seated yearning for the less
complicated times of days gone by. Agriculture production can be increased by agribusinesses by
concentrating on high-yielding crop varieties and investing in the infrastructure required to support those
types. Forecasting agricultural production requires taking into account a number of factors, including climate,
soil health, the availability of water, crop pricing, and consumer demand. It would be difficult to predict
agricultural production based on factors such as location, climate, and harvest season without the assistance
of machine learning. Agricultural productivity can be influenced by factors such as location, climate, and
harvest season. However, the development of this technology may make it feasible. Farmers can use this
instrument to discover which types of plant life would be most successful in a particular setting. This paper
describes architecture for the use of machine learning in agriculture for the purpose of predicting crop yields.
Crop yield data set is used for experimental work. Accuracy, sensitivity and specificity are used to compare
the performance.
1 INTRODUCTION
Farmers must consider water and market needs when
choosing crops. Irrigation pattern, precipitation
distribution, and soil physical, biological, and social
features affect food harvestability (Grossman, 2017).
Optimizing decision parameters to analyze farmers'
production and price returns must account for
component uncertainty. Agricultural managers must
decide what to cultivate, where to plant it, when to
harvest it, where to store it, and how to sell it. Before
planting, farmers won't know next season's weather,
crop potential, market price, or supply and demand
dynamics. Farmers use their own knowledge and
government data to choose the best crop (Sharma et
al, 2021).
Ecological considerations affect farm output
more. These factors influence agricultural output
throughout space and time. Understanding
agricultural yield stochasticity is crucial. Accurate
agricultural production projections help nations plan
for supply and demand, choose crop insurance, and
boost exports. Low crop yields might result from a
lack of understanding about weather and rainfall
hazards, soil nutrient depletion, a shortage of
affordable manure, pests, post-harvest failure, and
more. Prediction models anticipate yields. Computer
equations can predict climate elements including
temperature, precipitation, solar radiation, and
humidity and assess their effects on agricultural.
Time series was used to study crop yield. Machine
learning, an area of artificial intelligence, draws from
several fields. Mathematics, information theory,
statistics, computer science, and other AI fields are
examples. Machine learning studies aim to develop
fast, efficient learning algorithms that can predict
data. Machine learning can construct data analytics
prediction models. Machine learning includes
Meenakshi, ., Annalakshmi, G., Sanchez, D. and Jawarneh, M.
Support Vector Machine for Crop Yield Prediction Towards Smart Agriculture.
DOI: 10.5220/0012614900003739
Paper published under CC license (CC BY-NC-ND 4.0)
In Proceedings of the 1st International Conference on Artificial Intelligence for Internet of Things: Accelerating Innovation in Industry and Consumer Electronics (AI4IoT 2023), pages 541-545
ISBN: 978-989-758-661-3
Proceedings Copyright © 2024 by SCITEPRESS – Science and Technology Publications, Lda.
541

supervised, unsupervised, and reinforcement
learning. Reinforcement learning teaches computers
new tasks by showing them their real-world results.
Unsupervised machine learning uses cluster analysis
to analyze unlabeled data. Training supervised
machine learning requires labeled data. Every
labelled training data set has input values and a
predicted output value (Raghuvanshi et al, 2022). A
supervised learning method examines data to create
an inferred function for mapping unknown values.
Reinforcement learning is best for decision-making,
while unsupervised and supervised learning are best
for data analysis (Zamani et al, 2022).
The study seeks to determine crop yield factors.
In actuality, many factors determine harvest size.
Ecological and economic factors affect it.
Multivariate analysis is often used to investigate
many potential confounding factors (MVA). Linear
regression, factor analysis, canonical correlation, and
principal component analysis are used in agricultural
research to find hidden correlations.
Section 2 presents literature survey of various
techniques for crop yield prediction. Section 3
portrays methodology for accurate crop yield
prediction. Section 4 presents results and discussion.
Section 5 contains conclusion and future work.
2 LITERATURE SURVEY
Since massive amounts of data are now available in
many fields, natural resource management must use a
variety of computational methods and digital
technology. Data mining, big data analytics, cloud
computing, and ERP are used to study limits to better
long-term resource management. A literature
research can help you make sense of the mass of data
you have, analyze and interpret it using the best
models, and utilise it. New perspectives on the
obstacles and the project's potential impact are
revealed.
This article reviews and evaluates major
international, national, regional, and local research
and case studies on using digital technologies to
analyze crop yield parameters to better understand its
nature, magnitude, and complexity. This will help
understand the work.
Environmental factors like unexpected weather
disasters and economic considerations like market
demand and supply can affect crop productivity. In a
world with limited resources, crop productivity must
increase to fulfill population growth and food safety
needs. Thus, studying the variables that affect crop
yields and the models that best forecast them is
crucial. Grain storage and farm productivity
improvements would boost India's agricultural
production (Choudhary et al, 2020), benefiting its
domestic and international markets.
In 2011, wheat crops rose 6.4% to 85.9 million
metric tonnes. In 2011, global rice production rose
7% to 95.3% of the previous year's total (Veenadhari
et al, 2014). India was the seventh largest agricultural
exporter and sixth largest net exporter in 2013 with
$39 billion in agricultural exports. Agriculture,
forestry, and fisheries contributed 13.7% to GDP
(Patel et al, 2014).
Authors mapped the optimum agricultural
climates using transient, spatial, and spatiotemporal
data mining. Longitudinal data, big data quantity,
non-linear dependency, unexpected behavior, and
minimum and maximum threshold values were
potential hurdles. Reading about similar historical
situations may assist guide your future studies and
predictions (Ganguly et al, 2022).
Researchers provided a detailed ecological
systems and power plants caused environmental
shifts that inhibited infrastructure development.
Contemporary Earth System Models (ESM) were
performed at unacceptable spatial targets to examine
the effects in the limited area. Analysis was the goal.
Statistical downscaling can be utilized for regional
forecasts. Atmospheric senses are used for low- and
high-resolution mapping. Downscaled predictions
varied in accuracy and reliability based on observable
options. The climate system's spatial-temporal
characteristics necessitated image processing and
statistical downscaling. SRCNN technology for
downscaling climatic variables was described in this
paper. 20 ESM models were downscaled under
different emission scenarios (Sharma et al, 2022).
Researchers demonstrated a lightweight
computing platform that simulates and visualizes
massive data sets. An ICT platform gives researchers
a "simple-to-coordinate" general tool for remote data
administration. Scalable cloud computing and
industry-standard web technologies that work across
a variety of clients and platforms underpin the
architecture. Specifically, before and after
representation, 3D data set compression and
interpretation, combined virtual conditions, and
CAD/E application analysis needed improvement. In
chemical process design, the CAD/E stage produced
from academic applications and contextual research.
Computer-aided design/engineering is CAD/E
(Kumar et al, 2022).
Data-driven firms like "Natural Resource
Management" (NRM) profit tremendously from
government programs that provide precise ecological
AI4IoT 2023 - First International Conference on Artificial Intelligence for Internet of things (AI4IOT): Accelerating Innovation in Industry
and Consumer Electronics
542

data on the internet. Analytic tools can now
meaningfully mix public data sources with
neighborhood data. With government datasets,
private data use could improve these applications.
NRM agency data must be easily accessible and able
to be coupled with online data to maximize internet
data resources. NRM organizations can share data
and manage teams via the internet. This web-based
technique allows all field researchers to be data
stewards and investigators (data democratization).
The NRM sector lacks industry-wide performance
data for cost-benefit calculations (Gupta et al, 2022).
3 METHODOLOGY AND
RESULTS
Methodology consists of three machine learning
algorithm. These algorithms are KNN, support vector
machine and naïve bayes.
In a variety of different research, the K-NN
classifier has been used to arrange the data. The
process of data sorting and categorisation may be
accomplished in a broad variety of ways using pattern
recognition. K-Nearest Neighbours (K-NN) is a
classification approach that is based on the distance
between training samples. Learning by events is
shown via the K-NN algorithm. When a locally
estimated function is utilised, the calculations are
delayed until after the process of classification is
finished. The investigation was carried out by
(Guruprakash et al, 2022). KNN is the strategy to
classification that should be used where there is very
little information available on the distribution of the
data. In the process of pattern classification, the K-
Nearest Neighbour approach is often used. It has been
shown via a variety of studies that make use of
distinct data sets that the KNN computation yields
very good results.
When K is equal to one, the rule known as the
Nearest Neighbour (NN) rule applies. This is the most
basic form of the KNN rule. In order for this method
to be successful, the samples first need to be arranged
into clusters according to the similarities they share.
This method may be used to create an educated
prediction about the classification of the sample even
when the classification of the sample's closest
neighbours is unknown. By using both the training set
and the query sample, one is able to calculate the
distance that exists between the samples in the
training set and the samples in the query set.
Therefore, it is possible to determine the
identification of the enigmatic sample by comparing
it to its categorisation.
In a support vector machine (SVM) model, each
data point is represented by a point in k-dimensional
space (where k is the number of features). The total
of all the values that may be found at each coordinate
is the value of the feature. The process of
categorisation often begins with the selection of an
appropriate hyperplane that can effectively partition
the classes. Since its conception, Vapnik's Steering
Voting Machine (SVM) has attracted the attention of
researchers from all corners of the world. The
majority of the time, an SVM classifier will take a
collection of previously acquired data and utilise it to
build two distinct groups from the data. A model for
the classification of test data is developed as soon as
the classifier has been trained on some training data.
The problem of what is known as "multiclass
classification" would arise every once in a while.
Because of this, the use of several binary classifiers
will be required. Studies have shown that support
vector machines, often known as SVMs, are more
accurate in determining categories than other
classification techniques (Datubakka et al, 2022).
According to the outcomes of the trials, the
performance of SVMs is superior to that of other
kinds of classifiers. The efficacy of the SVM, on the
other hand, is very variable and depends heavily on
the dataset in addition to the values that are utilised
for the cost and kernel parameters. This algorithm has
a lot of different kernel functions, including: The
three most common types are called polynomial,
linear, and gaussian radial basis functions,
respectively. There is no such thing as a kernel that
does not include either the sigmoid or the tangent.
The Naive Bayes method is a basic approach for
choosing problem occurrence class labels from
feature value vectors. This method is used in the
process of creating classifier models. These
classifiers are learned not using just one method, but
rather a variety of approaches, all of which have a
fundamental concept in common. If we just have
access to the class variable, then there is no way for
us to determine which of the characteristics is more
essential than the others (Wang, 2022).
It is possible to train naive bayes classifiers while
they are learning under supervision, and this is
possible for certain types of probability models. In
many contexts, the maximum likelihood method may
be used in lieu of bayesian probability or other
bayesian techniques to estimate the parameters of the
naïve bayes model. This is because maximum
likelihood takes into account the most information
about the data. Naive Bayes classifiers are supervised
Support Vector Machine for Crop Yield Prediction Towards Smart Agriculture
543
learning algorithms that make use of the Bayes
theorem in combination with the "naive" assumption
that all pairs of attributes may be considered
independent of one another.
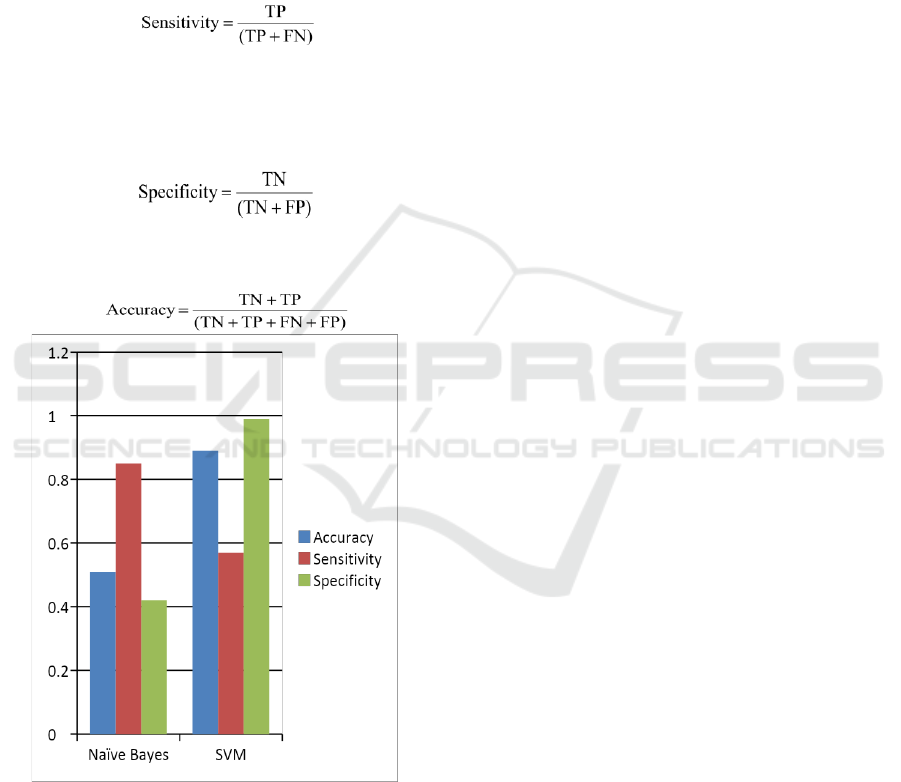
Data set used in the study is available at kaggle.
Accuracy, sensitivity and specificity are used to
compare the performance. The performance
comparison of different classifiers is shown in figure 1.
Sensitivity:
Where TP stands for True Positive and FN stands
for False Negative
Specificity:
Where TN stands for True Negative and FP stands
for False Positive
Accuracy
Figure 1: Result Comparison of Classifiers for crop yield
prediction.
4 CONCLUSION
A potential increase in agricultural yields for
agribusinesses may be achieved by carefully selecting
the most productive crops and putting in place the
supporting infrastructure. Agricultural predictions
take into account a broad variety of factors, such as
the weather, the state of the soil, the amount of
available water, the cost of the crops, and the level of
consumer demand. Without the application of
machine learning, it is difficult to predict agricultural
productivity based on characteristics such as location,
weather, and harvest season. It is possible for farmers
to utilise this instrument to better assess what kind of
crops will perform best on their land. As a result of
this study, we have developed a model for using
machine learning to predict agricultural yields. The
experimental data set contains data pertaining to the
crop as well as other information.
REFERENCES
S. R. Grossman et al., “Systematic dissection of genomic
features determining transcription factor binding and
enhancer function,” Proceedings of the National
Academy of Sciences, vol. 114, no. 7, 2017.
doi:10.1073/pnas.1621150114
A. Sharma, A. Jain, P. Gupta, and V. Chowdary, “Machine
learning applications for Precision Agriculture: A
comprehensive review,” IEEE Access, vol. 9, pp.
4843–4873, 2021. doi:10.1109/access.2020.3048415
A. Raghuvanshi et al., “Intrusion detection using machine
learning for risk mitigation in IOT-enabled smart
irrigation in smart farming,” Journal of Food Quality,
vol. 2022, pp. 1–8, 2022. doi:10.1155/2022/3955514
A. S. Zamani et al., “Performance of machine learning and
image processing in plant leaf disease detection,”
Journal of Food Quality, vol. 2022, pp. 1–7, 2022.
doi:10.1155/2022/1598796
N. K. Choudhary et al., “YieldPredict: A crop yield
prediction framework for Smart Farms,” 2020 IEEE
International Conference on Big Data (Big Data), 2020.
doi:10.1109/bigdata50022.2020.9377832
S. Veenadhari, B. Misra, and C. Singh, “Machine Learning
Approach for forecasting crop yield based on climatic
parameters,” 2014 International Conference on
Computer Communication and Informatics, 2014.
doi:10.1109/iccci.2014.6921718
H. Patel and D. Patel, “A brief survey of data mining
techniques applied to agricultural data,” International
Journal of Computer Applications, vol. 95, no. 9, pp. 6–
8, 2014. doi:10.5120/16620-6472
S. G L, N. V and S. U, "A Review on Prediction of Crop
Yield using Machine Learning Techniques," 2022
IEEE Region 10 Symposium (TENSYMP), Mumbai,
India, 2022, pp. 1-5, doi: 10.1109/
A. Sharma, A. Tamrakar, S. Dewasi and N. S. Naik, "Early
Prediction of Crop Yield in India using Machine
Learning," 2022 IEEE Region 10 Symposium
(TENMumbai, India, 2022, pp. 1-6, doi:
10.1109/TENSYMP54529.2022.9864490.
AI4IoT 2023 - First International Conference on Artificial Intelligence for Internet of things (AI4IOT): Accelerating Innovation in Industry
and Consumer Electronics
544

D. Kumar, Y. Kumar, A. Gulati and V. Kukreja, "Wheat
Crop Yield Prediction Using Machine Learning," 2022
International Conference on Data Analytics for
Business and Industry (ICDABI), Sakhir, Bahrain,
2022, pp. 433-437, doi:
10.1109/ICDABI56818.2022.10041621.
M. Gupta, B. V. Santhosh Krishna, B. Kavyashree, H. R.
Narapureddy, N. Surapaneni and K. Varma, "Crop
Yield Prediction Techniques Using Machine Learning
Algorithms," 2022 8th International Conference on Smart
Structures and Systems (ICSSS), Chennai, India, 2022,
pp. 1-7, doi: 10.1109/ICSSS54381.2022.9782246.
V. V and C. D. Guruprakash, "A review on Smart
Agricultural Applications: Crop yield and Plant disease
Prediction," 2022 International Conference on Applied
Artificial Intelligence and Computing (ICAAIC),
Salem, India, 2022, pp. 885-892, doi:
10.1109/ICAAIC53929.2022.9792736.
T. Y. Datubakka, Istikmal and A. I. Irawan, "Comparison
Analysis Of K-Nearest Neighbor (K-Nn) Algorithm
with Naive Bayes for Fire Source Detection
Mitigation," 2022 IEEE International
Q. Wang, "Support Vector Machine Algorithm in Machine
Learning," 2022 IEEE International Conference on
Artificial Intelligence and Computer Applications
(ICAICA), Dalian, China, 2022, pp. 750-756, doi:
10.1109/ICAICA54878.2022.9844516.
https://www.kaggle.com/datasets/patelris/crop-yield-
prediction-dataset
Support Vector Machine for Crop Yield Prediction Towards Smart Agriculture
545
