
Analysis of the Inner and Outer Models of Job Satisfaction on
Performance
Putu Rani Susanthi
1
, Dadi Akhmad Perdana
1
, Hazriyanto
1
, Hendri Kremer
2
, Merline Julianti
1
and
Pauzi
3
1
Galileo College of Economics Batam, Indonesia
2
Batam Indonesian Institute of Technology, Indonesia
3
STAIN Sultan Abdurrahman, Indonesia
merlineyulianti79@gmail.com
, pauzi@stainkepri.ac.id
Keywords: Analysis, Inner, Outer, Model, Satisfaction, Performance.
Abstract: In the current era of rapid development, competition for higher education human resources, both educators
and education staff, is an important issue, and attention is given to responding to changes and challenges. The
performance of human resources at the university level is also discussed. So this research needs to be done to
answer the problems in tertiary institutions. This study aims to get an overview of the answers by analyzing
the influence of job satisfaction factors on performance. The population and samples in this study were taken
from several universities with a total sample of 40 respondents. Data was collected using a questionnaire
distributed to lecturers in tertiary institutions. The data is processed using the Smart PLS v3 device. The tests
carried out are adjusted to the needs of the study, starting from the descriptive test and the inner and outer
model tests. The study's findings provide answers that there is a significant relationship and influence between
job satisfaction and the performance of lecturers in the higher education environment. Thus, higher education
institutions need to pay more attention to developing and improving human resources at the university level.
It is hoped that future researchers can carry out the same study with a more in-depth one, for example, with
studies based on demographics, population size, larger samples, and other statistical study analysis tools.
1 INTRODUCTION
In the era of the current decade, competition in the
education industry is increasingly tight, and
competition is required to prioritize the superiority of
human resources owned by each tertiary institution.
Also, an increasingly important driving force and
substance is considered in higher education
performance. However, tertiary institutions'
performance is inseparable from their human
resources' performance. Thus, tertiary institutions
encourage their human resources always to exceed
performance achievement targets. Lecturers with
their performance achievements through lecturer
Performance Reports and other tools as a support for
lecturer performance in internal tertiary institutions.
Before the Covid pandemic, during the Covid
pandemic, until now after the Covid pandemic, the
issue of discussion in higher education rankings
related to performance is still being discussed. This
has become the focus of attention at higher education
levels. What issue can boost the performance of
lecturers in tertiary institutions? The discussion is
inseparable from the issue of lecturer commitment
and satisfaction factors, which contribute to the
performance of lecturers in tertiary institutions. To
ensure and find solutions to these solutions, a study is
carried out on factors that are related to and influence
performance improvement in tertiary institutions. So
this study must be carried out to answer the problems
in higher education rankings. Even though
achievement targets from ministries have been set
related to key performance in the form of
performance indicators in tertiary institutions,
ironically, the expected achievements still need to be
maximized. To identify whether the problem is
related to the personal lecturer concerned or
something else.
The government runs various programs to
encourage the performance of lecturers and
universities by sharing assistance, facilities, facilities,
funding, and training. The entire program is in the
Susanthi, P., Perdana, D., Hazriyanto, ., Kremer, H., Julianti, M. and Pauzi, .
Analysis of the Inner and Outer Models of Job Satisfaction on Performance.
DOI: 10.5220/0012649300003798
Paper published under CC license (CC BY-NC-ND 4.0)
In Proceedings of the 2nd Maritime, Economics and Business International Conference (MEBIC 2023) - Sustainable Recovery: Green Economy Based Action, pages 147-152
ISBN: 978-989-758-704-7
Proceedings Copyright © 2024 by SCITEPRESS – Science and Technology Publications, Lda.
147
context of the success of the education agenda on a
national scale and even competes in the international
rankings. With the lecturer certification allowance
program and other benefits, the satisfaction and
commitment of lecturers to performance can be
minimized.
From the results of this study, we can see, observe,
and scrutinize from which side these problems or
obstacles arise. The concept should be that campuses
are free, learning is free, and education is more
flexible regarding work and performance. Lecturers
have unlimited space for movement regarding work
and performance while it aligns with the provisions
and goals of achieving national education. Help
understand, the following are presented several
reference theories discussed in this study and
previous research related to job satisfaction and
lecturer performance.
2 LITERATURE REVIEW
2.1 Performance
Performance appraisal is a process or an activity
carried out by individuals or groups within a company
to evaluate and communicate how employees do their
jobs by comparing results (Syamsuriansyah. 2021).
Performance is something related to the work
assignments given. Performance is not the end of a
series of work processes but the overall appearance
starting from input activities, output processes, and
results (Amir, Mohammad Faisal, 2015).
Performance management is the overall activity
carried out to improve the performance of a company
or organization, including the performance of each
individual and workgroup in the company (Zainal,
Veithzal Rivai, dkk, 2014). Performance is the result
of a combination of three essential factors: the ability
and interest of a worker, understanding and
acceptance of delegated tasks, and the level of
employee motivation (Muis, Ras. M, J. Jufrizen,
Fahmi, M, 2018).
2.2 Job Satisfaction
Job satisfaction is reflected in the performance shown
by each employee. When they perform well, it's a sign
that they are pleased to get pleasure from the work
they do (Tanjung, 2019). Psychological factors, social
factors, physical factors, and finances influence job
satisfaction (Mangkunegara, 2014). Satisfaction in
work is a generalization that comes from attitudes
towards work, which is carried out on a job basis
(Aulia, V., & Trianasari, N, 2021).
2.3 Relationship Between Job
Satisfaction and Performance
From the results obtained, it is determined that
satisfaction and performance have a clear and
significant relationship (Hazriyanto, Firdiyansyah, I.,
& Ibrahim, B, 2019). The results showed that the
overall satisfaction of both male and female students
was in the high category. While the overall student
performance is on a reasonable level (Hazriyanto, &
Ibrahim, B, 2018). Based on the EFA, the study's
results
found that the three critical factors are
commitment, satisfaction, and performance. The
rotated Component Matrix shows the correlation
between items. Factor 1 (Commitment) contains 13
items, Factor 2 (Satisfaction) includes 12 items, while
Factor 3 (Performance) contains 11 items
(Hazriyanto, & Ibrahim, B, 2019). The study results
show that organizational culture and work stress
indirectly significantly affect performance through
job satisfaction (Harahap, F. A., & Nasution, A. E,
2023).
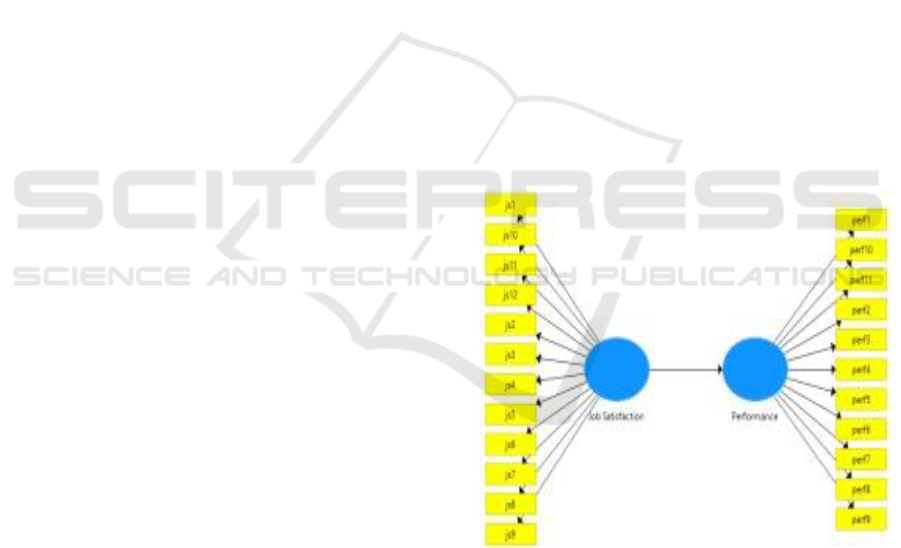
Figure 1: Concept Framework.
This study aims to determine the effect of job
satisfaction on the performance of lecturers in higher
education. While the study hypothesis is, that job
satisfaction has a positive and significant effect on
lecturer performance. The variables in this study
consist of satisfaction and performance.
MEBIC 2023 - MARITIME, ECONOMICS AND BUSINESSINTERNATIONAL CONFERENCE
148
3 RESEARCH METHODS
This study aims to see the relationship between
satisfaction and performance and the level of position
of each variable. The variables in the study are limited
to satisfaction and performance variables. The study
focuses on lecturers in the higher education ranking
environment. Data was obtained by distributing
questionnaires to lecturers at tertiary institutions. The
questionnaire items used were adapted and adopted
from previous research conducted with 23 items
(Hazriyanto, & Ibrahim, B, 2019). Forty respondents
were involved as a sample in the study. Data analysis
used the Smart PLS v.3 SEM statistical tool. The tests
were carried out using the inner and outer model tests.
4 RESULTS AND DISCUSSION
4.1 Results
The results of the existing processed data with the
Smart PLS device as shown in the following image.
Processed results go through 3 round stages to get
actual results by what is expected from the research.
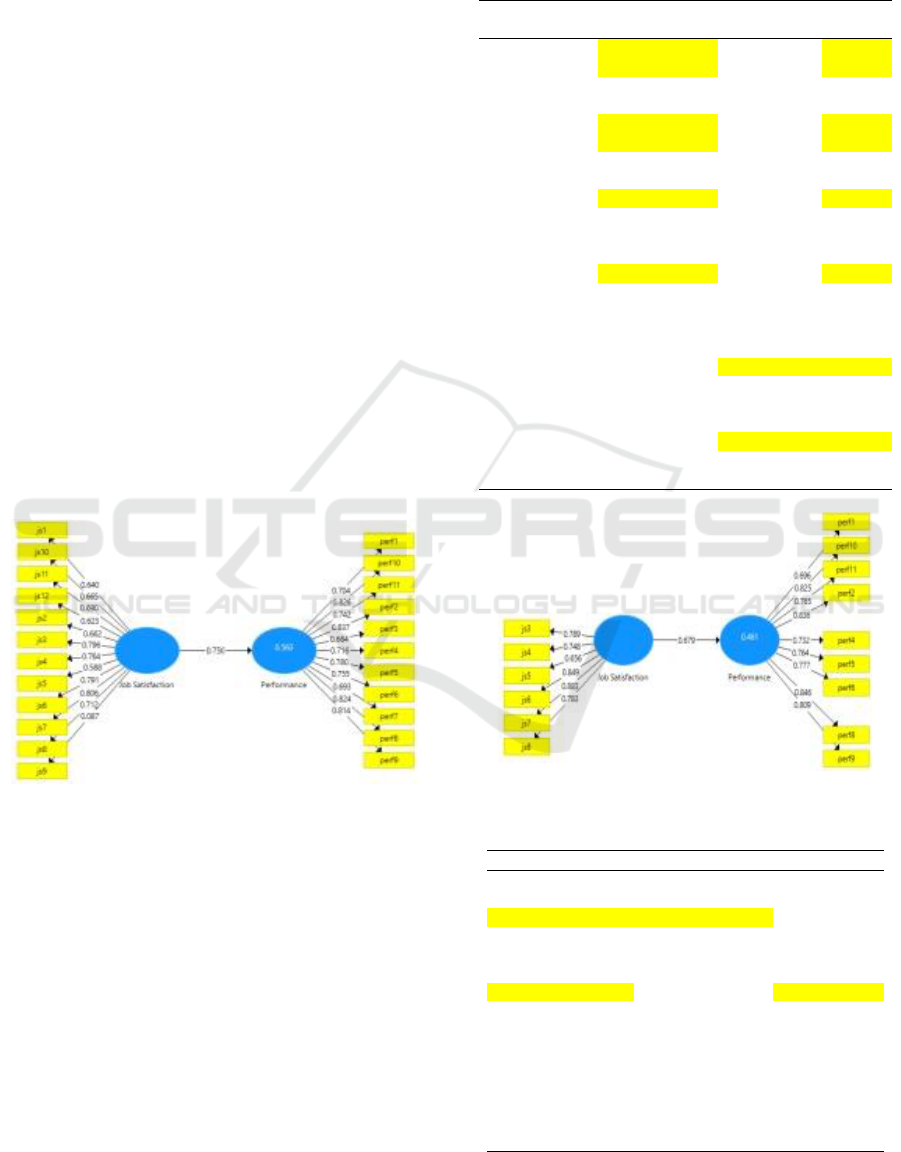
Figure 2: Round 1.
In round 1 in Figure 2, it can be seen that there are
still several indicators of the study variable below the
value of 0.7. For more details, it can be seen in Table 1.
Table 1 can be seen in the valid indicators of each
variable. From job satisfaction, there are six
indicators for the following process, including the
js11 hand (0.690) and nine accurate indicators for
performance. Invalid indicators are not included in
the following operations round by eliminating the
variable indicators. The results of the 2nd round are
shown in the figure 3 and table 2.
Figure 3 shows the results of the 2nd round
process. The results found that there were still invalid
items. This can be seen clearly in the description in
the table 2.
Table 1: Outer Loadings.
Items
Job
Satisfaction
Performance
Criteria
js1
0.640
Invalid
js10
0.665
js11
0.690
Valid
(0.70)
js12
0.623
Invalid
js2
0.662
js3
0.796
Valid
js4
0.764
js5
0.588
Invalid
js6
0.791
Valid
js7
0.806
js8
0.712
js9
0.087
Invalid
perf1
0.704
Valid
perf10
0.826
perf11
0.742
perf2
0.837
perf3
0.684
Invalid
perf4
0.716
Valid
perf5
0.780
perf6
0.755
perf7
0.693
Invalid
perf8
0.824
Valid
perf9
0.814
Figure 3: Round 2.
Table 2: Outer Loadings.
Items
Job Satisfaction
Performance
js3
0.789
js4
0.748
js5
0.656
js6
0.849
js7
0.883
js8
0.783
perf1
0.696
perf10
0.825
perf11
0.765
perf2
0.836
perf4
0.732
perf5
0.764
perf6
0.777
perf8
0.846
perf9
0.809
Analysis of the Inner and Outer Models of Job Satisfaction on Performance
149
Based on the table above, it can be stated that js5
and perf1 items are invalid. So it is necessary to do
the process of further rounds. After the round
processing, the results of round 3 can be observed in
the following figure and table.
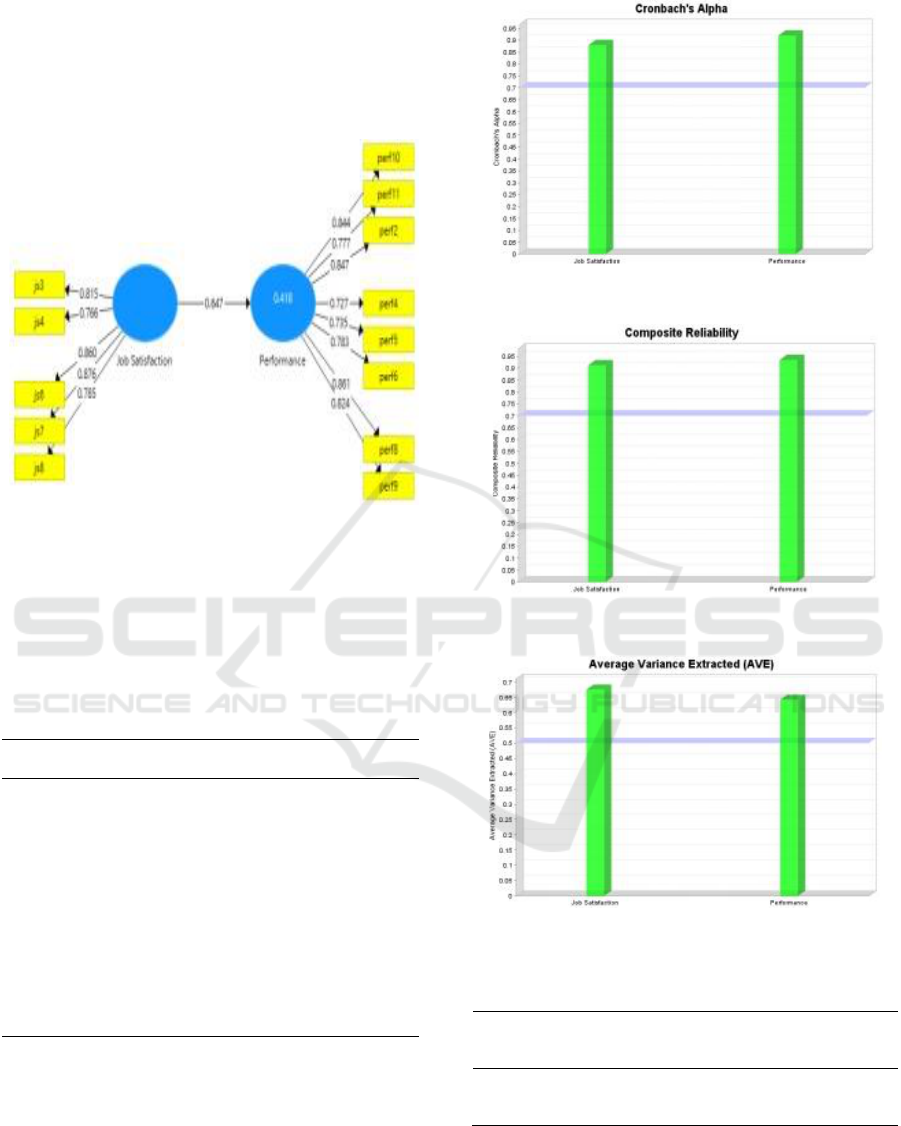
Figure 4: Round 3.
After processing in round 3, the results show that
all variable items can be asked for valid so that these
irregular items can be continued in the following
process. For a more detailed description of the results,
see the table below.
Table 3: Outer Loadings.
Items
Job
Satisfaction
Performance
Criteria
js3
0.815
Valid
js4
0.766
js6
0.860
js7
0.876
js8
0.785
perf10
0.844
perf11
0.777
perf2
0.847
perf4
0.727
perf5
0.735
perf6
0.783
perf8
0.861
perf9
0.824
The results in the table show that all variable items
have met the criteria consisting of 5 items for job
satisfaction and eight items that represent
performance. Other effects are shown in the
following figure and table description.
Figure 5: Cronbach’s Alpha.
Figure 6: Composite Reliability.
Figure 7: AVE.
Table 4: Construct Reliability and Validity.
Variables
Cronbach's
Alpha
rho_A
Composite
Reliability
Average
Variance
Extracted (AVE)
Job
Satisfaction
0.880
0.890
0.912
0.675
Performance
0.920
0.921
0.935
0.642
The table above results explain that satisfaction
and performance are valid and reliable, with a score
of 5 more than > 0.5. The R Square results can be seen
in the following table.
MEBIC 2023 - MARITIME, ECONOMICS AND BUSINESSINTERNATIONAL CONFERENCE
150
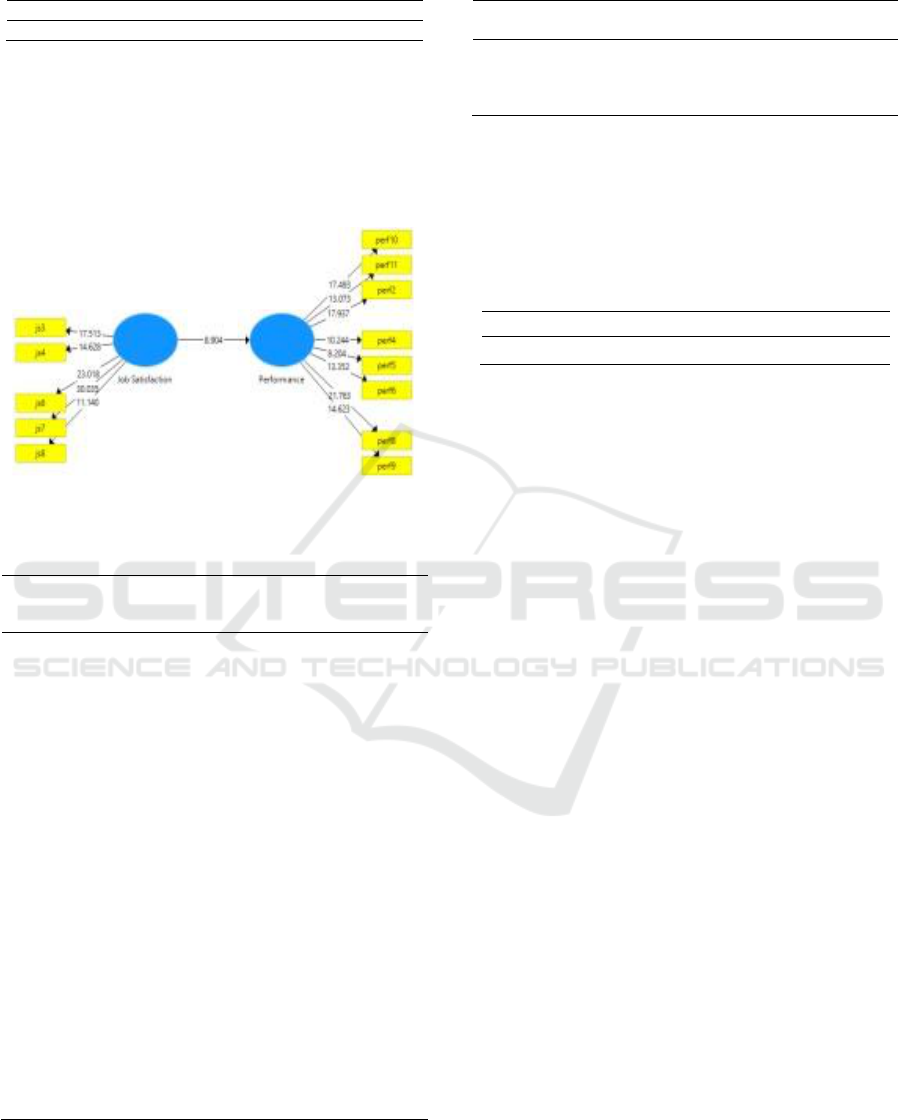
Table 5: R Square.
Variable
R Square
R Square Adjusted
Performance
0.418
0.410
The test results found that the value of R Square
(0.418) with R Square Adjusted (0.410). The results
explain that satisfaction contributes and contributes to
performance by 41.8% and 41%. Furthermore, the
following figure and table show the test results for
answering the hypothesis.
Figure 8: Bootstrapping.
Table 6: Outer Loadings.
Variables
Origina
l
Sample
Sample
Mean
Standard
Deviation
T Statistics
P Values
js3 <- Job
Satisfaction
0.815
0.813
0.047
17.513
0.000
js4 <- Job
Satisfaction
0.766
0.767
0.052
14.628
0.000
js6 <- Job
Satisfaction
0.860
0.858
0.037
23.018
0.000
js7 <- Job
Satisfaction
0.876
0.876
0.029
30.035
0.000
js8 <- Job
Satisfaction
0.785
0.775
0.070
11.140
0.000
perf10 <-
Performance
0.844
0.846
0.048
17.493
0.000
perf11 <-
Performance
0.777
0.778
0.059
13.073
0.000
perf2 <-
Performance
0.847
0.843
0.047
17.937
0.000
perf4 <-
Performance
0.727
0.728
0.071
10.244
0.000
perf5 <-
Performance
0.735
0.737
0.090
8.204
0.000
perf6 <-
Performance
0.783
0.776
0.059
13.352
0.000
perf8 <-
Performance
0.861
0.860
0.040
21.763
0.000
perf9 <-
Performance
0.824
0.821
0.056
14.623
0.000
Table 7: Path Coefficients.
Variables
Original
Sample
Standard
Deviation
T
Statistics
P
Values
Information
Job
Satisfaction -
>
Performance
0.647
0.073
8.904
0.000
Significant
Table 7 and Table 8 explain the value of the
coefficient of job satisfaction on performance
(0.647), T Statistics (8.904) with a P-value (0.000).
This illustrates satisfaction with the positive and
significant undertaking.
Table 8: Total Effects.
Variable
Performance
Information
Job Satisfaction
0.647
Significant
4.2 Discussion
The results of the study findings that have been stated
above have been able to provide answers and provide
an overview of the problems and appropriate study
objectives. The study's results after the 3-round
process showed five valid job satisfaction items and
eight valid performance items. The results of the
validity and reliability tests were also found to be
accurate and reliable. The total effect test and
hypothesis results show a significant positive
relationship and influence of satisfaction on
performance. The findings of this study are in line
with studies that have been conducted by Hazriyanto,
Firdiyansyah, I., & Ibrahim, B. (2019), Hazriyanto, &
Ibrahim, B. (2019), Harahap, F. A., & Nasution, A. E.
(2023).
5 CONCLUSION
In this section, what has been stated above starts from
the study's results to the discussion of the study's
findings. The process results can be concluded; with
valid satisfaction items and performance, with a high
level of validity and reliability. Job satisfaction is
essential in contributing to the implementation of
64.7%. This means that the contribution of
satisfaction to performance is quite good. In addition,
pleasure has a positive and significant effect on
performance. This needs to be a severe concern for
managers and parties involved in advancing and
improving performance at the tertiary level.
Universities need to pay more attention to job
satisfaction as a contributing factor to the
Analysis of the Inner and Outer Models of Job Satisfaction on Performance
151

performance of their lecturers at the college. Several
items from performance satisfaction can be given
special attention to increasing lecturer job satisfaction
and performance. It also includes other things that
need to be studied in more depth with continuous
follow-up studies. The results of this study can be
used as a reference for researchers, academics and
reviewers at higher education levels. Future
studies
should examine other contributing variables to
lecturer performance, such as; work culture and work
environment, and simulated performance comparison
studies based on gender, status, and others. The
prospective research can also use other analytical
tools such as SEM Amos and SPSS with more data
and a broader scope of the study area that is not
limited to the education industry but examines other
industrial sectors.
ACKNOWLEDGMENT
The authors thank Sekolah Tinggi Ilmu Ekonomi
Galileo Batam, Yayasan Unggul Mulia Dharma
(YUMD) Batam, ITEBA, Partners lecturer, and
FEBM MEBIC.
REFERENCES
Syamsuriansyah. 2021. Kinerja Karyawan. Bandung:
Widina Bakti Persada Bandung.
Amir, Mohammad Faisal. (2015). Memahami Evaluasi
Kinerja Karyawan, Konsep, dan
Penilaian Kinerja di Perusahaan. Penerbit Mitra Wacana
Media, Jakarta.
Zainal, Veithzal Rivai, dkk. 2014. Manajemen Sumber
Daya Manusia Untuk Perusahaan Dari Teori Ke
Praktik. Depok. PT Rajagrafindo Persada.
Muis, Muhammad Ras, J. Jufrizen, And Muhammad Fahmi.
2018. “Pengaruh Budaya Organisasi Dan Komitmen
Organisasi Terhadap Kinerja Karyawan.” Jesya
(Jurnal Ekonomi & Ekonomi Syariah) 1(1):9–25.
Tanjung, H. (2019). Pengaruh Keterlibatan Kerja Dan
Kepuasan Kerja Terhadap Komitmen Organisasi
Pegawai. Jurnal Humaniora: Jurnal Ilmu Sosial,
Ekonomi dan Hukum, 4(2), 36–49.
Mangkunegara, A. A. (2014). Evaluasi Kinerja Sumber
Daya Manusia. Bandung: Refika Aditama.
Aulia, V., & Trianasari, N. (2021). Pengaruh Disiplin Kerja
Dan Kepuasan Kerja Terhadap Kinerja Karyawan
Pada Hotel Banyualit Spa’N Resort Lovina. Jurnal
Manajemen Perhotelan dan Pariwisata, 4(1), 21.
https://doi.org/10.23887/jmpp.v4i1.29577
Hazriyanto, Firdiyansyah, I., & Ibrahim, B. (2019). The
model of job satisfaction and performance of
university lecturers in Batam city with sem smart PLS.
International Journal of Recent Technology and
Engineering, 8(2 Special Issue), 366–371.
Hazriyanto, & Ibrahim, B. (2018). Konfirmatori faktor
analisis kepuasan kerja dosen. Khazanah Ilmu
Berazam, 1(1).
Hazriyanto, & Ibrahim, B. (2019). The Factor Analysis of
Organizational Commitment, Job Satisfaction and
Performance among Lecturers in Batam. Journal of
Technical Education and Training, 11(1), 151–158.
https://doi.org/https://doi.org/10.30880/jtet.2019.11.0
1.19
Harahap, F. A., & Nasution, A. E. (2023). Studi Kinerja
Karyawan : Budaya Organisasi dan Stres Kerja
Melalui Kepuasan Kerja Pada PT . Perkebunan
Nusantara II ( Persero ) Medan. Jurnal Ekonomi &
Ekonomi Syariah, 6(2), 2317–2330.
MEBIC 2023 - MARITIME, ECONOMICS AND BUSINESSINTERNATIONAL CONFERENCE
152
