
Diabetes Prediction Using Machine Learning Algorithms
R. Sathishkumar and G. Anitha
Department of Computer Applications Karpagam Academy of Higher Education, Coimbatore, India
Keywords: Machine Learning, Support Vector Machines, KNN, Boosting Algorithm.
Abstract: Diabetes is a prevalent and life-threatening condition with severe implications, including heart attacks,
blindness, and neuropathy. The study aims to predict diabetes and its risk factors using machine learning
algorithms, specifically Support Vector Machines (SVM), K-Nearest Neighbors (KNN), Logistic Regression,
and Boosting Algorithms. The research employs a diverse dataset with 768 cases, emphasizing data
preprocessing for improved accuracy. The results show that SVM performs exceptionally well in predicting
diabetes cases due to its ability to create a hyperplane, making it an effective supervised machine learning
algorithm. KNN identifies similarities between data points for classification. Logistic Regression is suitable
for supervised binary classification problems. Boosting algorithms collaborate to improve predictive accuracy,
resembling teamwork. Moreover, Random Forest, a bagging ensemble technique, also exhibits high accuracy.
Machine learning holds the potential to significantly enhance diabetes risk prediction and facilitate early
intervention. Accurate predictions are vital for effective diabetes management and informed clinical decisions.,
K- NN, Boosting algorithms.
1 INTRODUCTION
Diabetes stands as one of the deadliest conditions in
the biosphere. It is not just a disease but also a
precursor to various other serious ailments such as
heart attacks, blindness, and neuropathies. The typical
routine involves patients needing to visit medical
centers regularly, consult their healthcare providers,
and adhere closely to a strict regimen for their well-
being. Moreover, each time they need medical
attention, they must navigate through bureaucratic
hurdles, often leading to frustration.
Diabetes Mellitus (DM) is defined as a group of
metabolic disorders primarily caused by irregularities
in insulin production and function. Insufficient
insulin leads to elevated blood glucose levels
(hyperglycemia) and impaired absorption of
carbohydrates, fats, and proteins (Siper et al 2005).
DM ranks among the most prevalent endocrine
disorders globally, affecting over 200 million
individuals. The incidence of diabetes is projected to
escalate significantly in the coming years. However,
there are two main medical classifications: Type 1
Diabetes (T1D) and Type 2 Diabetes (T2D), each
characterized by distinct pathologies. T2D, which
appears to be the most common form, is
predominantly associated with insulin resistance.
Major risk factors for T2D include lifestyle choices,
physical inactivity, dietary habits, and genetic
predisposition. On the other hand, T1D is believed to
result from autoimmune destruction of pancreatic β
cells within the Langerhans islets. T1D affects
approximately 10% of all diabetic cases worldwide,
with about 10% of them eventually developing
idiopathic diabetes. Other forms of DM, based on
insulin secretion patterns and/or etiology, include
Gestational Diabetes.
2 LITERATURE REVIEW
In this segment, we discussed the bracket alongside
prognostication procedures aimed at predicting
diabetes in healthcare. Specifically, the significance
of Bluetooth Low Energy (BLE)-based sensors and
device literacy protocols is emphasized for
personalized diabetes mellitus care in healthcare
production, offering healthcare authorities the luxury
to explore and identify therapeutic insights (Siper et
al 2005).
In this realm, there is substantial ongoing effort
directly tied to the prevailing landscape. Artificial
Neural Networks (ANNs) have been adapted to
achieve the highest accuracy in prediction within the
Sathishkumar, R. and Anitha, G.
Diabetes Prediction Using Machine Learning Algorithms.
DOI: 10.5220/0012771400003739
Paper published under CC license (CC BY-NC-ND 4.0)
In Proceedings of the 1st International Conference on Artificial Intelligence for Internet of Things: Accelerating Innovation in Industry and Consumer Electronics (AI4IoT 2023), pages 349-353
ISBN: 978-989-758-661-3
Proceedings Copyright © 2024 by SCITEPRESS – Science and Technology Publications, Lda.
349

medical field. The robust multilayer perception
(MLP) of ANNs is employed to forecast emotional
distress. The outcomes are interconnected within the
same domain and prove to be superior. The
integration of diabetes patient data with ANN,
Decision Trees, Support Vector Machines (SVM),
and Naive Bayes (NB) forms a hybrid approach that
challenges existing methods, yielding significant
results (Devi et al 2005Berry et al 1997, Witten et al
2016, Giri et al 2016).
Figure 1: Various Notations: Data Flow diagram.
3 METHODOLOGY
The purpose of this study is to review tabloid data for
early signs of diabetes, aiming to predict the condition
and promote healthier lifestyles. We conducted tests
using various methodologies and collaborative
approaches to forecast diabetes. Subsequently, we
successfully concluded this phase.
Data Collection Explanation: The initial step
involves gathering information from a repository. The
dataset comprises 768 cases with multiple attributes.
Data Pre-processing: Data pre-processing is a
crucial procedure. It involves handling missing data
and other inconsistencies that could affect the
accuracy of the information. By optimizing this
process, we ensure better quality and efficiency in
subsequent analyses. Proper pre-processing is
essential for accurate results and successful
prediction using machine learning algorithms.
Zero-Value Removal: We eliminate entries with
zero values, as these could skew the analysis. This
step, called zero-value removal, helps streamline the
dataset by reducing unnecessary dimensions, thus
facilitating more efficient analysis while retaining
valuable information.
Standardization: Standardization involves scaling
all features to a similar range. This ensures that all
characteristics are measured on comparable scales,
aiding in fair comparisons and accurate predictions.
Feature Engineering: Once the data is prepared,
we employ various techniques to extract meaningful
features. This involves utilizing different methods
and collaborative approaches tailored to the dataset.
By dissecting these techniques, we can assess their
effectiveness and identify key factors contributing to
accurate predictions.
Support Vector Machine (SVM): One such
method is the Support Vector Machine (SVM), a
prevalent algorithm for classification and regression
tasks. SVM constructs a hyperplane that separates
data points into distinct categories. It can also classify
new data based on learned patterns from the training
set. Fine-tuning the hyperplane's parameters allows
for precise separation, enhancing the algorithm's
predictive capabilities.
By following these steps and employing
sophisticated methodologies like SVM, we aim to
improve diabetes prediction accuracy and contribute
to promoting healthier lifestyles.
4 DRIFT ILLUSTRATION
Information influx diagrams are essential tools for
realistically depicting the flow of information within
a commercial evidence organization. Two primary
types of diagrams are commonly utilized: logical and
physical data flow diagrams.
The purpose of these diagrams is to illustrate how
information flows through an organization to achieve
specific business objectives. Logical diagrams depict
the conceptual flow of information, while physical
diagrams represent the actual implementation of the
information flow within the organization. Sometimes
referred to as data inflow graphs or bubble charts,
these diagrams reveal how data enters and exits the
system, the processes involved in handling the data,
and where data is stored.
In the realm of Mechanism Literateness, once
information has been prepared, it undergoes a
dissemination process. Various supportive and
collaborative methods are employed to forecast
phenomena like diabetes. These methods rely heavily
on established information patterns. The key to
effective dissemination lies in dissecting these
patterns, verifying their accuracy, and identifying the
significant factors that contribute to prediction.
One approach is through Provision Course
Appliances, such as Support Vector Machines
(SVM). SVM is a prevalent method in supervised
learning, capable of generating a hyperplane that
separates two classes or predicts values for
regression. It discerns properties within specific
AI4IoT 2023 - First International Conference on Artificial Intelligence for Internet of things (AI4IOT): Accelerating Innovation in Industry
and Consumer Electronics
350
datasets and can categorize data based on the
information provided. Separation is achieved by
optimizing a hyperplane that maximizes the margin
between classes or regression points.
5 MACHINE LEARNING
ALGORITHMS OVERVIEW
Support Vector Machine (SVM): SVM, short for
Support Vector Machine, stands out as one of the
most ubiquitous algorithms in machine learning.
Operating primarily within supervised learning, SVM
tackles both Support and Regression challenges, with
a predominant focus on solving Classification
problems. Its core objective revolves around
delineating spaces and accommodating new data
points with optimal linearity for future predictions.
SVM identifies pivotal points or vectors to
construct hyperplanes, often referred to as Support
Vectors, thereby earning its moniker. This supervised
machine learning technique excels in generating
hyperplanes that effectively segregate data points into
distinct classes or categories. Beyond mere
classification, SVM also facilitates regression tasks,
adept at discerning patterns within datasets and
accurately categorizing the realities supported by the
provided data. Segregation is achieved through
meticulously delineated hyperplanes, finely dividing
data clusters based on their proximity to distinct
activity nodes.
K-Nearest Neighbors (KNN): K-Nearest
Neighbors (KNN) emerges as one of the simplest yet
effective machine learning algorithms, rooted in the
paradigm of Supervised Learning. Operating on the
premise of similarity measurement, KNN traverses
both new and existing data points, leveraging the
instruction set within the algorithm. Its classification
methodology not only enhances data accuracy but
also fosters unique insights into diverse datasets.
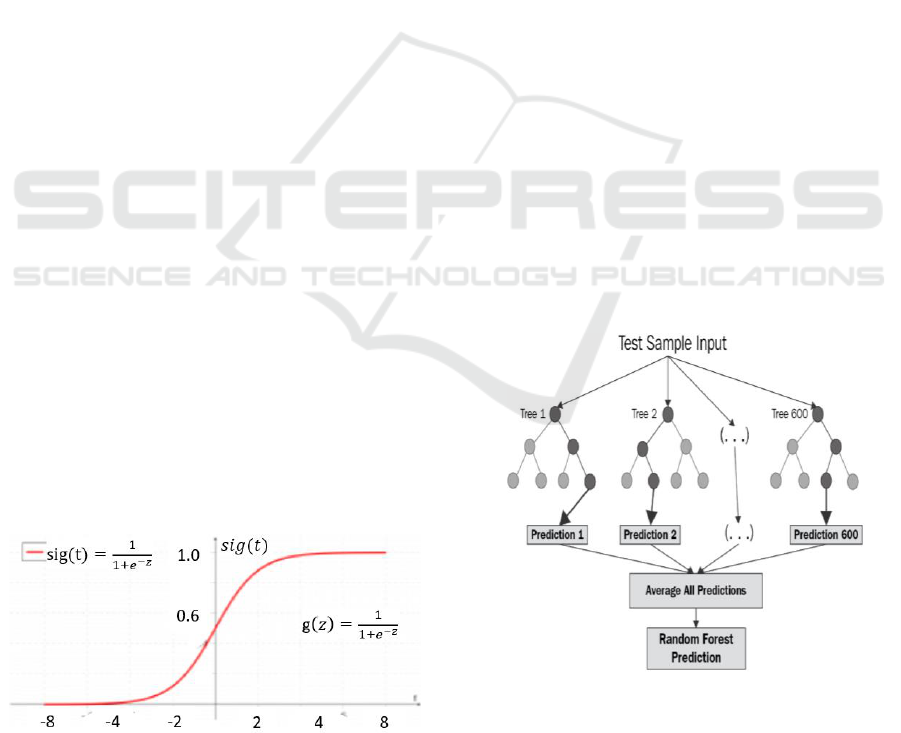
Figure 2: Governing function for Logistic retrogression.
Consider an instance where a creature exhibits
traits reminiscent of both feline and canine attributes,
yet its classification as either a cat or a dog remains
uncertain. In such scenarios, the KNN algorithm
meticulously evaluates the shared features between
the queried data point and the existing dataset,
ultimately delivering a classification based on the
closest resemblance, whether it be feline or canine.
Logistic Regression: Delving into the
fundamentals and applications of Logistic
Regression, this supervised learning algorithm stands
as a pivotal component in the machine learning
landscape. In essence, Logistic Regression represents
a type of supervised classification methodology.
Within the confines of a classification problem, the
dependent variable (outcome), denoted as 'y',
becomes contingent upon distinct features (or inputs),
denoted as 'X'. Contrary to common misconception,
Logistic Regression operates as a regression model,
utilizing regression techniques to forecast the
probability of an observed data point belonging to a
particular category.
In summary, these machine learning algorithms—
SVM, KNN, and Logistic Regression—embody
diverse methodologies, each tailored to address
specific challenges within the machine learning
domain. From delineating intricate data spaces to
discerning nuanced patterns and probabilities, these
algorithms collectively enrich the spectrum of
supervised learning techniques, propelling
advancements across various industries and
applications.
Figure 3: Random Forest Prediction Diagram.
Logistic regression transitions into a binary
fashion once a conclusion boundary is introduced into
the equation. The determination of the threshold
Diabetes Prediction Using Machine Learning Algorithms
351
value is a crucial aspect of logistic regression and
depends on the context of the problem at hand.
This discussion delves into the basics of logistic
regression and its application, which falls under the
category of supervised learning techniques. In a
binary classification problem, the target variable
(outcome), y, can only take two values based on
certain features (or predictors), X. Contrary to
common belief, logistic regression is a classification
model. It utilizes a regression model to predict the
probability of an observed data point belonging to a
certain class.
High Accuracy/Low Recall: In scenarios where
minimizing false negatives without necessarily
increasing false positives is crucial, we choose a
threshold that prioritizes either high or low accuracy
rates. For example, in a medical diagnosis scenario,
we want any potentially affected case to be flagged
without too much concern for falsely identifying
healthy cases as affected, as the consequence of a
missed diagnosis can be severe.
Low Accuracy/High Recall: In contexts where
reducing false positives is imperative without
drastically increasing false negatives, we opt for a
threshold that emphasizes either low or high accuracy
rates. For instance, if we're evaluating responses from
customers regarding a particular product, we must
ensure that positive responses are accurately
identified, as a negative response might lead to a loss
in potential sales.
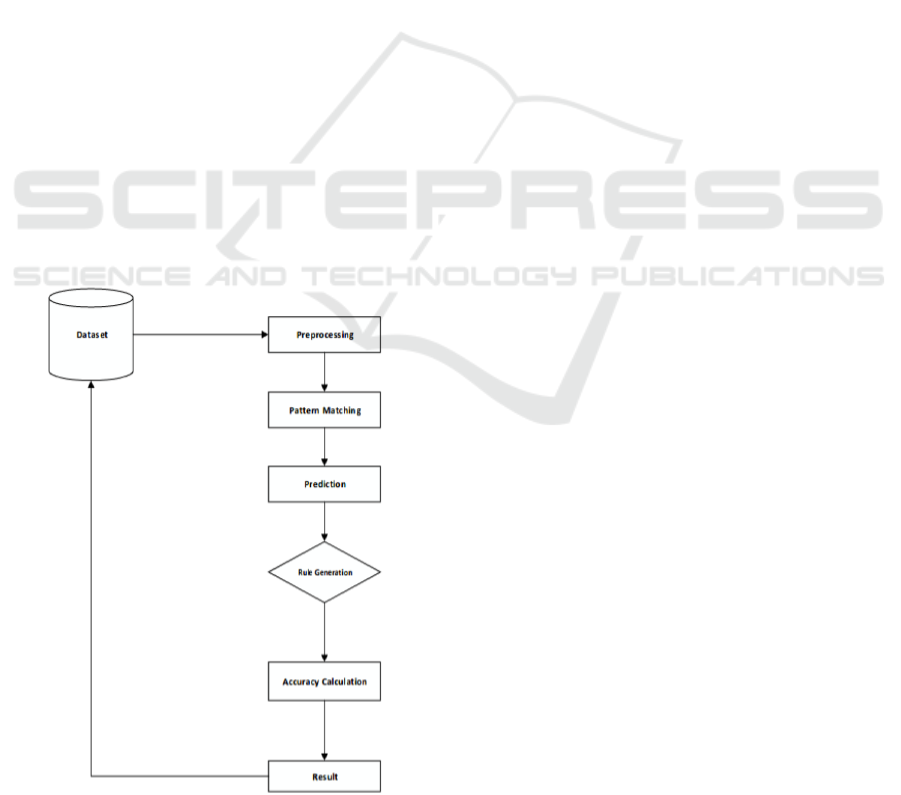
Figure 4: Flow chart of the proposed method.
5.1 Boosting Algorithms
Boosting is all about “teamwork”. The models that
are used here provides the information that in which
the model or the upcoming models are focused on.
Hence therefore this type is known to be the boosting
which can able to turn the model which has the energy
to work.
5.2 Moonboot Fastening Combination
(Catching)
Moonboot fastening facilitates an arbitrary slice
through the intricacies of information, aiding in
understanding biases and resistance inherent in
conventional data. It encompasses a systematic
approach that can be utilized to mitigate resistance in
various processes, often leading to more holistic
outcomes. By incorporating incidental facets of
information from customary sources, it provides a
comprehensive perspective.
Random timber, as an administered literacy
procedure, fosters collaborative learning systems
aimed at organization and refinement. Unlike
arbitrary timber, which amalgamates predictions
from multiple decision trees, random timber operates
by assembling a collection of decision trees during
training and utilizing them for prediction or
classification tasks.
5.3 Implementation
Popularly, this endeavor adopted dissimilar
methodologies. The planned methods utilized diverse
brackets alongside collaborative styles, enforced
through programming language (Python). These
approaches are standard in Machine Learning
techniques employed to enhance the accuracy of
information processing. Notably, an arbitrary timber
classifier outperforms other methods. Overall, we
employed sophisticated Machine Learning
techniques for prediction, achieving high precision.
The figure illustrates the outcomes of these Machine
Learning methodologies. Furthermore, the significant
features influencing the prediction are highlighted for
the arbitrary timber algorithm. The cumulative
importance of each influential point for diabetes
prediction is depicted, with the X-axis representing
the significance of each point and the Y-axis
displaying their respective names.
AI4IoT 2023 - First International Conference on Artificial Intelligence for Internet of things (AI4IOT): Accelerating Innovation in Industry
and Consumer Electronics
352

5.4 Data Flow Diagram
The data flow diagram illustrates the rational inflow
of information within an organization, serving
specific industry purposes. It delineates how data
circulates through the system, exchanging details and
storing information. The aim of a Data Flow Diagram
is to depict both the capabilities and limitations of an
organization's data flow. Also referred to as a data
inflow graph or bubble chart, it visualizes the
movement of data within the system.
6 CONCLUSIONS
Machine literacy possesses the remarkable capability
to refine the prognosis of diabetes threats through
advanced computational methodologies and the
vastness of extensive epidemiological and hereditary
diabetes threat datasets. Detecting diabetes in its early
stages remains crucial for effective management. This
effort has elucidated a machine literacy approach to
predicting diabetes scenarios. This methodology
could also aid clinicians in developing a precise and
efficient tool that translates into practical use in the
clinic, assisting them in making better-informed
decisions regarding patient care.
REFERENCES
Siper, A., Farley, R., & Lombardo, C. (2005). Machine
Learning and Data Mining Methods in Diabetes
Research. In Proceedings of Student/Faculty Research
Day, CSIS, Pace University, May 6th.
Devi, M. R., & Shyla, J. M. Devi et al 2016016). Analysis
of Various Data Mining Techniques to Predict Diabetes
Mellitus. International Journal of Applied Engineering
Research, 11(1), 727-730.
Berry, M., & Linoff, G. (1997). Data mining techniques:
For marketing, sales, and customer support. John Wiley
& Sons, Inc.
Witten, I. H., Frank, E., Hall, M. A., & Pal, C. J. Devi et al
2016016). Data Mining: Practical machine learning
tools and techniques. Morgan Kaufmann.
Giri, D., Sengottuvelan, M., & Rajaram, P. R. Devi et al
2016013). Automated diagnosis of coronary artery
disease affected patients using LDA, PCA, ICA and
discrete wavelet transform. Knowledge-Based
Systems, 37, 274-282.
Diabetes Prediction Using Machine Learning Algorithms
353
