
Resource Load Balancing on Cloud Infrastructure for Subscriber
Management in Comparison with Raw Unbalanced Data for
Calculation of Energy Consumption
V. Venkatesh and A. Shri Vindhya
Department of Computer Science and Engineering, Saveetha University, Chennai, India
Keywords: Advertising, Business, Expectation Maximization Clustering Algorithm, Fractionation, Marketing,
Novel K-Means Clustering Algorithm, Patron.
Abstract: This study compares the novel K-Means clustering method against the more popular Expectation-
Maximization Clustering technique in order to envision whether one produces more accurate results when
used to partition patrons' online social network activity. Materials and Methods: Extensive testing was
conducted to determine the accuracy percentages of both the K-Means clustering method and the Expectation-
Maximization clustering algorithm. The sample size used for each test was 110, and for the Expectation-
Maximization algorithm, a G power (value) of 0.6 was employed. Results: According to the results, the novel
K-Means clustering approach is superior to the Expectation-Maximization Clustering methodology in terms
of accuracy (87.97% vs. 79.77%). At a significance level of 0.001 (p < 0.05), the data strongly indicates a
noteworthy distinction between the two groups. When compared to the Expectation-Maximization clustering
approach, the novel K-Means technique fared very well.
1 INTRODUCTION
The primary goal of these results is to utilize the novel
K-Means grouping strategy and the thickness based
spatial bunching calculation to look at the division of
supporters' activities in web-based informal
organizations. The experiment's stated goal is to
"increase the accuracy of patron fractionation"
(Tabianan et. al, 2022). Differentiating clients into
subgroups using demographics, psychographics, and
other characteristics is called "patron fractionation"
(for example, grouping patrons by age). In other
words, it's a technique used by companies to learn
more about their clientele. A better understanding of
the differences across patron subsets is helpful for
making strategic decisions regarding product
development and marketing (Sivaguru, M. et.al,
2022). The quantity of available patron data will
determine the breadth of the possible fractionations.
A user's gender, interests, or age are only the
beginning; later on, criteria such as "time since the
user accessed our app" or "time spent on website X"
are taken into account. The applications of this
research helps in finding an optimal number of unique
patron groups and separate them based on their
attributes and concentrate on that particular area to
improve sales and provide the patrons what they want
(G. Ramkumar et al 2021).
The Implications of Finding The deployment of
patron fractionation paves the way for several new
business opportunities (Lefait et al 2010). Many
aspects of business, including budgeting, product
development, marketing, patron service, and sales,
may be enhanced by optimization. There are a total of
4,22,00,000 papers on the topic of patron activity
fractionation in online social networks, with
16,22,00,000 appearing in IEEE Xplore and the rest
in both that and Google Scholar. Now, let's examine
these benefits in more depth. Budgeting: It's
frustrating when advertising efforts don't result in
new business (Pradhan et al, Rahul et al 2021). Most
companies don't have unlimited funds for advertising,
therefore every dollar counts. fractionation helps to
prioritize the marketing efforts so that putting money
where money will do the most good, towards the
patrons who are most likely to return the investment.
The process of creating product designs. patron
fractionation facilitates the process of gaining insight
into consumers' wants and demands . They may zero
in on the most engaged audience to fine-tune apps or
services for them.
354
Venkatesh, V. and Vindhya, A.
Resource Load Balancing on Cloud Infrastructure for Subscriber Management in Comparison with Raw Unbalanced Data for Calculation of Energy Consumption.
DOI: 10.5220/0012772100003739
Paper published under CC license (CC BY-NC-ND 4.0)
In Proceedings of the 1st International Conference on Artificial Intelligence for Internet of Things: Accelerating Innovation in Industry and Consumer Electronics (AI4IoT 2023), pages 354-359
ISBN: 978-989-758-661-3
Proceedings Copyright © 2024 by SCITEPRESS – Science and Technology Publications, Lda.
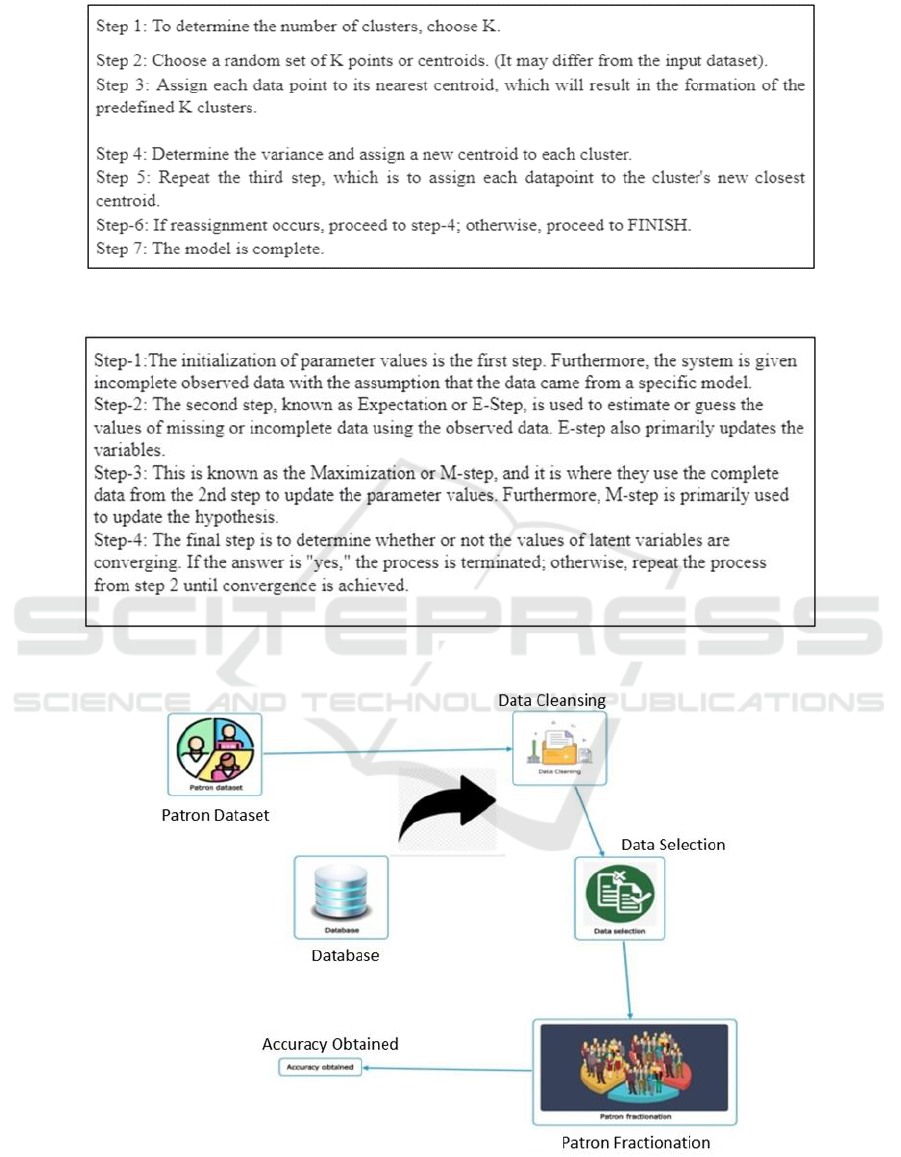
Figure 1: Procedure for K-Means clustering algorithm.
Figure 2: Procedure for Expectation-Maximization through Clustering Algorithm.
Figure 3: Schematic diagram for patron’s fractionation.
Resource Load Balancing on Cloud Infrastructure for Subscriber Management in Comparison with Raw Unbalanced Data for Calculation of
Energy Consumption
355
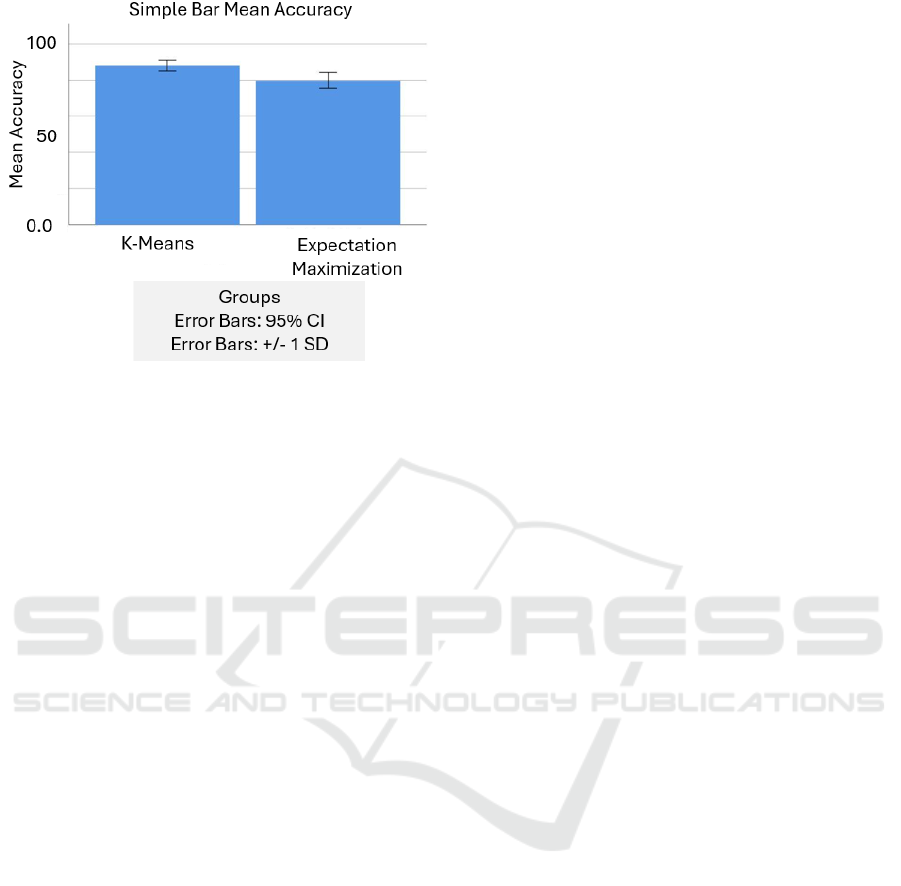
Figure 4: Expectation maximization comparison bar chart.
Consumers may be more accurately categorized
for more effective advertising planning. Sales have
become more commonplace in the commercial
software and online retail industries in recent years
(Liu et al, Chaohua 2011). Assuming to make the
right offer at the right moment, a patron is likely to
make a buy. Using patron fractionation, they may
tailor promotions to each individual client. Marketers
may quickly benefit from fractionation because it
allows them to tailor campaigns to specific groups of
patrons and deliver them through the channels of their
choosing. satisfaction of the consumer market: By
doing market research, may learn more about the
requirements of certain patron demographics. respect
the most about the company. With this information,
they may provide services and goods that are
specifically designed to meet the needs of target
market. The main aim of this research is to compares
the novel K-Means clustering method against the
more popular Expectation-Maximization clustering
technique in order to determine whether one produces
more accurate results when used to partition patrons'
online social network activity.
The group's expertise and experience in the field
have resulted in a number of scholarly works and the
study's main limitation is that it recommends against
providing each and every patron with a similar item
variation, email, instant message, or advertising
(Barga et.al 2015). There is a wide range of patron
needs. In the company, a "one size fits all" approach
seldom works. It usually results in fewer clicks, fewer
patrons, and less money made. The solution to this
problem is the patrons' ability to divide their
purchases.
2 MATERIALS AND METHODS
The Robotic Laboratory at SIMATS, is where this
study was conducted. There are two teams in the
planned task. Uses novel K-Means for the first set,
then Expectation-Maximization for the second.
Sample size of 132, 90% confidence interval, 60% G
power, and a fixed maximum tolerated error of 0.05
were used to compare the novel K-Means method
with the Expectation-Maximization clustering
algorithm (Seybold et.al, Patricia. (2002)).
After collecting datasets train.csv and test.csv, it
is preprocessed and cleaned to eliminate any
irrelevant or unnecessary information. After the data
has undergone meticulous cleaning and
preprocessing, restated, the sets may be accessed.
novel K-Means and Expectation-Maximization
clustering algorithms' opencv files and libraries were
modified after including new data sets to improve
prediction accuracy. Clusters are determined using an
Expectation-Maximization technique. novel K-
Means and density-based clustering method
clustering procedures are described here.
Devices that meet the requirements of a certain
hardware configuration are referred to as "hardware
configuration devices," and they are assigned a
unique set of specifications and allocations of
computational resources.
2.1 Clustering Using the Novel
K-Means
The novel K-Means algorithm is a centro-metric
technique of clustering. As a result of using this
technique, the dataset is divided into k different
clusters, each containing about the same amount of
data points. For each group, novel K-Means
clustering uses a centroid as its representative
(Hossain et.al, A. S. M. Shahadat et.al, and A. S.
Shahadat Hossain 2017).
novel K-Means Each of the n observations has to
be placed in the cluster that contains the mean (or
prototype) that is closest to its own. Clustering is the
name given to the vector quantization method that
was first used in the field of signal processing.
Pseudocode is shown in Fig. 1.
2.2 EM Clustering: An Expectation-
Maximization Approach
If they have a good idea of how the latent variables'
underlying probability distribution looks, they may
utilize the expectation-maximization process to make
educated guesses about their values (unobservable
AI4IoT 2023 - First International Conference on Artificial Intelligence for Internet of things (AI4IOT): Accelerating Innovation in Industry
and Consumer Electronics
356

variables that may be deduced from the values of
other observable variables). In reality, this approach
serves as the foundation for other unaided grouping
calculations in the investigation of AI (Santana et.al
2018). Pseudocode is shown in Fig. 2.
2.3 Statistical Analysis
IBM SPSS was the statistical programme of choice
for this investigation. The accuracy numbers are
determined by using the software's descriptive and
group statistics. The significance levels of the tests
performed on the independent samples are
determined. The novel K-Means clustering method
seems to excel in performance than Expectation-
Maximization clustering algorithm on each forum,
according to the two algorithms.
Table 1: Exactness of the novel K-Means.
Iteration
K-Means(%)
Expectation-
Maximization (%)
1
92.3
86.0
2
87.5
85.4
3
89.4
76.0
4
91.7
75.3
5
88.6
74.1
6
90.5
83.5
7
86.2
81.8
8
85.8
80.6
9
84.3
79.4
10
83.4
75.6
Both the independent and dependent variables
benefit from unique characteristics that aid in
prediction, and the latter have higher accuracy values.
Among the independent variables, patron ID, age, and
gender might influence the dependent variable, which
is average spending. The T-Test for autonomous
examples is run.
3 RESULTS
Table 1 shows the consequences of a reproduced
examination of the exactness of the novel K-Means
and Assumption Expansion bunching techniques.
Table 2 presents rundown insights for both the novel
K-Means and Assumption Augmentation bunching
procedures, uncovering mean upsides of 87.97 and
79.77 and standard deviations of 3.05 and 4.38,
individually. Within Table 3, the significance levels
and standard errors are provided, reflecting the
application of an independent sample T-test to the
two groups. The calculated significance value for
these groups is p=0.001 (p<0.05), signifying their
statistical significance. The clustering methods
pseudocodes are shown in Figures 1 and 2.
The architecture for contrasting two algorithms are
depicted in Figure 3. In this initially patrons’ datasets
are collected. After collecting datasets train.csv and
test.csv, it is preprocessed and cleaned to eliminate any
irrelevant or unnecessary information. Once the data
has been cleaned and preprocessed, the sets may be
accessed. Novel K-Means and Expectation-
Maximization clustering algorithms' opencv files and
libraries were modified after including new data sets to
improve prediction accuracy.
Fig. 4 depicts a comparison of the results of two
algorithms using a bar chart. Accuracy averages
87.97% for novel K-Means and 79.77% for
Expectation-Maximization clustering. The results
suggest that novel K-Means outperforms
Expectation-Maximization when it comes to
clustering algorithm.
Table 2: Accuracy values of Algorithms.
GROUP
N
Mean(%)
Std.Deviation
Std.
Error
Mean
K-Means
10
87.97
3.053
0.965
Expectation
Maximization
10
79.77
4.385
1.386
4 DISCUSSIONS
It seems from this research that the novel K-Means
clustering method is more effective than the
Assumption Augmentation grouping calculation (p =
0.162, Free Example Test). The novel K-Means
outperforms Expectation-Maximization in terms of
accuracy (mean accuracy = 87.97) whereas
Expectation-Maximization only manages 79.77
percent (Zakrzewska, D et al 2005).
Multiple techniques, including DBSCAN,
Agglomerative clustering, Birch, and novel K-Means,
are used in the investigation. Accuracy is measured at
0.79 for Expectation-Maximization and 0.87 for
novel K-Means (Sivakumar, V. L 2022). Novel K-
Means performs better than the Expectation-
Maximization clustering technique, according to a
comparison with that algorithm. The accuracy of
K-Mean is 87.97%, whereas that of Expectation-
Maximization is just 79.77%. In addition, it has
Resource Load Balancing on Cloud Infrastructure for Subscriber Management in Comparison with Raw Unbalanced Data for Calculation of
Energy Consumption
357

Table 3: Statistics of Algorithms.
Equal Variance
Levene’s Test for
Equality of Variance
T-test for Equality of Means
F
Sig
t
df
Sig
(2-tailed)
Mean
Difference
Std.
Error
Difference
95% Confidence
Interval of the
Difference
Lower
Upper
Accuracy
Assumed
2.13
.162
4.85
18.00
. 001
8.2
1.68
4.64
11.75
Not Assumed
4.85
16.06
. 001
8.2
1.68
4.61
11.78
produced outcomes that are consistent with our
conclusion (Syaputra et al 2020). They also tested
unsupervised machine learning algorithms using
voice recognition, and found that novel K-Means
outperformed the others with the best accuracy
(Garca, 2022). There was a consensus among four
works and a disagreement among one based on the
study conducted. Furthermore, it seems from the
foregoing talks and data that the novel K-Means
clustering method outperforms the Expectation-
Maximization clustering algorithm under all
circumstances (James, J. 2017).
However, novel K-Means struggles to cluster data
when there are clusters of varying densities and sizes.
In order to cluster such data, it is necessary to
generalize novel K-Means, as described in the
Benefits section. irregularities in groups (Hax 2010).
It's possible for outliers to pull centroids in their
direction, or they might split off into their own group.
There is a wide range of patron needs. A decrease in
engagement, in click-through rates, and in income is
often the result of a "one size fits all" approach to
business. This problem will be resolved thanks to
patron fractionation. The study's main limitation is
that it recommends against providing each and every
patron with a similar item variation, email, instant
message, or advertising (Xue et.al 2022). The goal for
future work is to optimize this model such that it runs
more quickly while still producing accurate results.
It's not a good idea to provide same advertising
(Pramono 2019).
5 CONCLUSIONS
The study on resource load balancing on cloud
infrastructure for subscriber management compared
with raw unbalanced data for the calculation of
energy consumption offers several notable
conclusions:
1. Superiority of Novel K-Means Clustering
Method: The results demonstrate that the novel K-
Means clustering approach outperforms the
Expectation-Maximization (EM) clustering
technique in terms of accuracy. The average
accuracy achieved by the novel K-Means method
is 87.97%, compared to 79.77% with EM
clustering. This indicates that the novel K-Means
method provides more precise partitioning of
patrons' online social network activities.
2. Significance of Cluster Accuracy: The
significance of the difference between the two
clustering methods is statistically supported with
a calculated p-value of 0.001 (p < 0.05). This
indicates a noteworthy distinction between the
accuracy levels achieved by the novel K-Means
and EM clustering algorithms.
3. Implications for Business Optimization:
The study underscores the importance of accurate
patron fractionation for various business
applications, including budgeting, product
development, marketing, patron service, and sales
optimization. By leveraging more accurate
clustering methods such as the novel K-Means
approach, businesses can prioritize marketing
efforts, tailor product designs, and deliver more
effective advertising campaigns.
4. Challenges and Future Directions: While
the novel K-Means clustering method shows
promising results, challenges such as clustering
data with varying densities and sizes remain.
Future work should focus on optimizing
clustering models to address these challenges
while maintaining accuracy and efficiency.
AI4IoT 2023 - First International Conference on Artificial Intelligence for Internet of things (AI4IOT): Accelerating Innovation in Industry
and Consumer Electronics
358

Additionally, the study highlights the importance
of avoiding a one-size-fits-all approach in
business strategies, emphasizing the need for
personalized approaches enabled by accurate
patron fractionation.
5. Overall Recommendations: Based on the
findings, it is recommended to utilize the novel K-
Means clustering method for patron fractionation
in online social networks due to its superior
accuracy compared to the EM clustering
technique. This recommendation is supported by
the statistical significance of the results and the
potential business benefits associated with more
precise patron segmentation. In conclusion, the
study provides valuable insights into the
effectiveness of different clustering methods for
patron fractionation, highlighting the importance
of accurate data analysis in optimizing business
strategies and resource allocation in cloud
infrastructure management.
REFERENCES
Tabianan et.al, Kayalvily et.al, Shubashini Velu et.al, and
Vinayakumar Ravi. 2022 et.al. “Novel K-Means
Clustering Approach for Intelligent patron fractionation
Using patron Purchase Behavior Data.” Sustainability.
https://doi.org/10.3390/su14127243.
Sivaguru, M. 2022 et.al. “Dynamic patron fractionation: A
Case Study Using the Modified Dynamic Fuzzy c-
Means Clustering Algorithm.” Granular Computing.
https://doi.org/10.1007/s41066-022-00335-0.
G. Ramkumar, R. Thandaiah Prabu, Ngangbam Phalguni
Singh, U. Maheswaran, Experimental analysis of brain
tumor detection system using Machine learning
approach, Materials Today: Proceedings, 2021, ISSN
2214-7853, https://doi.org/10.1016/j.matpr.2021.01.246.
Lefait et al, Guillem et al, and Tahar Kechadi. 2010 et al.
“Patron fractionation Architecture Based on Clustering
Techniques.” 2010 Fourth International Conference on
Digital Society. https://doi.org/10.1109/icds.2010.47.
Pradhan et al, Rahul. 2021 et al. “Patron fractionation Using
Clustering Approach Based on RFM Analysis.” 2021
5th (ISCON).
https://doi.org/10.1109/iscon52037.2021.9702482.
Liu et al, Chaohua. 2011 et al. “patron fractionation and
Evaluation Based on RFM, Cross-Selling and patron
Loyalty.” 2011 ICMSS.
https://doi.org/10.1109/icmss.2011.5998805.
Barga et.al, Roger et.al, Valentine Fontama et.al, and Wee
Hyong Tok. 2015 et.al. “Patron fractionation Models.”
Predictive Analytics with Microsoft Azure Machine
Learning. https://doi.org/10.1007/978-1-4842-1200-
4_10
Hossain et.al, A. S. M. Shahadat et.al, and A. S. Shahadat
Hossain. 2017 et.al. “patron fractionation Using
Centroid Based and Density Based Clustering
Algorithms.” 2017 3rd (EICT).
https://doi.org/10.1109/eict.2017.8275249.
Seybold et.al, Patricia. 2002 et.al. “Designing a patron
Flight Deck (SM) System - patron fractionation.”
https://doi.org/10.1571/fw1-31-02cc.
Santana et.al, Clodomir J. et.al, Pedro Aguiar et.al, and
Carmelo J. A et.al. Bastos-Filho et.al. 2018. “Patron
Fractionation in a Travel Agency Dataset Using
Clustering Algorithms.” 2018 IEEE(LA-CCI).
https://doi.org/10.1109/la-cci.2018.8625252.
Zakrzewska, D et al., and J. Murlewski 2005 et. al.
“Clustering Algorithms for Bank patron fractionation.”
(ISDA’05). https://doi.org/10.1109/isda.2005.33.
Sivakumar, V. L., Nallanathel, M., Ramalakshmi, M., &
Golla, V. (2022). Optimal route selection for the
transmission of natural gas through pipelines in
Tiruchengode Taluk using GIS–a preliminary study.
Materials Today: Proceedings, 50, 576-581..
Syaputra et al, Aldino et al, Zulkarnain et al, and Enrico
Laoh. 2020 et al. “patron fractionation on Returned
Product patrons Using Time Series Clustering
Analysis.” 2020(ICISS).
https://doi.org/10.1109/iciss50791.2020.9307575.
Garca, Kimberly, and Antonio Santos-Silva. 2022. “New
Species and New Records in Neoibidionini and
Hexoplonini (Coleoptera: Cerambycidae:
Cerambycinae).” Zootaxa 5134 (3): 399–414.
James, J., Lakshmi, S. V., & Pandian, P. K. (2017). A
preliminary investigation on the geotechnical properties
of blended solid wastes as synthetic fill material.
International Journal of Technology, 8(3), 466-476.
Hax, Arnoldo C. 2010. “Customer Segmentation and
Customer Value Proposition: The First Critical Task of
Strategy.” The Delta Model.
https://doi.org/10.1007/978-1-4419-1480-4_3.
Xue et.al, Mengfan et.al, Lu Han et.al, Yiran Song et.al, Fan
Rao et.al, and Dongliang Peng. 2022 et.al. “A Fissure-
Aided Registration Approach for Automatic Pulmonary
Lobe fractionation Using Deep Learning.” Sensors 22
(21). https://doi.org/10.3390/s22218560.
Pramono, Pradnya Paramita, Isti Surjandari, and Enrico
Laoh. 2019. “Estimating Customer Segmentation
Based on Customer Lifetime Value Using Two-Stage
Clustering Method.” 2019 16th International
Conference on Service Systems and Service
Management (ICSSSM).
https://doi.org/10.1109/icsssm.2019.8887704.
Resource Load Balancing on Cloud Infrastructure for Subscriber Management in Comparison with Raw Unbalanced Data for Calculation of
Energy Consumption
359
