
Accurate Prediction of Object Classification Based on Patterns Using
Linear Regression in Comparison with Enhanced K-Nearest
Neighbor
G. Pavan Kumar
*
and K. Anbazhagan
†
Department of Computer Science and Engineering, Saveetha School of Engineering, Saveetha Institute of Medical and
Technical Sciences, Saveetha University, Chennai, Tamil Nadu, 602105, India
Keywords: Classification, Image Pattern Recognition, Data Analysis, K-Nearest Neighbor, Research, Novel Linear
Regression, Machine Learning.
Abstract: The Project aim is to recognise the pattern that was seen in the photograph and to recognise and categorize
the object that it represents. Whether the image pattern will be applied to face recognition, image
classification, or fingerprint identification. Materials and Methods: The prediction of image recognition from
the input picture is carried out using the Novel Linear Regression classifier and k Nearest Neighbor classifier.
The Kaggle database system served as the source for the research dataset used in this study. A sample size of
twenty (Group 1=10 and from Group 2=10) was used to predict visual pattern analysis with an enhanced
precision rate. The computation made use of a G-power of 0.8, alpha and beta values of 0.05 and 0.2, and a
confidence range of 95%. Results: The recommended Novel Linear Regression has an accuracy rate of
88.09%, which is much greater than the k nearest neighbor algorithm's accuracy rate of 85.33%. Considering
the research, it can be said that the two algorithms differ statistically significantly for p = 0.001 (Independent
Sample T Test P0.05). In conclusion, the proposed Novel Linear Regression model outperforms the k nearest
neighbor method in terms of performance evaluation of visual pattern analysis recognition accuracy.
1 INTRODUCTION
Recognizing handwritten numbers is one use of
utilizing linear regression for picture pattern
recognition. The picture of a digit is preprocessed in
this application to extract numerical information such
pixel intensity values, the quantity of linked
components, or the number of corners(Singh et al.
2008). Following that, a linear regression model that
forecasts the appropriate digit label uses these
features as inputs. Using linear regression for visual
pattern identification, some applications include:
Recognition of handwritten digits: As was already
noted, linear regression may be used to identify
handwritten digits by using numerical information
from the digit pictures and training a model to predict
the label for each digit (Pasolli, Melgani, and Donelli,
2009). Facial features are extracted from face images
and used as inputs to a LR model to predict the
*
Research Scholar
†
Project Guide
corresponding facial expression of this application for
facial expression recognition. These features include
the location of the eyes, nose, and mouth as well as
the orientation of the head. To identify and diagnose
medical issues, linear regression-based picture
pattern recognition can be used. To identify cancers
or other abnormalities in medical pictures like X-rays
or MRI scans, for instance, linear regression models
can be developed (Ramos and Almeida, 2004) (AS,
Vickram et al., 2013). Research paper says that
Security applications including face identification,
license plate recognition, and object detection can
employ linear regression-based picture pattern
recognition. To identify people, cars, or other items
of interest in these applications, a linear regression
model may be trained to detect particular patterns or
characteristics in photos (Boashash et al., 2015)
(Vijayan et al., 2022).
There were more than 100 articles published in
IEEE &Researchgate (Berger et al. 2007) This book
Kumar, G. and Anbazhagan, K.
Accurate Prediction of Object Classification Based on Patterns Using Linear Regression in Comparison with Enhanced K-Nearest Neighbor.
DOI: 10.5220/0012772500003739
Paper published under CC license (CC BY-NC-ND 4.0)
In Proceedings of the 1st International Conference on Artificial Intelligence for Internet of Things: Accelerating Innovation in Industry and Consumer Electronics (AI4IoT 2023), pages 373-377
ISBN: 978-989-758-661-3
Proceedings Copyright © 2024 by SCITEPRESS – Science and Technology Publications, Lda.
373

covers a wide range of statistical techniques for
recognising visual patterns, such as support vector
machines, logistic regression, and linear regression
(Ripley, 1986). The approach for using linear
regression to do image processing tasks, such as
denoising, deblurring, and super-resolution, is
presented in this study. Using a linear regression
classifier (Wieland and Pittore, 2014). This study
proposes a method for classifying facial expressions
based on a collection of characteristics collected from
a face picture using linear regression. In order to
increase performance, this work suggests a linear
regression-based method for classifying images that
makes use of a low-rank representation of the picture
attributes (Hester and Casasent, 1980).
Low capacity to recognise intricate patterns:
Linear regression is a straightforward approach that
frequently fails to identify intricate nonlinear
correlations between picture characteristics and class
labels (Chen and Peter Ho, 2008).
Research paper stated that performance may thus
be constrained in tasks that call for the understanding
of intricate picture patterns. Lack of resilience to
picture data fluctuations. Linear regression models
are frequently vulnerable to image data alterations,
such as shifts in size, rotation, or viewpoint. Because
of this, they may perform poorly in situations when
the picture data varies widely. The proposed work
aim is to increase the computational time efficiently
so that it can quickly classify the images and make
predictions.
2 MATERIALS AND METHODS
The work was carried in AI lab of the CSE
department in SSE of the Saveetha Institute of
Medical and Technical Sciences. The novel Linear
Regression Method was used in Group 1 and KNN
was used in Group 2. The sample size was calculated
based on earlier studies using clinicalc.com (Roy,
2018) withGpower as 80%, the confidence interval at
95%, and the threshold for the computation was set at
0.05 with a significance level of p=0.001. The dataset
for this particular research topic was retrieved from
the Kaggle repository. 25% of the database is set
aside for testing, while 75% is reserved for training.
Ten data samples total are gathered, divided into two
groups.
2.1 Linear Regression
Linear regression is one of the most fundamental and
popular Machine Learning methods. It is a method for
carrying out predictive analysis that is based on
statistics. Linear regression generates forecasts for
continuous/real/numeric variables like sales, salary,
age, and product price, among others. a dependent
variable and one or more independent variables (y)
are shown to be linearly related by the linear
regression method, also known as linear regression. It
is possible to use linear regression to determine how
the value of the dependent variable changes as a
function of the value of the independent variable
because it exhibits a linear relationship. The two types
of machine learning linear regression methods are as
follows: Simple linear regression is a sort of linear
regression technique that uses just one independent
variable to predict the value of a numerical dependent
variable. When more than one independent variable
is used to predict the value of a numerical dependent
variable, multiple linear regression is the technique
used.
Algorithm 1.
Input: Image pattern recognition_ Input Features
Output: Classification of Image pattern recognition
Step 1: Gather labeled images with corresponding
input features A and output values B.
Step 2: Partition data in training plus testing.
Step 3: Normalize the input features A and output
values B.
Step 4: Implement Linear Regression algorithm to
build a model.
Step 5: Performance is evaluated on training set.
Step 6: Adjust hyperparameters or consider using
other algorithms if performance is unsatisfactory.
Step 7: Use the model to predict output values B for
new images based on input features A.
2.2 Enhanced K-Nearest Neighbor
It is a simple algorithm in which each pixel is
allocated to the class in the training set with the
highest intensity. A NN algorithm may determine
something incorrectly if the acquired single neighbor
is an outlier of a different class. In order to get around
this and improve the method's resilience, the KNN
Algorithm employs K patterns. The KNN Algorithm
is characterized as a non parametric Machine learning
Algorithm since it does not rely on any underlying
assumptions about the statistical make-up of the data.
Algorithm 2.
Input: Image pattern recognition_ Input Features
Output: Classification of Image pattern recognition
Step-1: Gather labeled images with corresponding
input features A and B.
AI4IoT 2023 - First International Conference on Artificial Intelligence for Internet of things (AI4IOT): Accelerating Innovation in Industry
and Consumer Electronics
374

Step-2: Partition data into testing plus training.
Step-3: Normalize the input features A and B.
Step-4: Implement Enhanced k-Nearest Neighbor
algorithm to classify new images.
Step-5: Choose k based on performance on the
training and testing sets.
Step-6: Adjust hyper parameters or consider using
advanced techniques if performance is unsatisfactory.
Step-7: Use the model to classify new images based
on input features A and B.
Statistical Analysis
Statistical analysis of the Linear Regression and
Enhanced K Nearest Neighbor algorithms are done
using IBM SPSS 23.0.0. The statistical calculations
were computed for the two samples and compared
using an independent sample t test in SPSS. Those
samples were taken from the base paper (Flusser and
Suk, 1993). Human (Hands, Legs) is a dependent
variable, whereas the other Eyes and Ears are
independent variables. The Independent T-Test is
used to examine the study and this dataset was taken
from the kaggle database.
3 RESULTS
Calculations of K-Nearest Neighbor Algorithm and
Linear Regression are shown in table. The Suggested
technique has an average accuracy of 88.09 percent,
whereas the Enhanced k-closest neighbor
classification algorithm has a mean accuracy of 85.33
percent. Whereas the standard deviation for linear
regression is .57191, it is .74705 for the Enhanced k
Nearest Neighbor method. The mean standard error
of the improved k nearest neighbor technique is
.23624 whereas that of linear regression is .18085.
Table 2 displays the improved k-nearest-neighbor
approach and the statistical calculations for
independent variables of linear regression are
contrasted. There is a .902 level of significance for
the accuracy rate. The autonomous sample T-test is
employed to compare the linear regression and
improved k-nearest neighbor methods with 95%
confidence interval.
In Fig. 1. the accuracy rating of the Linear
Regression prediction model is 88.09, whereas the
accuracy rating of the K-Nearest Neighbor prediction
model is 85.33. is shown.
Table 1: The performance measurements of the Linear Regression and Enhanced K Nearest Neighbor Algorithms.
Group Statistics
Group
N
Mean
SD
SER
Accuracy
Linear regression
10
88.0910
.57191
.18085
Accuracy
Enhanced k nearest
neighbor
10
85.3310
.74705
.23624
Table 2: Linear regression Statistical Calculation in comparison with the Enhanced k nearest neighbor Algorithm has been
evaluated. The significance level between two groups is 0.001 (Inependent Sample T Test p<0.05).
Levene’stest for
Equality of
variances
T-test for Equality of Means
F
Sig
t
df
sig(2-
tailed)
Mean
difference
Std.
Error
Difference
95% confidence
interval of the
Difference
Lower
Upper
Accuracy
Equal
variances
assumed
.902
.355
9.277
18
.001
2.760000
.29752
2.13494
3.38506
Equal
variances,
not assumed
9.277
16.852
.001
2.760000
.29752
2.13188
3.38812
Accurate Prediction of Object Classification Based on Patterns Using Linear Regression in Comparison with Enhanced K-Nearest Neighbor
375
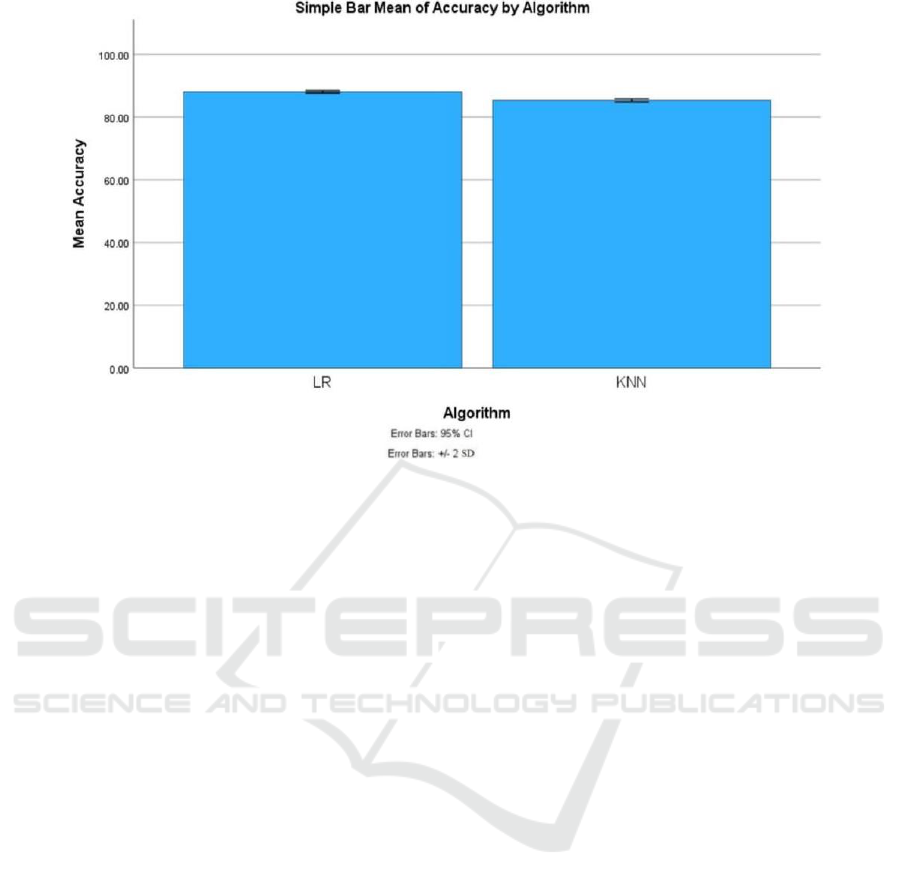
Figure 1: Comparison of mean accuracy and standard errors for Linear regression algorithm. Linear regression algorithm is
better than Enhanced KNN. In terms of mean accuracy and standard deviation. X-Axis: Linear regression Vs Enhanced KNN
Y-Axis: MA. Error Bar ±2 SD.
4 DISCUSSION
This study compares the output precisions of
innovative linear regression and KNN (k nearest
neighbor) algorithms. These datasets are available in
the Kaggle database. The system's programming
language is implemented using Matlab. By
contrasting the current Improved k closest neighbor
methodology with our new Linear regression method
in terms of performance and accuracy, experiments
are done to assess the outputs of the proposed model
and provide superior results. According to experiment
results, the recommended linear regression strategy
outperformed the Improved k closest neighbor
approach, which had an accuracy level of 85.33
percent, with a level of 88.09 percent (p<0.05). The
enhanced k closest neighbor method is inferior to the
linear regression approach.
The study investigates the use of linear regression
for picture categorization and evaluates its
effectiveness in comparison to other well-known
machine learning techniques (Liew, Yan, and Yang,
2005). The authors demonstrate how linear regression
may perform on par with other methods while still
having the benefit of being computationally effective
(Mitra and Pal, 2005). This study suggests a linear
regression-based technique for identifying visual
saliency. The authors obtain competitive performance
compared to existing saliency detection techniques by
using a linear model to predict saliency scores for
each pixel in the image (Vijaya Kumar, Savvides, and
Xie, 2016). Adaptive image denoising using linear
regression: This study describes a linear regression-
based technique for adaptive picture denoising. The
authors demonstrate that their method outperforms a
number of cutting-edge picture-denoising techniques
using a patch-based methodology (Haralick and
Kelly, 1969). A linear regression-based framework
for picture super-resolution. The paradigm for picture
super-resolution proposed in this study is based on
linear regression.
Limitations for complicated visual patterns, linear
regression may not hold since it implies a linear
connection between the features and the response
variable. In these circumstances, linear regression
could perform poorly because it is unable to identify
the non-linear correlations in the data. Outliers in the
data analysis are easily detected via linear regression.
Outliers data analysis can appear in picture
identification tasks as a result of changes in
illumination, perspective, or occlusions. Predictions
made using linear regression may be erroneous since
it may not be resistant to such outliers. With regard to
photos, linear regression makes the assumption that
the characteristics are independent of one another.
Pictures often contain strongly associated
characteristics, and neglecting these connections can
lead to inferior performance. As a future scope,
AI4IoT 2023 - First International Conference on Artificial Intelligence for Internet of things (AI4IOT): Accelerating Innovation in Industry
and Consumer Electronics
376

regularization methods that promote sparse or low-
rank representations of the picture data analysis can
be utilized to address linked features. To impose
sparsity or low-rankness based on the correlations
between the features, for instance, group lasso or
elastic net regularization can be utilized. To perform
data analysis better on a target image recognition task,
transfer learning techniques can be utilized to transfer
information from related tasks or domains. For
instance, a model that has been trained on a big
dataset like ImageNet can be improved upon using a
smaller dataset.
5 CONCLUSION
Using a novel Linear Regression Algorithm, Image
pattern recognition is implemented with remarkable
efficiency. It is a Machine learning algorithm Linear
Regression uses noises in the images to train the
Algorithm, which allows the model to have the
capacity to recognize and classify Image pattern with
a high level of accuracy. An examination of Image
pattern recognition with a higher rate of accuracy
finds that the Linear regression is 88.09% more
accurate than the Enhanced K Nearest Neighbor
(85.33%).
REFERENCES
AS, Vickram, Raja Das, Srinivas MS, Kamini A. Rao, and
Sridharan TB., 2013. "Prediction of Zn concentration in
human seminal plasma of Normospermia samples by
Artificial Neural Networks (ANN)." Journal of assisted
reproduction and genetics 30: 453-459.
Berger, Ch, Th Geraud, R. Levillain, N. Widynski, A.
Baillard, and E. Bertin, 2007. “Effective Component
Tree Computation with Application to Pattern
Recognition in Astronomical Imaging.” In 2007 IEEE
International Conference on Image Processing, 4:IV –
41 – IV – 44.
Chen, Chi Hau, and Pei-Gee Peter Ho, 2008. SPRR, Pattern
Recognition 41 (9): 2731–41.
Kauffman, Thomas, Hugo Théoret, and Alvaro Pascual-
Leone, 2002. “Braille Character Discrimination in
Blindfolded Human Subjects.” Neuroreport 13 (5):
571–74.
Mitra, Sushmita, and Sankar K. Pal, 2005. “Fuzzy Sets in
Pattern Recognition and Machine Learning
Intelligence.” Fuzzy Sets and Systems. An International
Journal in Information Science and Engineering 156
(3): 381–86.
Ramos, Vitorino, and Filipe Almeida, 2004. “Artificial Ant
Colonies in Digital Image Habitats", "Pattern
Recognition,” December.
https://doi.org/10.48550/arXiv.cs/0412086.
Ripley, Brian D., 1986. “Statistics, Images, and Pattern
Recognition.” The Canadian Journal of Statistics =
Revue Canadienne de Statistique 14 (2): 83–102.
Vijaya Kumar, Bhagavatula V. K., Marios Savvides, and
Chunyan Xie, 2006. “Correlation Pattern Recognition
for Face Recognition.” Proceedings of the IEEE 94
(11): 1963–76.
Shamir, Lior, John D. Delaney, Nikita Orlov, D. Mark
Eckley, and Ilya G. Goldberg, 2010. “Pattern
Recognition Software and Techniques for Biological
Image Analysis.” PLoS Computational Biology 6 (11):
e1000974.
Signal Processing, Image Processing and Pattern
Recognition,. n.d. Springer Berlin Heidelberg.
Accessed February 8, 2023.
“Toward the Neurocomputer: Image Processing and Pattern
Recognition with Neuronal Cultures.” n.d. Accessed
February 15, 2023.
https://ieeexplore.ieee.org/abstract/document/1396377.
Vijayan, D. S., Mohan, A., Nivetha, C., Sivakumar, V.,
Devarajan, P., Paulmakesh, A., &Arvindan, S., 2022.
Treatment of pharma effluent using anaerobic packed
bed reactor. Journal of Environmental and Public
Health, 2022.
Accurate Prediction of Object Classification Based on Patterns Using Linear Regression in Comparison with Enhanced K-Nearest Neighbor
377
