
An Accurate Approach to Classify Real Time Indian Twins Using
SVM and Compare the Performance over Logistic Regression
Vallipi Dasaratha and J. Joselin Jeya Sheela
Department of Electronics and Communication Engineering, Saveetha Institute of Medical and Technical Sciences,
Saveetha University, Chennai, Tamil Nadu, 602105, India
Keywords: Biometric, Face Recognition, Identification, Image Processing, Logistic Regression, Support Vector
Machine, Technology.
Abstract: The study aims to increase the accuracy of comparing and classifying the Real Time Indian Twins using
Support Vector Machine (SVM) over Logistic Regression (LR) algorithm. Face Recognition of twins with
face and ID recognition using Support Vector Machine(SVM) over Logistic Regression. Here the analysis
was carried out with two groups named as Group 1 and 2 with sample iteration of 40 where each group consist
of 20 sample iterations, for a sample size of 1430. Results and Discussion: Compare and identify The Real
Time Indian Twins and also its Performance using SVMand Logistic Regression Algorithms. The SVM and
LR have achieved the accuracy of 62.2650% and 31.0225%. respectively. By comparing the accuracy of the
two algorithms, independent samples tests reveal an accuracy gap between the two methods that is statistically
significant of p=0.001 (p<0.05) which shows that the hypothesis is significant and is carried out using an
independent sample T- test. Conclusion: The findings clearly demonstrates that SVM has an excellent
accuracy of 62.265% when compared to Logistic Regression whose accuracy is 31.0225%.
1 INTRODUCTION
To generate a biometric identification code, facial
recognition scans a face against a template that has
been saved. Both identification and verification can
be accomplished using face recognition. Biometrics
is the use of biological or psychological data. The
human traits of an individual might reveal their
identity. At the most essential places, such as banks,
airports, enterprises, and many others, identification
of a person is performed because it is quite
important(Reddy, Siva Malleswar Reddy, and
Poovizhi 2022). There are numerous ways to do the
task, including knowledge-based processing, which is
also known as assigning an identity and password.
However, these methods have drawbacks. Twin
identification is made possible by a variety of facial
recognition technologies that also include voice, iris,
and other types of recognition. To identify a unique
person, the finger-print identification technique is
used(Suguna, Raja Suguna, and Amaresh 2022). The
disadvantages of biometric fingerprint technology
recognition include vulnerability to hacking and
delayed processing. Additionally, there are
limitations to iris recognition, such as identification
errors brought on by mismatching, a drawn-out
identification procedure, and unsuitability for
identification if any have eye defects (Babaeian et al.
2019) (Mahapatra, S. et al., 2016). Voice recognition
has drawbacks including being readily abused by
others. The limitation for facial recognition when two
different people have a striking resemblance in look
is called "identical twins."(Ozdemir and Tugrul
2019). If one topic is attempting to pass as another,
the two subjects may look remarkably similar. It is
crucial to test facial recognition algorithms on the
most challenging situations. Therefore, the new
approach is suggested to accurately identify twins
(Lee and Kwon 2018).
An image of a face is used as the input for this job.
To extract characteristics from the photos, the logistic
regression method is utilized (Agarwal et al. 2020).
The SVM classifier is then used in order to classify.
This makes twin detection straightforward, and the
kNN classifier will eliminate trouble because of how
similar the facial photographs are. Recent research
have revealed that automatic facial recognition
technology performs noticeably worse when images
belong to identical twin brothers than to unrelated
individuals (Ramkumar, G. et al. 2021). The
378
Dasaratha, V. and Sheela, J.
An Accurate Approach to Classify Real Time Indian Twins Using SVM and Compare the Performance over Logistic Regression.
DOI: 10.5220/0012772700003739
Paper published under CC license (CC BY-NC-ND 4.0)
In Proceedings of the 1st International Conference on Artificial Intelligence for Internet of Things: Accelerating Innovation in Industry and Consumer Electronics (AI4IoT 2023), pages 378-384
ISBN: 978-989-758-661-3
Proceedings Copyright © 2024 by SCITEPRESS – Science and Technology Publications, Lda.

degradation of the face is shown to be far worse than
that of other biometrics, such as fingerprint and iris
scanning.
Face recognition software for people Since
humans are very adept at distinguishing persons from
photographs, performance is often used as a
benchmark for face recognition systems .To the best
of knowledge, no extensive research on humans been
conducted to address the issue of separating identical
twins solely only on facial images (Ptaszynski and
Masui 2018) (Deena et al. 2022). Here, test people's
ability to tell apart identical twin siblings or the same
person when they see two facial images. The ability
of humans to discern between the facial photographs
of identical twin siblings suggests that they may be
able to spot distinguishing characteristics that might
be utilized to enhance the accuracy of face
recognition technology software. In this study, human
volunteers look at pairs of facial pictures and rate how
positive they are that the faces belong to the same
individual or are identical twins (Subasi 2020).
2 MATERIALS AND METHODS
The dataset for this particular research study was
gathered from the Twinsburg Festival in Ohio. 25%
of the database is set aside for testing, while 75% is
reserved for training. A total of forty samples are
taken into account, divided into two sets, each of
which has twenty data samples. The G power was set
at 80%, the confidence interval was set at 95%, and
the threshold for the computation was set at where
Group 1 was a Logistic Regression (LR) method and
Group 2 was SVM algorithm, which includes 20
iterations each with the total of 40 iterations for 1430
sample size.
2.1 SVM and Logistic Regression
An edge detection linear filter used in image
processing is called a Gabor filter. Gabor filters are
band pass filters used in image processing for the
computation of stereo disparity, feature extraction
from textures, and texture analysis. A complex
oscillation is multiplied by a Gaussian envelope
function, these filters create impulsive responses.
These fundamental functions, according to Gabor, the
space-time-uncertainty product should be reduced.
Orientation-selective filters can be produced by
extending the functions to two dimension. The
response phase of the Gabor filter can occasionally be
roughly linear. By comparing the phase difference of
the left and right filter response, The disparity in the
stereo images is estimated using stereo techniques
that make advantage of this attribute. According to a
number of studies, the profile of simple-cell receptive
field in the mammalian brain can be well represented
by two-dimensional Gabor function.
Algorithm Steps for Logistic Regression
1: Input: Training data
2: Begin
3: For i = 1 to k
4: For each training data instance di.
5: Set the target value for the regression to zi = Yi-
P(1d)/[P(1|d,)(1−P(1]dj))]
6: Initialize the weight of instance d; to [P(1d;)(1 −
P(1d;))]
7: Finalize a ƒ (j) to the data with class value (Zj) and
weight (wj)
8: Classical label decision
9: Assign (class label: 1) if Pid > 0.5, otherwise (class
label: 2)
10: End
The number of scales and orientations, as well as
the maximum and minimum centre frequency, is used
to construct the spatial domain of the Gabor wavelets.
Ventral stream from v1 to v2 to v4 IT.Units of V1
implement Gabor filters (in S1 layer of). This layer
heavily filters an input grayscale image (120x120 or
160x160 pixels) using a range of Gabour filters in
various scales and orientations. As a result, a filter of
every size and orientation is centred on each pixel of
the input image. The filters are supplied in 4
orientations with 8 bands and 16 scales (resulting in
64 maps when multiplied by 4).
2.2 Pseudocode of the Support Vector
Machine (SVM) Algorithm
Input: D=[X,Y];X(array of input with m features),
Y(array of class labels)
Y=array(C)// Class label
Output: Find the performance of the system
function train_svm(X,Y,number_of_runs)
initialize:learning_rate=Math.random();
for learning_rate innumber_of_runs
error=0;
An Accurate Approach to Classify Real Time Indian Twins Using SVM and Compare the Performance over Logistic Regression
379

for i in X
if (Y[i]*X[i]*w))<1
The update: w=w+learning_rate*((X[i]*Y[i])*(-
2*(1/number_of_runs)*w)
Else
update:w=w+learning_rate*(-
2*(1/number_of_runs)*w)
end if
end
End
This describes the division of all classes into two
distinct categories. In the root-node of the decision
tree, an SVM classifier is trained using the image
processing samples from the first group as positive
instance and the sample from the second group as
negative example. Classes from the first clustering
group can be found in the first sub tree (on the left),
whereas classes from the second clustering-group can
be found in the second subtree (on the right). Once a
class per group has defined a leaf in the decision-tree,
the operation is repeated until no more classes per
group have defined leaves.
3 TESTING SETUP AND
TESTING PROCEDURE
Group = SVM classify (SVMstruct, Sample) Uses the
data from SVMStruct, a support vector machine
classifier structure created with the SVM train
function, to categorize every row of the data in Sample,
a data matrix. Similar to the training data required to
create an SVMstruct, a sample is a matrix with every
row designating an observation or duplicate and every
column designating a feature or variable. Therefore the
sample must have precisely the same number of
column as the training set. This is true because the
number of column affects the number of
characteristics. The word Group denotes the group to
which each row of sample has been assigned.
The result of A class membership is the k-NN
categorization. Before an object may be assigned to
one of its k closest classes, a majority of its
neighbours must concur on its classification (k is a
positive integer, typically small). The object is simply
given to the person who is closest when k = 1
neighbor's class. For the test set from the training set,
use k-nearest neighbor classification. For each row of
the test set, the nearest training set vectors are
identified, and the classification is determined by a
majority vote, with ties being broken at random
(Hura, Singh, and Hoe 2020). All candidates are put
up for vote the kth nearest vector, if there are ties.
3.1 Dataset
Twin information image processing technology for
these setups was gathered during data gathering
sessions during the Twins Days Festival in August
2009 in Twinsburg, Ohio. There are 186 participants
in the sample, 152 of whom are women and 34 men.
The biometric twins who participated in the data
collection assert that they are identical twins. To
formally validate the claims, no DNA testing was
done. The Human Subjects Institutional Review
Board at the University of Notre Dame authorised the
full data collection protocol for the festival (HSIRB).
3.2 Statistical Analysis
Using a statistical analysis SPSS application, the
Work is examined. In order to determine the best
method for classifying biometric real-time Indian
twins. Using SPSS, the means, standard deviations,
and mean and standard error for the SVM and LR
algorithms were calculated. Accuracy is used as the
dependent variable, and SVM and LR are treated as
the two independent variables. The sample t-test is
computed and analysed using SPSS Statistics
(Bandyopadhyay, Rout, and Satapathy 2021).
4 RESULTS
Figure 1 displays the Gabor filter's outcome. The
SVM classify method uses the input photos to
determine whether or not they are twins. The training
dataset consists of 20 images with 20 rows and
200x200 columns. After the SVM has been trained,
the training dataset is used to determine whether or
not a fresh image should be used as input. If the object
is a twin, the classification result should be 1, else it
should be -1. Fig 3 represents the SVM findings
depicts identical twins as 1 if not -1. Other biometrics
including the palm, fingerprint, iris, and speaker
identification have been used to make the distinction
between identical twins. Humans are trained to
recognise faces from birth, and there is strong
evidence that this activity takes place in the cortex's
fusiform face area. As a result, there has been a lot of
interest in creating face detection algorithms that
mimic how individuals view visual information. For
instance, face identification technology using Gabor
wavelet features with biological inspiration has
proved successful. Additionally, it has been found
AI4IoT 2023 - First International Conference on Artificial Intelligence for Internet of things (AI4IOT): Accelerating Innovation in Industry
and Consumer Electronics
380

that merging automatic algorithms with human
performance can greatly improve each party's
performance. The dataset is used as the input images
for identification and contains facial photographs of
identical twins taken over the course of two days in
August 2009 during the Twins Days Festival in
Twinsburg, Ohio. At random, 20 twin pairs are
chosen from the Twins Day Festival.
Table 1 clearly explains the Comparison of the
most accurate dataset's N=20 samples using the linear
SVM and LR algorithms 62.2650% and 31.0225%
respectively employing dataset size=7476, 80.5%
training data, and 19.5% test data in the sample (when
N=1).
Table 2 shows the performance of SVM and LR
on the using face and ID recognition dataset. The
results show that the mean accuracy for SVM was
62.2650, with a standard deviation of 3.56543 and a
standard error mean of 0.79725. For Logistic
Regression, the mean accuracy was 81.5815, with a
standard deviation of 4.05456 and a standard error
mean of 0.90663. In Table 3 shows the results of the
significance test, which indicates show the accuracy
of the two algorithms differs in a statistically
significant way. It is supported by the significance
value of less than p=0.408 (p<0.05) that Logistic
Regression is a superior method for this dataset and
task compared to Random Forest.
Table 3 illustrates the independent sample t-test
results produced by the significance level LR and
SVM algorithms have significant values of p = 0.408
(p<0.05). As a result, with a 95% confidence interval,
the significance threshold for both the LR and the
SVM algorithms is less than 0.05.
Table 1: Comparison between Linear SVM and LR algorithm with N=20 iteration samples of the dataset with the highest
accuracy 62.2650% and 31.0225% respectively in the sample (when N=1) using the dataset size=7172 and the 80.5% of
training & 19.5% of testing data.
Sample (N)
Dataset size/rows
SVM accuracy in %
LR accuracy in %
1
7182
69.78
89.33
2
7123
68.31
88.42
3
6987
67.53
87.53
4
6900
66.81
86.51
5
5087
65.23
85.23
6
5012
64.67
84.41
7
4987
63.33
83.63
8
4565
62.41
82.14
9
4444
61.30
81.90
10
4321
60.53
80.31
11
4312
60.40
79.28
12
4300
60.35
79.10
13
3099
60.26
78.98
14
3081
60.22
78.60
15
3097
59.78
78.38
16
3000
59.44
78.26
17
2098
59.38
77.68
18
2012
59.17
77.50
19
1089
58.28
77.30
20
1001
58.12
77.14
An Accurate Approach to Classify Real Time Indian Twins Using SVM and Compare the Performance over Logistic Regression
381
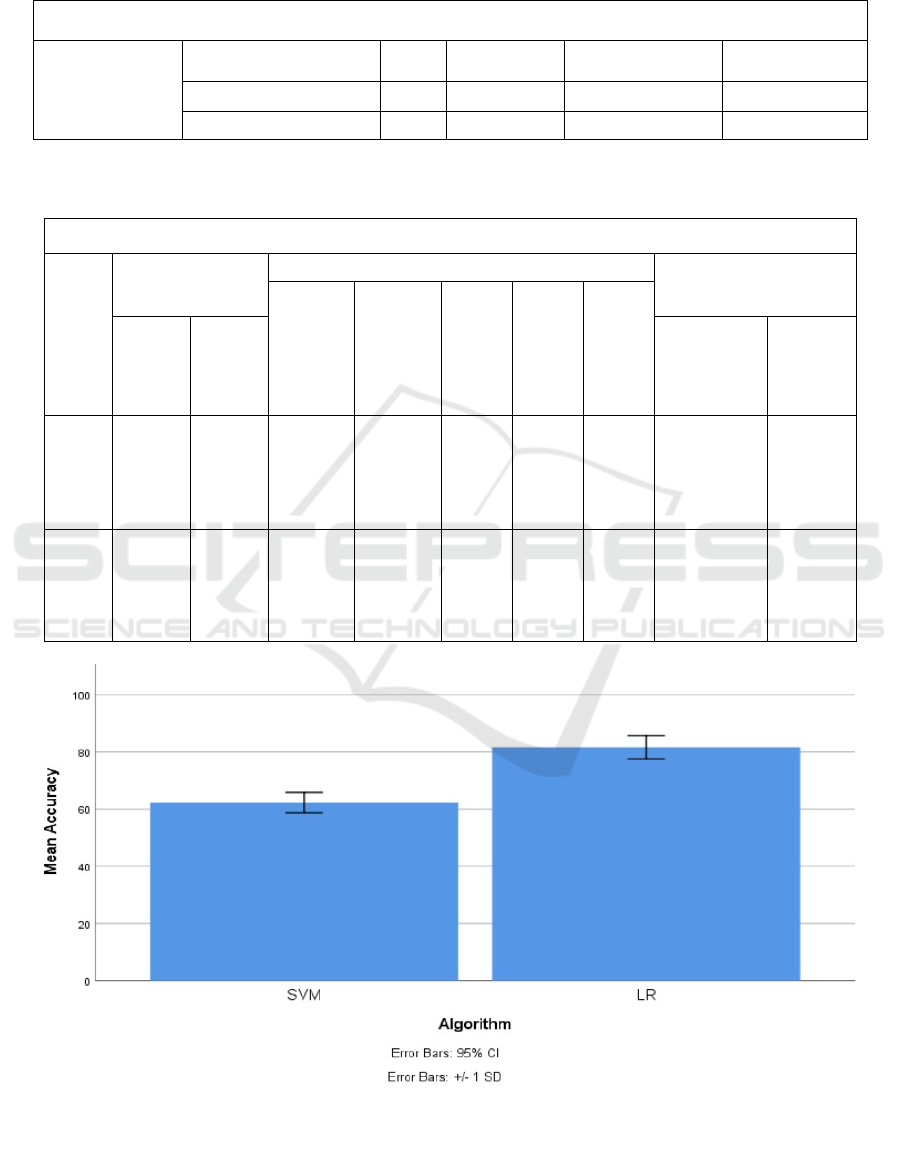
Table 2: Statistical results of SVM and LR algorithms. Mean error value, standard deviation and standard error mean for
SVM and LR algorithms are obtained for 20 iterations. It is observed that the mean for SVM (62.2650%) performed better
than the LR (31.0225%) algorithm.
Group Statistics
ACCURACY
ALGORITHMS
N
Mean
Std. Deviation
Std. Error Mean
SVM
20
62.2650
3.56543
.79725
LR
20
31.0225
4.05456
.90663
Table 3: The Independent sample t-test of the significance level SVM and LR algorithms results with significant values (p <
0.05). Therefore both the SVM and the LR algorithms have a significance level less than 0.05 with a 95 % confidence interval.
Independent Samples test
Accuracy
Levene's Test for
Equality of
Variances
T-test of Equality of Means
95% of the confidence
interval of the Difference
t
df
Sig (2-tailed)
Mean
Difference
Std Error
Difference
F
Sig.
Lower
Upper
Equal
Variance
Assumed
.699
.408
-16.000
38
.001
-
19.31650
1.20731
-21.7605
-16.8724
Equal
Variance
Not
Assumed
-16.000
37.389
.001
-
19.31650
1.20731
-21.7618
-16.8711
Figure 2: Comparison of precision between the SVM algorithm and LR. The mean precision of the SVM algorithm is better
than the LR, and the standard deviation of the SVM algorithm is highly better than the LR. X-axis: SVM algorithm vs LR
Algorithm and Y-axis represents Mean Precision values 土1 SD.
AI4IoT 2023 - First International Conference on Artificial Intelligence for Internet of things (AI4IOT): Accelerating Innovation in Industry
and Consumer Electronics
382

5 DISCUSSION
Additionally, conventional linear discriminant
analysis (LDA) and PCA-based holistic face
matching techniques are employed (LDA). The Using
the same 100 pairs as in the second experiment,
algorithms were assessed. Pittpatt and the traditional
matchmakers failed miserably at this
assignment(Khanna et al. 2021). This result is in line
with earlier research that showed how poorly face
photographs of biometric image processing identical
twins perform when subjected to face recognition
algorithms currently in use. Only the Cognitec
Matcher delivered results that were on par with
human performance and ROC. For comparison.
Additionally, It displays the average human
performance (as determined by all 25 participants).
Human observers outperform the machine matcher
practically across the whole range of False Accept
Rate, as Fi can be seen (FAR) Another drawback of
the twin study method is that if there are significant
gene-environment correlations or interactions, the
division of liability into separate genetic and
environmental components may be erroneous. Future
potential and restrictions of the image result for
indian twins You may simulate the many steps
involved in production using digital twin technology.
This is very helpful when creating a product or
manufacturing it. The virtual replica will receive real-
time data that will help fully optimise the
manufacturing process.
With a 92% accuracy rate compared to 91.32%
for logistic regression and SVM in the current system,
logistic regression is more accurate than SVM. The
suggested systems use Jupyter Notebook to train and
test the data, and SPSS Software to forecast the graph.
In the proposed system using face and ID recognition,
Logistic Regression's accuracy is anticipated to be
higher than SVM's. Using an independent dataset, the
effectiveness of logistic regression, SVM, CNN, and
other classifiers is evaluated. The assessment is
challenging because it is based on limited
data(Kyprianidis and Dahlquist 2021). When
comparing the performance of the classifiers because
it may seem easy, but it is not. The performance of
the classifiers is measured by the error rate. It is
successful if the classifier correctly categorises an
instance; otherwise, it is said to have made a mistake.
The number of data folds or partitions to utilise in this
strategy must be decided. In this study, employed a
10-fold cross-validation method, where each class is
equally represented in 10 segments of the data
(Gunjan and Zurada 2020). In this instance, the data
is split into biometric ten equal halves and used ten
times, with one tenth being used for testing and nine
tenths being used for training. Each tenth is tested
following the repeat. This enables us to estimate the
overall error using the data ten times (Tabii et al.
2018).
It has been demonstrated that the degradation of
the face is much worse than that of other biometrics,
such the iris and fingerprint. Human face recognition
ability is frequently used as a standard for evaluating
face recognition systems because people are quite
adept at identifying persons from photos (Brownlee
2019). To knowledge, no extensive human study has
been done to address the problem of telling identical
twins apart just from facial photographs. Here, test
people's ability to distinguish between facial images
of the same person and two sets of identical twin
siblings. The capacity of humans to discriminate
between identical twin brothers' faces in images
suggests that they may be able to identify features that
might be utilised to increase the face recognition
software's accuracy. In this study, volunteers rate how
certain they are that two facial photos are identical
twins or the same individual. after viewing pairs of
facial images (Huertas-Fernández et al. 2015).
6 CONCLUSION
The performance of two image processing algorithms
the current study looked into Support Vector Machine
(SVM) and Logistic Regression (LR) for
identification using face and ID recognition. The
findings clearly demonstrate that SVM has a better
accuracy of 62.2650% compared to Logistic
Regression's accuracy of 31.0225%. This shows that
SVM outperforms Logistic Regression Identification
using ID recognition as a superior and much more
suited technique.
REFERENCES
Agarwal, Basant, Valentina Emilia Balas, Lakhmi C. Jain,
Ramesh Chandra Poonia, and Manisha Sharma. (2020).
Deep Learning Techniques for Biomedical and Health
Informatics. Academic Press.
Babaeian, Mohsen, K. Amal Francis, Khalil Dajani, and
Mohammad Mozumdar. (2019). “Real-Time Driver
Drowsiness Detection Using Wavelet Transform and
Ensemble Logistic Regression.” International Journal
of Intelligent Transportation Systems Research.
https://doi.org/10.1007/s13177-019-0176-z.
An Accurate Approach to Classify Real Time Indian Twins Using SVM and Compare the Performance over Logistic Regression
383

Bandyopadhyay, Mainak, Minakhi Rout, and Suresh
Chandra Satapathy. (2021). Machine Learning
Approaches for Urban Computing. Springer Nature.
Brownlee, Jason. 2019. Deep Learning for Computer
Vision: Image Classification, Object Detection, and
Face Recognition in Python. Machine Learning
Mastery.
Deena, S. R., Kumar, G., Vickram, A. S., Singhania, R. R.,
Dong, C. D., Rohini, K., ... & Ponnusamy, V. K. (2022).
Efficiency of various biofilm carriers and microbial
interactions with substrate in moving bed-biofilm
reactor for environmental wastewater treatment.
Bioresource technology, 359, 127421.
Deshpande, A. V., Aynur Unal, Kalpdrum Passi, Dharm
Singh, Malaya Nayak, Bharat Patel, and Shafi Pathan.
(2018). Smart Trends in Information Technology and
Computer Communications: Second International
Conference, SmartCom 2017, Pune, India, August 18-
19, 2017, Revised Selected Papers. Springer.
Gaber, Mohamed Medhat, Frederic Stahl, and João Bártolo
Gomes ( 2013). Pocket Data Mining: Big Data on Small
Devices. Springer Science & Business Media.
Huertas-Fernández, I., F. J. García-Gómez, D. García-Solís,
S. Benítez-Rivero, V. A. Marín-Oyaga, S. Jesús, M. T.
Cáceres-Redondo, et al. 2015. “Machine Learning
Models for the Differential Diagnosis of Vascular
Parkinsonism and Parkinson’s Disease Using
[(123)I]FP-CIT SPECT.” European Journal of Nuclear
Medicine and Molecular Imaging 42 (1): 112–19.
Hura, Gurdeep Singh, Ashutosh Kumar Singh, and Lau
Siong Hoe. (2020). Advances in Communication and
Computational Technology: Select Proceedings of
ICACCT 2019. Springer Nature.
Khanna, Ashish, Deepak Gupta, Zdzisław Pólkowski,
Siddhartha Bhattacharyya, and Oscar Castillo. (2021).
Data Analytics and Management: Proceedings of
ICDAM. Springer Nature.
Kyprianidis, Konstantinos, and Erik Dahlquist. 2021. AI
and Learning Systems: Industrial Applications and
Future Directions. BoD – Books on Demand.
Lee, Changyong, and Daeil Kwon. (2018). “A Similarity
Based Prognostics Approach for Real Time Health
Management of Electronics Using Impedance Analysis
and SVM Regression.” Microelectronics Reliability.
Mutijah. 2018. “Logistic Regression on the Data of
Lecturer Performance Index on IAIN Purwokerto.”
Proceedings of the International Conference on
Mathematics and Islam. Ozdemir, Zeynep, and Bulent
Tugrul. 2019.
“Geofencing on the Real-Time GPS Tracking System and
Improving GPS Accuracy with Moving Average,
Kalman Filter and Logistic Regression Analysis.”
(2019) 3rd International Symposium on
Multidisciplinary Studies and Innovative Technologies
(ISMSIT).
Mahapatra, S., Vickram, A. S., Sridharan, T. B.,
Parameswari, R., & Pathy, M. R. (2016). Screening,
production, optimization and characterization of β-
glucosidase using microbes from shellfish waste. 3
Biotech, 6, 1-10.
Ptaszynski, Michal E., and Fumito Masui. (2018).
Automatic Cyberbullying Detection: Emerging
Research and Opportunities: Emerging Research and
Opportunities. IGI Global.
Ramkumar, G. et al. (2021). “An Unconventional Approach
for Analyzing the Mechanical Properties of Natural
Fiber Composite Using Convolutional Neural
Network” Advances in Materials Science and
Engineering vol. 2021, Article ID 5450935, 15 pages,
2021. https://doi.org/10.1155/2021/5450935
Reddy, V. Siva Malleswar, V. Siva Malleswar Reddy, and
T. Poovizhi. (2022). “A Novel Method for Enhancing
Accuracy in Mining Twitter Data Using Naive Bayes
over Logistic Regression.” 2022 International
Conference on Business Analytics for Technology and
Security (ICBATS).Suguna, M. Raja, M. Raja Suguna,
and P. Amaresh. 2022. “Enhanced Twitter Sentimental
Analysis Using Artificial Neural Network over Logistic
Regression towards Increase in Accuracy of
Prediction.” RECENT TRENDS IN SCIENCE AND
ENGINEERING.
Vadineanu, Serban, and Mitra Nasri. (2020). “Robust and
Accurate Period Inference Using Regression-Based
Techniques.” 2020 IEEE Real-Time Systems
Symposium (RTSS).
AI4IoT 2023 - First International Conference on Artificial Intelligence for Internet of things (AI4IOT): Accelerating Innovation in Industry
and Consumer Electronics
384
