
Exploratory Data Analysis and Machine Learning Models for Stroke
Prediction
Wei Fu
College of Information Science and Engineering, Northeastern University, Shenyang, China
Keywords: Stroke Prediction, Exploratory Data Analysis, Random Forest, Logistic Regression, XGBoost Models.
Abstract: Stroke risk assessment is a vital area of study in healthcare. This research delves into the application of
sophisticated analytical methods, combining exploratory data analysis (EDA) with advanced machine
learning techniques including Random Forest, Logistic Regression, and XGBoost models. These models were
deployed to predict stroke risk, leveraging key variables such as age, gender, BMI, and smoking habits.
Notably, the Random Forest models exhibited robust predictive capabilities, indicating promising prospects
for clinical implementation. By fusing the power of exploratory data analysis and machine learning algorithms,
this study significantly enhances the early detection of stroke cases. The findings hold substantial potential
for improving patient care and advancing the field of stroke risk assessment research. The integration of
exploratory data analysis and machine learning not only augments the understanding of stroke risk factors but
also paves the way for further scholarly investigations in this domain. The insights garnered from this research
serve as a cornerstone, offering valuable direction for future studies and contributing to the continuous
evolution of stroke risk assessment methodologies.
1 INTRODUCTION
Stroke is a sudden neurological disorder that typically
leads to severe health consequences such as paralysis,
speech impairment, and cognitive decline. Hence,
early detection and intervention are critical in
reducing the risk of Stroke. In the field of healthcare,
machine learning is widely employed for Stroke
prediction as it leverages extensive patient data and
multiple features to build accurate prediction models.
Machine learning techniques such as decision trees,
random forests, XGboost models and deep learning
have been applied to stroke prediction.
Exploratory Data Analysis (EDA) involves
assessing data quality by identifying missing values,
outliers, and duplicates, summarizing data statistics,
visualizing data distributions and relationships
through graphs, and helping select relevant features
for stroke prediction (Chun et al., 2021). It aids in
gaining insights into the nature of the stroke
prediction problem, guiding feature selection and
engineering, and providing a foundation for
subsequent machine learning model development,
ultimately enhancing model accuracy and
interpretability.
XGBoost models in this paper serve as a powerful
predictive tool for stroke prediction (Chung et al.,
2023). They excel in accuracy, feature importance
analysis, handling imbalanced data, capturing non-
linear relationships, and preventing over-fitting.
These characteristics make XGBoost a valuable
addition to the machine learning toolkit when
exploring stroke risk factors and developing
predictive models. Random Forest plays a key role in
predictive modelling (Fernandez-Lozano et al.,
2021). It assesses feature importance, handles non-
linearity, reduces over-fitting, deals with missing
data, and provides ensemble averaging for a stable
prediction model with valuable insights into factors
affecting strokes.
Logistic Regression is a crucial tool used to
forecast the likelihood of stroke based on various risk
factors. This statistical technique provides interpret-
able insights by quantifying how each risk factor
impacts stroke risk, aiding in risk assessment. Its
simplicity and transparency make it an essential
baseline model for comparing and evaluating the
performance of more complex machine learning
methods in the context of stroke prediction.
The significance of lifestyle factors and patient
medical records in influencing the likelihood of
stroke development has been examined in various
Fu, W.
Exploratory Data Analysis and Machine Learning Models for Stroke Prediction.
DOI: 10.5220/0012783300003885
Paper published under CC license (CC BY-NC-ND 4.0)
In Proceedings of the 1st International Conference on Data Analysis and Machine Learning (DAML 2023), pages 211-217
ISBN: 978-989-758-705-4
Proceedings Copyright © 2024 by SCITEPRESS – Science and Technology Publications, Lda.
211
studies (Meschia et al., 2014; Harmsen et al., 2006;
Nwosu et al., 2019; Pathan et al., 2020). Additionally,
the utilization of machine learning models for
forecasting stroke incidence has also gained traction
in recent research (Jeena and Kumar, 2016; Hanifa
and Raja-S, 2010). In his research paper,
Soumyabrata Dev proposes the utilization of neural
networks (NN), decision trees (DT), and random
forests (RF) for the prediction of strokes based on
patient attributes (Dev et al., 2022). In this paper,
various algorithms were used including logistic
regression, random forest and XGboost model to
stroke, and evaluates each algorithm according to
confusion matrix.
2 DATA
2.1 Dataset
The dataset, referred to as the “Stroke Prediction
Dataset” (Kaggle, Online), encompasses 5110
instances and is structured into 12 columns. In the
’gender’ column, there are 3 unique values, Male,
Female, and Other. The average age of these
observation is around 43 years old. Most of the
patient are never smoke before. The average glucose
level and BMI among all of the patients are
106.147677 and 28.893237, respectively.
2.2 Data Visualization
In light of the fact that this specific row in the dataset
does not exhibit any severely detrimental values that
could significantly impact the integrity of the data, it
is recommended to refrain from its deletion.
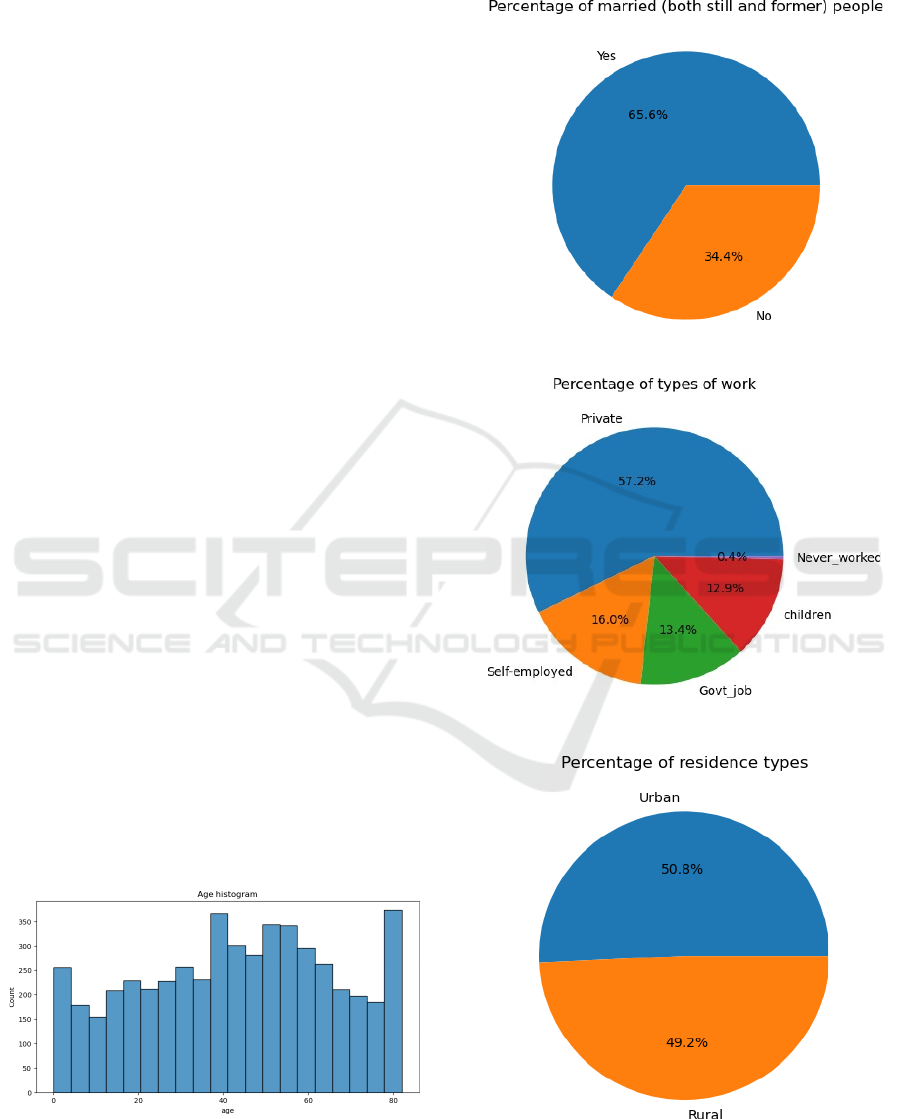
Subsequently, the author generates a histogram to
visually represent the age distribution within the
dataset, facilitating a comprehensive understanding
of the age distribution as depicted in “Figure 1”.
Figure 1: Age histogram (Original).
Here, several pie charts are presented, displaying
the per- centage distribution of categorical variables,
as shown in Figure 2 to 5.
Figure 2: Percentage of married people (Original).
Figure 3: Percentage of types of work (Original).
Figure 4: Percentage of residence types (Original).
DAML 2023 - International Conference on Data Analysis and Machine Learning
212
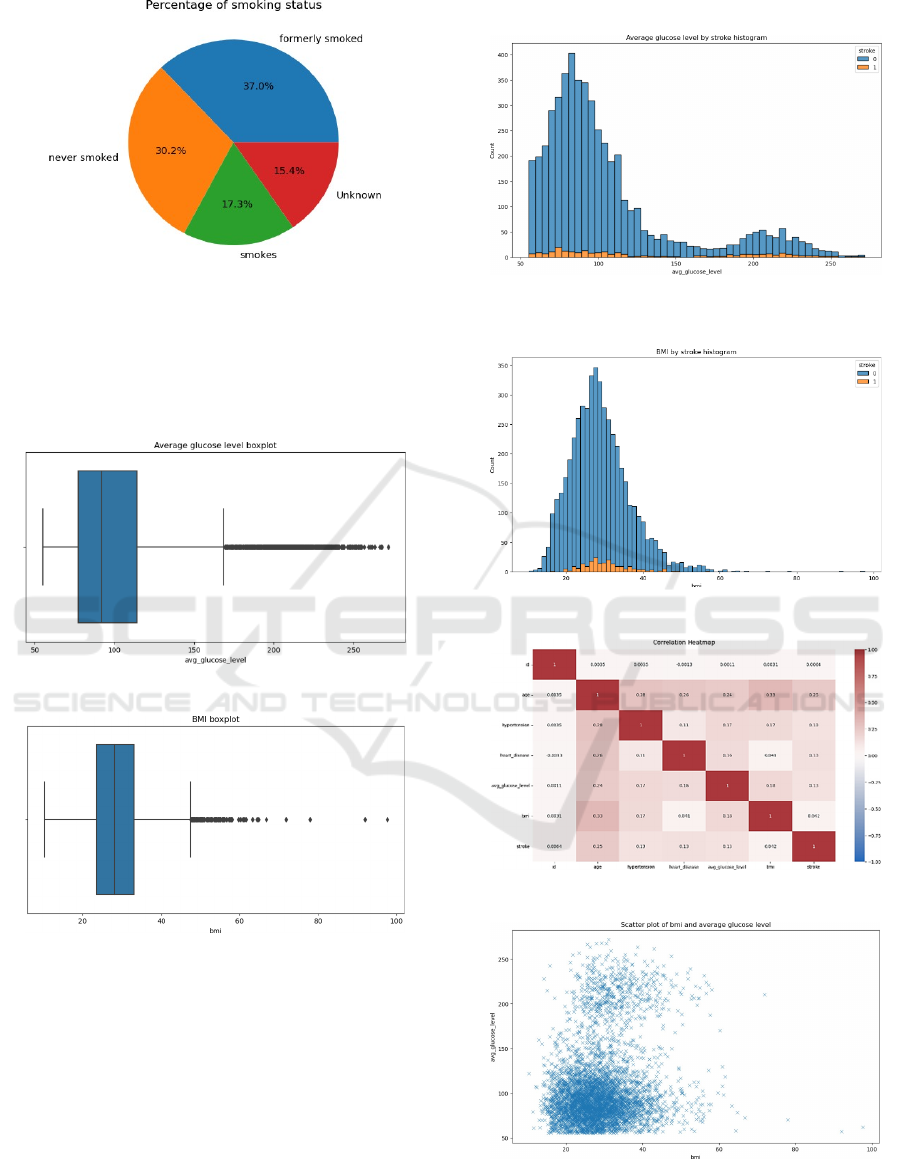
Figure 5: Percentage of smoking status (Original).
Also, it is worth noting that the dataset includes
patients across all age groups. To investigate the
presence of outliers, the author has provided several
box plots, which can be observed in Figure 6 and
Figure 7.
Figure 6: Average glucose level boxplot (Original).
Figure 7: BMI boxplot (Original).
There are some values that are maybe too high, so
whether these values are possible to have these
highly BMI should be observed. Figure 8 and Figure
9 are the two plots of the relationship between
average glucose level, BMI, and stroke. Lastly, the
author plot the correlation heatmap Figure 10 to show
whether the variables are correlated to each other.
Obviously, the most impact variable that effect on the
three causes assumption, stroke and BMI is age
variable. Below the author plot the scatter plot on the
BMI and average glucose level variables which
shown in Figure 11.
Figure 8: Average glucose level by stroke histogram
(Original).
Figure 9: BMI by stroke histogram (Original).
Figure 10: Correlation Heatmap (Original).
Figure 11: Scatter plot of BMI and average glucose level
(Original).
Exploratory Data Analysis and Machine Learning Models for Stroke Prediction
213

3 METHOD
In this project, the author employed exploratory data
analysis (EDA) to preprocess the data, followed by
the application of logistic regression, random forest,
and XGBoost for analysis.
3.1 Algorithm
(1) Logistic regression is a statistical approach used
to investigate data, considering the influence of one
or more independent factors on a particular outcome.
It finds its niche in tasks where the outcome is binary,
meaning it has only two possible categories, typically
referred to as 0 and 1.
(2) Random forest algorithm is a machine learning
technique that builds upon the principles of decision
trees. It is possible to perform feature selection by
evaluating the significance of each feature through
calculation. Random forest algorithm first uses the
bootstrap aggregation method to gain training sets. A
decision tree is built for each training set. When
sampling using bootstrap, one sample is selected
randomly from the original set (N samples) with
replacement. One training set is generated by
repeating this step N times. The probability that a
single sample will be selected in N times of samplin
g is:
P
= 1
−
(1
−
1
/N
)
N
(1)
When n goes to in infinity:
1
−
(1
−
1
/N
)
N
≈
1
−
1
/e
≈
0
.
632
(2)
This suggests that around 63.2% of the sample data is
consistently utilized as the training set for each
modeling iteration. Consequently, approximately
36.8% of the training data remains unused and does
not contribute to the model training process. These
unused data points are commonly referred to as “out-
of-bag data” or OOB data.
Consider a decision tree denoted
as
G
−
n
(
x
n
)
,
a
constituent element of a random forest model. This
specific decision tree is purposefully engineered to
provide predictions solely for the data point
x
n
.
Assuming a total of
N
decision trees exist within
the random forest, the out- of-bag error,
conventionally symbolized as r
1
, may be precisely
defined as follows:
The out-of-bag error (r1) is
computed
through the
process of averaging the prediction errors for N data
points, involving the comparative analysis between
the actual values (yn) and the predictions rendered by
G−n (xn).
To offer an alternative perspective:
Imagine the presence of an error metric denoted
as r2 designed to quantify the errors associated with
out-of-bag (OOB) samples following random
permutations. In this particular context, the feature
importance (I) associated with a specific feature, for
instance, xn, can be elucidated as follows:
The feature importance (I(xn)) is computed as the
average across N iterations, with each iteration
entailing the subtraction of r2 from r1.
(3) XGBoost, which stands for Extreme Gradient
Boosting, is a powerful and widely used machine
learning technique. It’s particularly well-suited for
situations where you have structured or tabular data
and are working on supervised learning tasks. It
operates as an ensemble learning technique that
amalgamates the forecasts of numerous independent
models, often in the form of decision trees.
3.2 Evaluation Criteria
(1) Confusion matrices are useful in the context of
stroke prediction (or any binary classification
problem) for evaluating the performance of predictive
models. A confusion matrix presents a detailed
summary of how well a model’s predictions match
the real outcomes in the dataset. It is particularly
valuable for assessing the model’s ability to make
accurate predictions and for understanding the types
of errors it makes.
(2) Accuracy measures the model’s ability to make
correct predictions by considering the total correct
predictions (TP + TN) in relation to all predictions
made. It provides a holistic assessment of the model’s
overall effectiveness.
(3)
(3) Precision is a performance metric that assesses the
reliability of a model’s positive predictions. It is
calculated by taking the ratio of True Positives (TP)
to the sum of True Positives (TP) and False Positives
(FP). In essence, precision informs the frequency with
which the model’s positive predictions are accurate.
(4) Recall tells how good the model is at finding all
the positive cases. It’s calculated by dividing the
number of true positives (correctly identified
positives) by the sum of true positives and false
negatives. In the context of stroke prediction, recall is
crucial to avoid missing high-risk stroke cases.
(5) The F1-score is a way to express both Precision
and Recall with a single number, utilizing the
DAML 2023 - International Conference on Data Analysis and Machine Learning
214
harmonic 5ean to find a balanced measure. Because
recall and precision cannot be used independently to
assess a model, F1-score is used to balance the two
indicators and make them compatible. The F1-Score
provides a balanced assessment of precision and
recall, essentially striking a middle ground between
the two metrics. It takes into account both precision
(the accuracy of positive predictions) and recall (the
sensitivity to detect true positives). The calculation
involves a specific mathematical formula.
4 RESULT
4.1 Extract Key Features
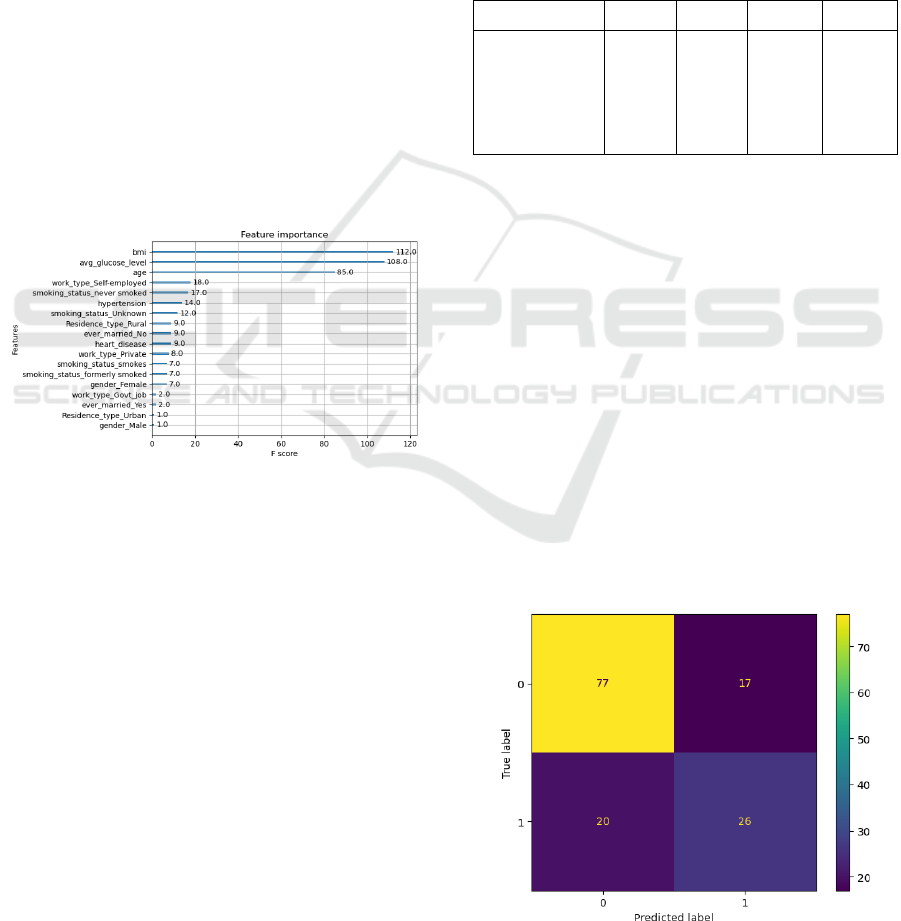
From the importance plot shown in Figure 12, the age
is usually the feature that have the most impact in this
model, and come with BMI and average glucose
level, respectively. Unlike other models, the most
important feature in this model is BMI, followed by
avg glucose level, and then comes age.
Figure 12: All features and their important score (Original).
4.2 Predict Result
In summary, the results obtained from the
experiments in Table 1 in this research provide
important information about how different machine
learning models perform when it comes to predicting
strokes. Among the models evaluated, the Random
Forest model emerged as the standout performer,
consistently achieving high F1 scores, recall,
precision, and accuracy. This underscores its
effectiveness in precisely recognizing individuals
who are at a heightened risk of experiencing a stroke.
While Logistic Regression and Decision Tree models
exhibited respectable performance, their simplicity
and interpretability make them viable options in
scenarios where model transparency is paramount.
Conversely, the XGBoost model’s relatively poor
performance suggests a need for further refinement or
exploration of alternative algorithms for stroke
prediction tasks. Ultimately, the choice of the most
suitable model should be guided by the specific
demands of the application, with consideration given
to factors such as model interpretability,
computational resources, and the need for fine-
tuning. Nonetheless, these findings underscore the
prominence of the Random Forest model as a robust
choice for stroke prediction in most scenarios. Future
research may focus on enhancing the performance of
other models or investigating ensemble approaches to
further improve predictive accuracy.
Table 1: Performance metrics of various models.
Model F1-score Recall Precision Accuracy
Logistic
Re
g
ression
0.612245 0.652174 0.576923 0.728571
Decision Tree 0.613861 0.673913 0.563636 0.721429
Random Forest 0.969671 0.987983 0.952026 0.941368
XGBoost 0.273438 0.555556 0.181347 0.848534
5 EVALUATION
In the evaluation phase, the author observed strong
precision, recall, and F1-scores in Figure 12-15. In a
hospital setting, the false negative area in the
confusion matrix is of particular concern, as it
represents cases where the model failed to predict a
medical condition. This can have serious
consequences, especially if timely intervention is
needed. Bringing this evaluation perspective to the
results, the author find that BMI, average glucose
level, and age stand out with high F1-scores.
Specifically, BMI has an F1-score of 112, average
glucose level is at 108, and age is at 85. These
findings emphasize the importance of these factors in
improving early detection and enhancing patient care
in real-world clinical applications.
Figure 13: Logistic Regression (Original).
Exploratory Data Analysis and Machine Learning Models for Stroke Prediction
215
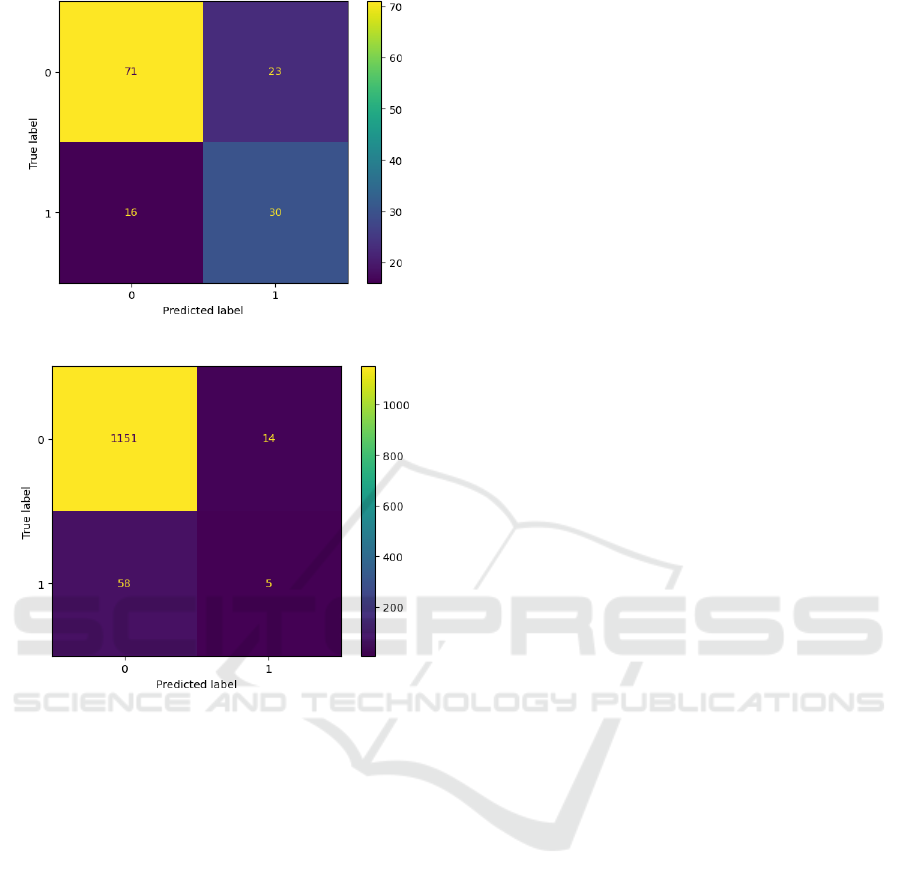
Figure 14: Decision Tree (Original).
Figure 15: RF (Original).
6 DISCUSSION
The training of the model is completed in a short
time. Also, the precision, recall, and accuracy are
very high. From the above table and figures, it shows
that the Random Forest model achieves 94% high
accuracy. Comparing Random Forest with logistic
regression, they achieve different levels of accuracy,
precision, and recall. This indicates that some
features are useless in predicting tumors.
7 CONCLUSION
Within the framework of this experimental study, the
standout performer emerged as the Random Forest
model, boasting an impressive accuracy rate
exceeding 90%. Notably, it also exhibited
exceptional F1 score and AUC values, underscoring
its proficiency in stroke prediction. In a comparative
analysis with other predictive models, such as
Logistic Regression and XGBoost, Random Forest's
performance outshone its counterparts. The inherent
strength of the Random Forest model lies in its
adeptness at handling complex feature interactions
and non-linear patterns within the dataset, attributes
that contribute to its heightened predictive accuracy.
This exceptional performance positions Random
Forest as a prime candidate for further refinement
and potential real-world application in the realm of
stroke risk assessment. Nevertheless, the journey
doesn't end here. Additional research and meticulous
model fine-tuning are warranted to fully harness and
validate the capabilities of Random Forest in
practical clinical settings. Such endeavors are
essential to elevate the accuracy of stroke prediction
and, in turn, optimize patient care outcomes. This
research serves as a pivotal stepping stone, paving
the way for enhanced stroke prediction
methodologies and, ultimately, improved patient
well-being.
REFERENCES
M. Chun, R. Clarke, B. J. Cairns, D. Clifton, D. Bennett, Y.
Chen, et al., ”Stroke risk prediction using machine
learning: A prospective cohort study of 0.5 million
Chinese adults,” Journal of the American Medical
Informatics Association, vol. 28, no. 8, pp. 1719-1727,
2021.
C. C. Chung, E. C.-Y. Su, J. Chen, Y. Chen, and C.-Y. Kuo,
”XGBoost- Based Simple Three-Item Model
Accurately Predicts Outcomes of Acute Ischemic
Stroke,” Diagnostics, vol. 13, no. 5, pp. 842, 2023.
C.
Fernandez-Lozano,
P.
Hervella,
V.
Mato-Abad,
M.
Rodr
´
ıguez-Ya
´
n
˜
ez,
S.
Sua
´
rez-Garaboa,
I.
Lo
´
pez-
Dequidt,
A.
Estany-Gestal,
T.
Sobrino,
F.
Campos, J.
Castillo, et al., ”Random forest-based prediction of
stroke outcome,” Scientific reports, vol. 11, no. 1, pp.
10071, 2021.
J. F. Meschia, C. Bushnell, B. Boden-Albala, L. T. Braun,
D. M. Bravata,S. Chaturvedi, M. A. Creager, R. H.
Eckel, M. S. V. Elkind, M. Fornage, et al., ”Guidelines
for the primary prevention of stroke: a statement for
healthcare professionals from the American Heart
Association/American Stroke Association,” Stroke,
vol. 45, no. 12, pp. 3754-3832, 2014.
P. Harmsen, G. Lappas, A. Rosengren, and L. Wilhelmsen,
”Long-term risk factors for stroke: twenty-eight years
of follow-up of 7457 middle-
aged
men
in
Go¨teborg,
Sweden,”
Stroke,
vol.
37,
no.
7,
pp.
1663-1667,
2006.
C. S. Nwosu, S. Dev, P. Bhardwaj, B. Veeravalli, and D.
John, ”Predicting stroke from electronic health
records,” in 2019 41st Annual International Conference
DAML 2023 - International Conference on Data Analysis and Machine Learning
216

of the IEEE Engineering in Medicine and Biology
Society (EMBC), pp. 5704-5707, 2019.
M. S. Pathan, Z. Jianbiao, D. John, A. Nag, and S. Dev,
”Identifying stroke indicators using rough sets,” IEEE
Access, vol. 8, pp. 210318- 210327, 2020.
R.S. Jeena and Sukesh Kumar, ”Stroke prediction using
SVM,” in 2016 International Conference on Control,
Instrumentation, Communication and Computational
Technologies (ICCICCT), pp. 600-602, 2016.
S.M. Hanifa and K. Raja-S, ”Stroke risk prediction through
non-linear support vector classification models,” Int. J.
Adv. Res. Comput. Sci, vol. 1, no. 3, p. 4753, 2010.
S. Dev, H. Wang, C. S. Nwosu, N. Jain, B. Veeravalli, and
D. John, ”A predictive analytics approach for stroke
prediction using machine learning and neural
networks,” in Healthcare Analytics, vol. 2, p. 100032,
2022.
Kaggle, Stroke Prediction Dataset, [online] Available:
https://www.kaggle.com/datasets/fedesoriano/stroke-
prediction-dataset
Exploratory Data Analysis and Machine Learning Models for Stroke Prediction
217
