
Butterfly and Moth Image Recognition Based on Residual
Neural Network
Fengwei Liu
Glasgow College, University of Electronic Science and Technology, Chengdu, China
Keywords: Butterflies or Moths Image Recognition, ResNet, Convolutional Neural Network, Adam.
Abstract: Image recognition is presently a central area of study within the machine learning domain. Convolutional
neural networks (CNN) are a special type of artificial network model commonly used for image processing
and recognition. The design inspiration for this deep learning model comes from human visual recognition
systems, whose core idea is to use convolution operations to extract features from images. Then the network
utilizes a series of different functional hidden layers to ultimately recognize and classify the input image
data. This article constructs a deep CNN model utilizing the ResNet50 for image recognition and
classification on a dataset containing butterfly and moth images, and analyzes the classification results.
After 10 epochs, the CNN model demonstrated a 94.3% accuracy rate when applied to the test dataset.
According to research findings, the model exhibits commendable accuracy on the dataset. Nevertheless,
owing to the limited number of training epochs, the performance on the test set fell short of optimal
outcomes. Therefore, augmenting the number of epochs can be a viable approach to enhance the model's
classification accuracy for the dataset.
1
INTRODUCTION
Over the past few years, image recognition and
classification have emerged as pivotal areas of
investigation within the realm of computer vision.
Image classification, a cornerstone in computer
vision, involves categorizing images into distinct
classes based on their semantic attributes. It serves as
the cornerstone for various advanced visual tasks,
including but not limited to object detection, image
segmentation, and object tracking. Image
classification and recognition have extensive
applications in many fields, such as face recognition,
autonomous driving, intelligent video analysis, and
image recognition in the medical field (Chauhan et
al, 2018). CNN include input layers, convolutional
layers, pooling layers, Dense layers, etc., which
process raw pixel values or pixel values that have
undergone simple preprocessing (such as centering
and scaling), and are often used for image
recognition and classification. Traditional network
structures such as AlexNet and VGGNet have the
problem of insufficient network structure depth,
which means that when the network structure is
deeper, the classification performance of the model
does not meet expectations. In the ILSVRC 2015
classification task, Kaiming, Xiangyu, Shaoqing
introduced a novel deep CNN framework, which is
commonly referred to as the ResNet architecture (He
et al, 2016). A 152 layer network structure was
established on the ImageNet dataset and compared
with traditional network structures such as VGGNet
and GoogLeNet. The results showed that the
established residual neural network had higher
accuracy while maintaining lower network
complexity, indicating a lower risk of overfitting.
This article implements a method for recognizing
and classifying butterfly or moth images in datasets
based on ResNet network architecture. Expanding
the application of CNN in image recognition and
classification can enhance the precision and
efficiency of butterfly classification, benefiting
biologists in their assessments. This article uses a 50
layer residual neural network for image feature
extraction and recognition, while the Dense layer
achieves the final classification of the
image. Moreover, a dropout layer was added to the
model to randomly shut down neurons in the dense
layer, this aids in further diminishing the potential
for overfitting in the model. Employing Adam
optimization functions within the network
architecture enhances the model's learning
efficiency.
Liu, F.
Butterfly and Moth Image Recognition Based on Residual Neural Network.
DOI: 10.5220/0012798500003885
Paper published under CC license (CC BY-NC-ND 4.0)
In Proceedings of the 1st International Conference on Data Analysis and Machine Learning (DAML 2023), pages 211-217
ISBN: 978-989-758-705-4
Proceedings Copyright © 2024 by SCITEPRESS – Science and Technology Publications, Lda.
211

The following content was written in the
subsequent part of this article: Part 2 summarizes the
relevant work in the field of deep learning, which is
a literature review. The third part introduces the
established deep CNN model and provides a detailed
description of its internal architecture and the
optimization function Adam of the model. In the
fourth section, we elucidate the model's
classification outcomes on the dataset and conduct a
comprehensive performance assessment. Section 5
summarizes the main work of this article and
proposes the shortcomings of the research.
2
RELATED WORKS
With the development of machine learning, related
algorithms are facing new opportunities and
challenges in computer vision. In image
recognition, the classification performance of deep
learning algorithms for images is becoming
increasingly accurate. The following is a list of
relevant developments:
R. Chauhan, K.K. Ghanshala, R.C. Joshi, et al.
developed two distinct CNN architectures for both
the MNIST and CIFAR-10 datasets, exclusively
relying on CPU-based computation (Chauhan et al,
2018). CNN performed well on the MNIST dataset,
achieving an accuracy of 99.6% after 10
epochs. On the CIFAR-10 dataset, due to
insufficient training epoch size, the accuracy is only
80.17%. Furthermore, a suggestion is put forth to
augment the training epoch as a means to further
enhance the model's accuracy.
Deep learning in medicine helps to effectively
diagnose epidemics. Boukaye, Bernard, Fana et al.
used efficient CNN to effectively recognize and
classify pathogen images of cholera and malaria in
microscopic images, ultimately achieving an
accuracy of 94% (Traore et al, 2018). And it is
proposed that integrating pathogen image
recognition methods from this microscope into a
medical microscope can help diagnose and prevent
crises caused by epidemics. HYU, SOYOUN,
KYUNGYONG et al. based on ResNet deep CNN
and recognition of chest X-ray images, can
effectively diagnose cardiac hypertrophy (Yoo et al,
2021). The accuracy of model recognition is close to
80%. In addition, this work evaluated and compared
the classification results obtained by four types of
optimization functions SGD, Adam, AdaGrad, and
RMSProp in neural networks. According to this
work, when SGD is used as the optimizer in neural
networks, the model performs best in diagnosing
cardiac hypertrophy.
Weather recognition stands as a pivotal
application in the field of computer vision. Bin,
Xuelong, Xiaoqiang et al. assigned multiple weather
condition labels to each weather image in two
datasets, and completed the multi label classification
task based on a special CNN-RNN network model
(Zhao et al, 2018). In this model, CNN is extended
to a channel attention model. This model not only
effectively identifies weather, but also explores the
interrelationships within different weather conditions.
This study has markedly enhanced the model's
precision when contrasted with the conventional
approach of treating weather recognition as a
single-label classification task. Furthermore, we
conducted a comparative analysis involving AlexNet,
multi-label versions of VGGNet, ML-KNN,
ML-ARAM, and various other network models
using two distinct weather recognition datasets.
Finally, it was found that the CNN-RNN performed
best in multi label classification tasks on this dataset.
3
CLASSIFIER MODEL
3.1 CNN Model
CNN typically consist of several layers. They
include input layers, convolutional layers, pooling
layers, and dense layers (commonly referred to as
fully connected layers) and so on (Gu et al, 2018).
Convolutional layers are adept at extracting
pivotal features from the input image data. Within
neural networks, these layers necessitate multiple
convolutional kernels for computation. Each element
within these kernels corresponds to the network's
weight coefficients and bias vectors, taking
inspiration from the feedforward neural networks
found in biological organisms. The location on the
output feature map of the convolutional layer, in
relation to the pre-convolution input region, defines
the portion where the features of the CNN perceive
the input image. This region's size is contingent
upon the dimensions of the convolutional kernel
employed in the correlation operations of the
convolutional layer, commonly referred to as the
"receptive field. " (Gu et al, 2018).
Pooling layer is used for downsampling
convolutional layers, thereby reducing the number of
data points. Two prevalent pooling techniques are
frequently employed: average pooling and max
pooling.
Dense layer is used to classify the extracted
features mentioned above (similar to the fully
DAML 2023 - International Conference on Data Analysis and Machine Learning
212
connected layer in general neural networks) (Gu et
al, 2018). Before entering the dense layer, the 3D
data is elongated into a one-dimensional vector (i.e.
the data is flattened). A dense layer, also known as a
fully connected layer, signifies that each node within
it is intricately linked to every node in the preceding
layer. This layer's purpose is to amalgamate and
synthesize the features that have been extracted from
the preceding layers.
3.2 Residual Neural Network
Residual neural network is a classic deep CNN
model. The ResNet50 network structure
usedindicates that this CNN has 50 layers.
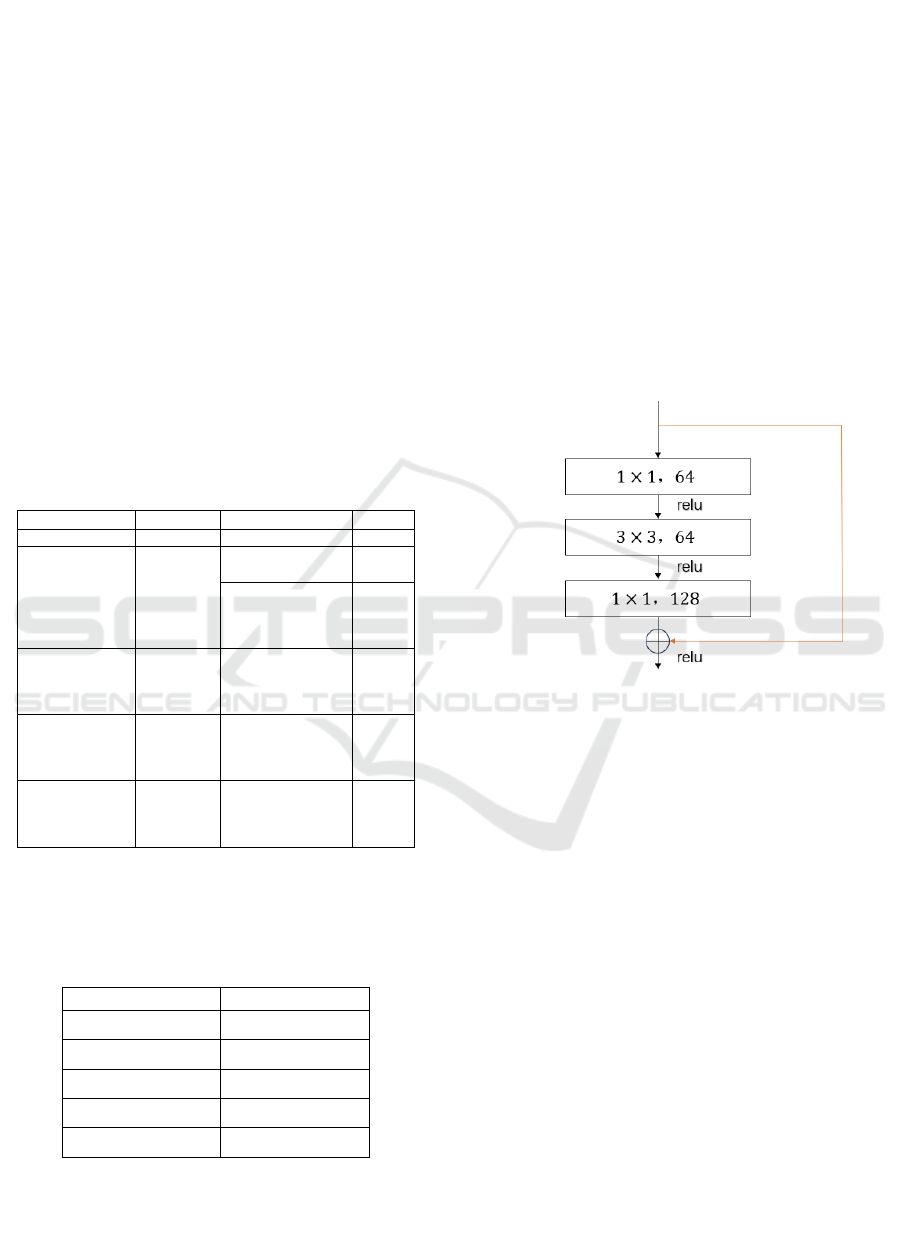
The table 1 lists a basic network structure
configuration of ResNet. Table 1 illustrates the
network architecture of ResNet50, a deep CNN that
serves as the primary model in this study (He et al,
2016).
Table 1: Basic ResNet50 Structure Configurations.
Conv la
y
er out
p
ut size 50-la
y
ers number
Sta
g
e1:Conv
_
1 112x112 7x7,64,stride2
Stage2:Conv_2
56x56
3x3
max_pool,stride2
)256(1x1
)64(3x3
)64(1x1
,
,
,
3
Stage3:Conv_3 28x28
)512(1x1
)128(3x3
)128(1x1
,
,
,
4
Stage4:Conv_4 14x14
)1024(1x1
)256(3x3
256,1x1
,
,
)(
6
Stage
5:Conv_5
7x7
)2048(1x1
)512(3x3
)512(1x1
,
,
,
3
The internal architecture of the entire network model
established based on ResNet50 in this article is
described in detail in Table 2.
Table 2: Network Structure.
Layer Size/Shape
ResNet50 2048
Flatten 2048
Dense_1 512
Dropout 512
Dense_2 100
ResNet with different depths has the following
characteristics: At the initial stage, they all
underwent the same process of convolutional layer
conv1 and maximum pooling (max-pool).
ResNet neural networks of different depths are
all composed of stacked basic residual blocks, and
the basic residual module of the 50 layer ResNet is
labeled as Bottleneck, which includes three
convolutions. The residual blocks stacked by ResNet
in stage 2 are identical and there is no downsampling.
The first residual block stacked in stages 3 to 5 in
the ResNet model is different from the remaining
residual blocks. Each stage (3-5 stages)
downsampling the feature image size, and
downsampling is sent at the first residual block in
each stage, while the remaining residual blocks are
not downsampling (with the same size).
The residual block model in the ResNet network
model is shown in Fig.1:
Figure 1: The residual block model (Picture credit:
Original).
The Fig.1 shows a block proposed for deep networks,
called the "bottomleneck" block, with the main
purpose of dimensionality reduction. Firstly, a 1x1
convolution is used to reduce the 256 dimensional
channel to 64 channels, and finally, a 1x1
convolution of 256 channels is used to recover, such
as ResNet-50.
3.3 Dropout to Reduce Overfitting
While learning different features from the dataset,
neural networks also learn noise from the dataset.
This results in good performance of the network on
the training set, but poor performance on new data
(test set), which is known as overfitting. To solve the
overfitting problem, we add a dropout layer to the
network structure. In this article, a dropout layer is
added to the ResNet network structure to prevent
overfitting from occurring (Srivastava et al, 2014).
In neural networks, dropout refers to the random
deletion of some nodes in the input layer and hidden
layer with probability p, and all forward and
Butterfly and Moth Image Recognition Based on Residual Neural Network
213

backward connections to the deleted nodes will be
temporarily deleted, thereby creating a new network
architecture. The probability parameter of keeping
hidden nodes in the network is set to 0.5. Within
each training batch, a substantial reduction in
overfitting can be achieved by introducing a random
node dropout mechanism in specific hidden layers.
This strategy effectively mitigates interdependencies
among feature detectors, where individual detectors
are less reliant on the output of other detectors for
their function.
3.4 Adam Optimizer
The Adam optimizer, as referenced in, represents a
modification of the gradient descent algorithm
utilized for weight updates within neural networks
(Zhang, 2018). It integrates principles from both the
Stochastic Gradient Descent Algorithm (SGD) and
the Adaptive Learning Rate Algorithm, offering the
advantage of expedited convergence and reduced
training duration (Mehta, 2019). The Adam
optimizer calculates the independent adaptive
learning rate for each parameter without the need for
manual adjustment of the learning rate, making it
widely used in practice.
Neural network optimization in deep learning.
The Adam optimizer is a dynamic optimization
algorithm capable of fine-tuning the learning rate by
leveraging past gradient information. This approach
amalgamates concepts from two distinct
optimization algorithms, RMSProp and Momentum,
and normalizes parameter updates to ensure that
each parameter update has a similar magnitude,
thereby improving training effectiveness (Zou et al,
2019). The Adam optimizer excels in numerous
practical applications, particularly when employed
to train deep neural networks on extensive datasets
(Mehta, 2019).
The main function of the Adam optimizer is to
update neural network parameters based on gradient
information, thereby minimizing the loss function.
Specifically, its main functions include:
The Adam optimizer possesses the ability to
dynamically fine-tune the learning rate by drawing
insights from historical gradient information (Zhang,
2018). This adaptive learning rate mechanism allows
for the application of a larger learning rate during
the initial training phases, facilitating rapid
convergence. As the training progresses into its later
stages, a smaller learning rate is employed to refine
the search for the minimum of the loss function,
enhancing accuracy.
The Adam optimizer can adjust momentum
parameters to balance the impact of the previous
gradient and the current gradient on parameter
updates, thereby avoiding premature trapping in
local minima.
The Adam optimizer normalizes the updates of
parameters, so that each parameter update has a
similar magnitude, thereby improving the training
effect.
The Adam optimizer combines the idea of L2
regularization to regularize parameters during
updates, thereby preventing neural networks from
overfitting training data.
Overall, the Adam optimizer can quickly and
accurately minimize the loss function, improving the
training effectiveness and generalization ability of
deep neural networks.
4
RESULTS
4.1 Dataset
The dataset used in this article is used to identify the
species of butterflies and moths. The dataset
contains a total of 100 category labels for butterflies
or moths, and each image has a size of 224×224
pixels (50176 pixels) as input to the neural network.
The training set consists of 12594 images, divided
into 100 sub directories, each corresponding to a
species. The test dataset comprises 500 images,
organized into 100 subdirectories, each containing 5
test images per category. Additionally, within the
same dataset, there are 5 validation images per
category, yielding the same overall count of 500
images. Fig.2 visually presents a selection of images
from this dataset.
Figure 2: Some samples of datasets (Picture credit:
Original).
DAML 2023 - International Conference on Data Analysis and Machine Learning
214
4.2 The Loss Function
The loss function is a non negative function that
quantifies the dissimilarity between the predicted
outcome, denoted as f(x), produced by a neural
network, and the ground truth value, Y. Smaller
values of the loss function correspond to improved
predictive performance, indicating better model
results.
In this research, the employed loss function is the
softmax loss function, and its mathematical
representation is as follows:
LYf
x
=-
1
n
log
e
fY
i
∑
e
f
j
c
j=1
(1)
n
i=1
From a standard form, the softmax loss function
should be classified as logarithmic loss. In
supervised learning, due to its widespread use, it
forms a separate category. The softmax loss function
can be seen as a natural extension of the logistic
regression model, especially applicable in the
context of multi-class classification tasks. It
frequently finds application as the preferred loss
function in CNN models. At its core, the softmax
loss function serves the purpose of mapping an
arbitrary real vector 'x' of dimension 'k' to another
real vector of the same dimension 'k'. This mapping
operation ensures that each element in the resulting
output vector falls within the range of (0,1), that is,
the softmax loss function outputs the prediction
probability of each category. The softmax loss
function, renowned for its capacity to facilitate
inter-class separability, finds extensive application in
a spectrum of tasks including classification,
segmentation, face recognition, automatic image
annotation, and face verification. Notably, it excels
in optimizing inter-class distances, yet its
performance in optimizing intra-class distances is
comparatively less pronounced.
The softmax loss function is renowned for its
ability to facilitate inter-class separability and is
frequently employed in tackling feature separation
challenges within the realms of multi-classification
and image annotation tasks. In CNN-based
classification scenarios, the softmax loss function is
typically designated as the primary loss function.
Nevertheless, the features derived from the softmax
loss function often lack the requisite level of
distinctiveness. As a remedy, it is common practice
to complement it with contrast loss or center loss
techniques to augment discriminative capabilities.
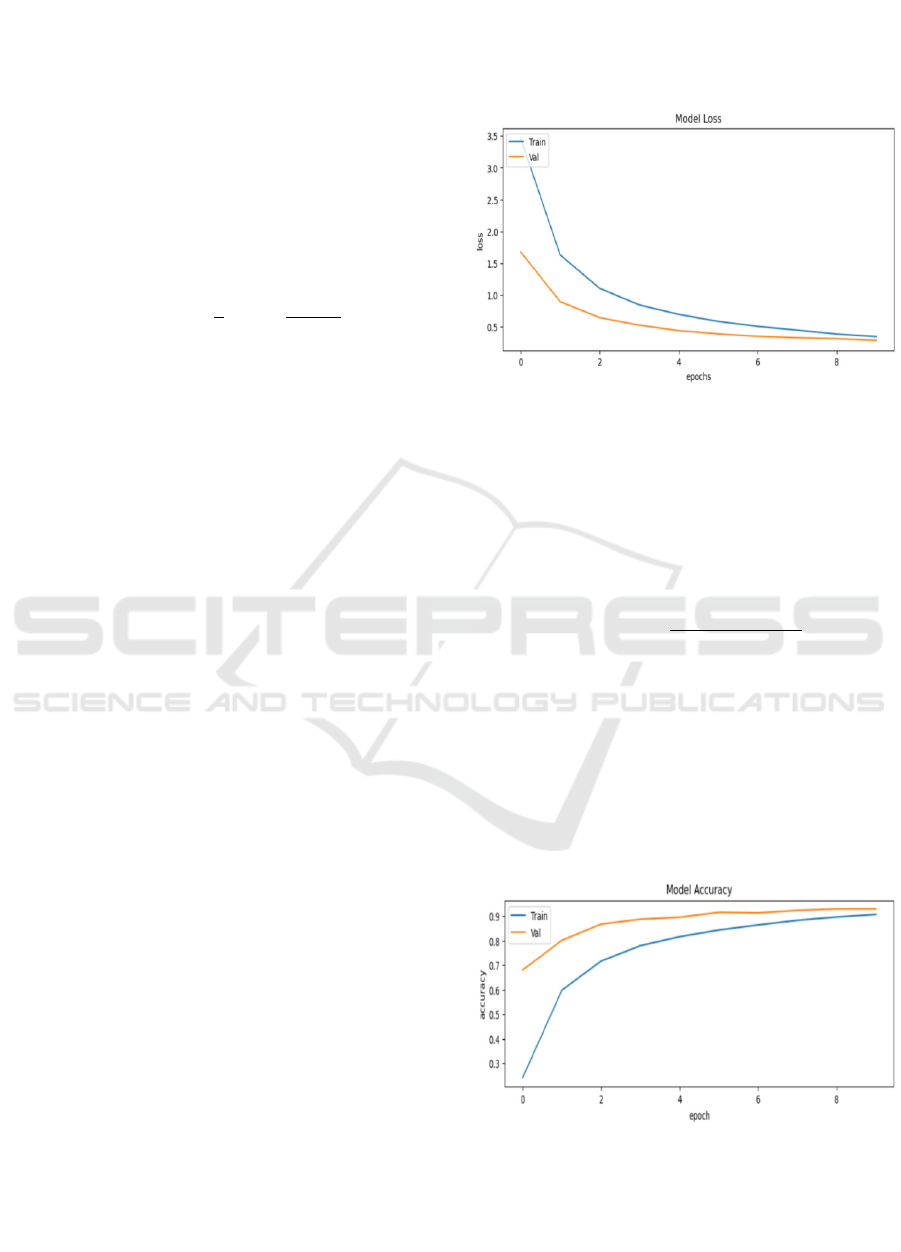
The graphical representation in Fig.3 illustrates
the outcomes of the loss function within this
research. With the prolonged duration of training,
there is a consistent reduction in the model's loss
function for both the training and validation datasets.
This decline signifies an enhancement in the model's
classification performance over time.
Figure 3: Loss function of the model (Picture credit:
Original).
4.3 Accuracy
The precision of a neural network pertains to the
ratio of accurately predicted samples to the total
number of samples in the testing dataset. This is
mathematically expressed as:
Accuracy=
TP+TN
TP+TN+FP+FN
2
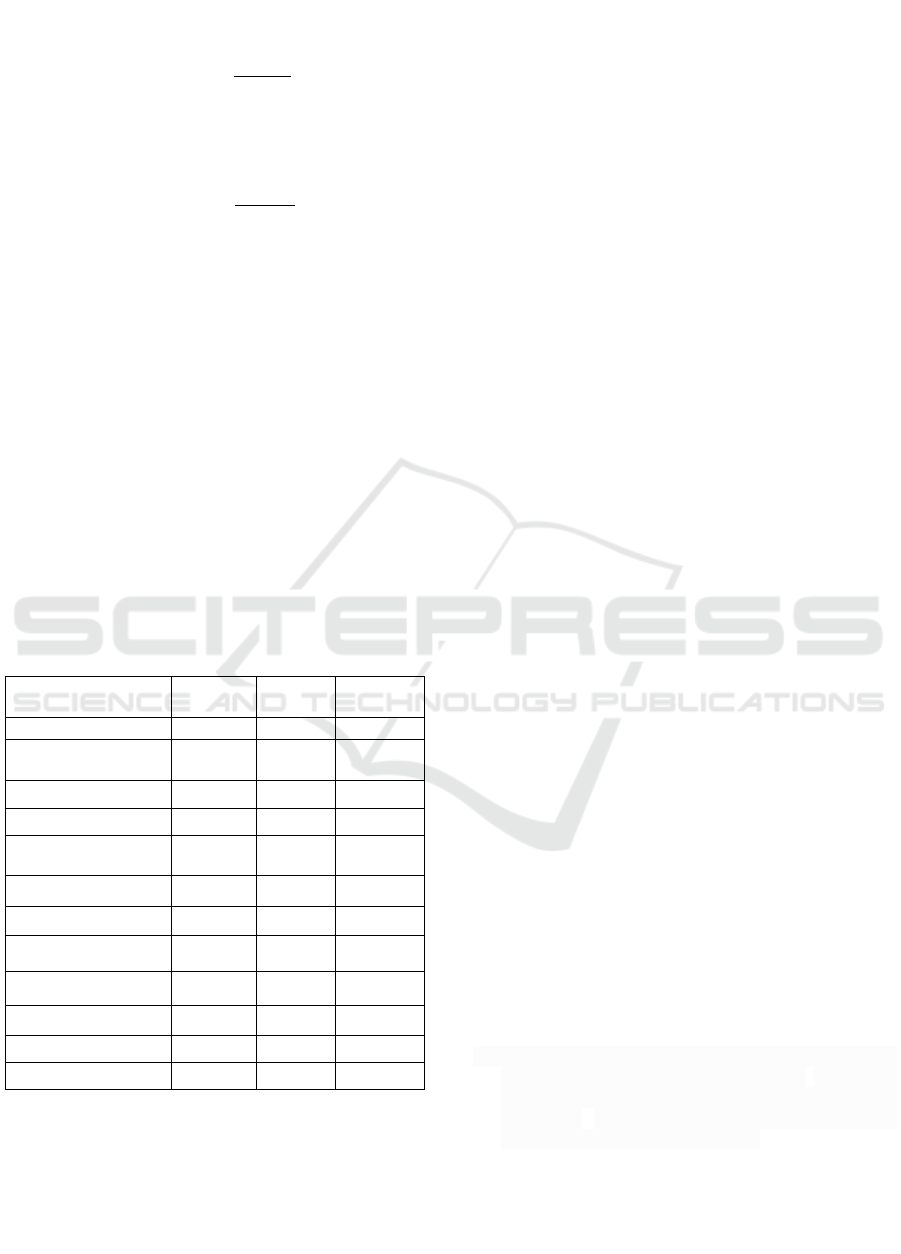
The accuracy of this article is shown in Fig.4. As
the training cycle increases, the model's performance
steadily enhances on both the training and validation
datasets, signifying a continuous improvement in the
network's efficacy. The accuracy of neural networks
represents the degree of prediction accuracy in the
results of the positive sample. Ultimately, the
network model's accuracy on the test set culminated
at 94.3%.
Figure 4: Accuracy of the model(Picture credit: Original).
4.4 Performance Measurement Results
Precision pertains to the likelihood of being a
Butterfly and Moth Image Recognition Based on Residual Neural Network
215
positive sample within the set of all predicted
positive samples and is represented as
Precision=
TP
TP+FP
3
Recall, denoted as the likelihood of being
classified as a positive sample among the true
positive instances, is mathematically articulated as
Recall=
TP
TP+FN
4
F1-score, also known as BalancedScore,
represents the harmonic mean between accuracy and
recall. The F1 score, a statistical metric ranging from
0 to 1, serves as a measure to assess the accuracy of
outcomes produced by a binary model. The F1 score
provides a comprehensive evaluation of the
classification accuracy achieved by neural network
models, considering both the precision of
classification results and the recall rate of dataset
samples. A heightened F1 score indicates enhanced
resilience in the constructed network architecture.
Table 3 presents the classification outcomes of
the model developed in this study for a set of 100
distinct butterfly and moth species. Specifically, the
table showcases the model's classification results for
the top 10 butterfly and moth categories, listed
alphabetically.
Table 3: Classification Results on the Test Set.
Category Precision Recall F1-score
ADONIS 0.65 1.00 0.79
AFRICAN GIANT SW
ALLOWTAIL
1.00 1.00 1.00
AN 88 1.00 1.00 0.90
APPOLLO 1.00 1.00 1.00
ARCIGERA FLOWER
MOTH
0.80 1.00 0.91
ATALA 1.00 1.00 1.00
ATLAS MOTH 1.00 1.00 1.00
BANDED ORANGE
HELICONIAN
1.00 1.00 1.00
BANDED PEACOCK 1.00 1.00 1.00
Accuracy / / 0.94
Macro average 0.95 0.94 0.94
Weighted average 0.95 0.90 0.90
In table 3, CNN's classification performance in t
he ADONIS, AMERICAN SNOOT, AN 88, AR
CIGERA FLOWER MOTH categories is not acc
urate enough, and there are no errors in the clas
sification results of the other butterfly or moth c
ategories.
5
CONCLUSIONS
This article presents a novel approach to image
recognition and classification based on ResNet
network structure. This method is used to distinguish
100 species of butterflies or moths in the dataset.
After 10 training epochs, the CNN architecture
demonstrated an impressive 94.3% classification
accuracy on the test set, underscoring its proficiency
in accurately classifying butterfly or moth datasets.
Because of the limited training epochs executed on
the CPU, the model's performance in terms of
classification accuracy on the test set fell short of
optimal outcomes. Therefore, augmenting the
epochs can be contemplated as a means to enhance
the model's classification accuracy on the given
dataset. Before inputting data, denoising the image
data using corresponding preprocessing algorithms
can help convolutional layers extract image features
more effectively.
REFERENCES
R. Chauhan, K. K. Ghanshala, and R. C. Joshi,
"Convolutional neural Network (CNN) for image
detection and recognition," 2018 First International
Conference on Secure Cyber Computing and
Communication (ICSCCC), 2018, pp. 278-282.
K. He, X. Zhang, S. Ren, and J. Sun, "Deep residual
learning for image recognition," Proceedings of the
IEEE Conference on Computer Vision and Pattern
Recognition (CVPR), 2016, pp. 770-778.
B.B. Traore, B. Kamsu-Foguem, and F. Tangara, "Deep
convolution neural network for image recognition,"
Ecological Informatics, vol. 48, pp. 257-268, 2018.
H. Yoo, S. Han, and K. Chung, "Diagnosis support model
of cardiomegaly based on CNN using ResNet and
explainable feature map," in IEEE Access, vol. 9, pp.
55802-55813, 2021, doi: 10.1109/ACCESS.
2021.3068597.
Zhao, X. Li, X. Lu, and Z. Wang, "A CNN–RNN
architecture for multi-label weather recognition,"
Neurocomputing, vol. 322, pp. 47-57, 2018.
J. Gu et al., "Recent advances in convolutional neural
networks," Pattern Recognition, vol. 77, pp. 354-377,
2018.
N. Srivastava, G. Hinton, A. Krizhevsky, I. Sutskever, I.
Salakhutdinov, and R. Salakhutdinov, "Dropout: a
simple way to prevent neural networks from
overfitting," The journal of machine learning research,
vol. 15, no. 1, pp. 1929-1958, 2014.
Z. Zhang, "Improved adam optimizer for deep neural
networks," 2018 IEEE/ACM 26th international
symposium on quality of service (IWQoS), 2018, pp.
1-2.
DAML 2023 - International Conference on Data Analysis and Machine Learning
216

S. Mehta, C. Paunwala, and B. Vaidya, "CNN based traffic
sign classification using adam optimizer," in 2019
international conference on intelligent computing and
control systems (ICCS), 2019, pp. 1293-1298.
F. Zou, L. Shen, Z. Jie, and W. Liu, "A sufficient condition
for convergences of adam and rmsprop," Proceedings
of the IEEE/CVF Conference on computer vision and
pattern recognition(CVPR), 2019, pp. 11127-11135.
Butterfly and Moth Image Recognition Based on Residual Neural Network
217
