
Heart Disease Prediction Based on the Random Forest Algorithm
Jiaxuan Huang
Changkong College, Nanjing University of Aeronautics and Astronautics, Nanjing, China
Keywords: Heart Disease, Prediction, Dimensionality Reduction, Grid Search, Random Forest.
Abstract: Annually, many lives are claimed by heart disease worldwide, which is influenced by many complicated
factors. In order to detect the disease as early as possible instead of missing the optimal treatment period,
high-accuracy prediction of heart disease is crucial. This paper aims to explore the viability of applying a
specific machine learning algorithm called random forest to heart disease prediction. In this research work, a
prediction system including data preprocessing, dimensionality reduction, model building based on the
random forest algorithm, and parameter tuning using grid search is developed. Evaluation experiments are
conducted using percentage split and cross validation to test the method, with a dataset obtained from Kaggle
involved. It is concluded that the method based on the random forest algorithm has good application prospects
in the task of predicting heart disease since the values of the metrics selected in the study are all above 0.9 in
the experiments.
1 INTRODUCTION
Heart disease is a serious threat to human health. Many
research works related to mortality statistics show that
one of the most prevalent causes of death is cardiac
disease. For example, it is recorded that from 2015 to
2020, cardiac disease remained the leading cause of
death in America (Ahmad and Anderson 2021).
Factors related to heart disease are complex and
diverse. In addition to factors such as exercise
frequency and blood pressure, heart disease may also
be associated with some other diseases. For instance,
diabetes has been found to increase the risk of heart
disease (Ho et al 2022). Some heart diseases do not
cause obvious symptoms, which can lead to patients
missing timely treatment. Therefore, a more reliable
mechanism for the prediction of heart disease, which
helps people take treatment measures as soon as
possible, is of great significance.
Machine learning is a typical technique in the field
of artificial intelligence. With the development of
information technology, for various issues, there is
often a massive amount of data information stored for
a long time. Actually, there are many hidden patterns
in these existing data which are quite significant since
they can be used for prediction based on new data.
When fed with data and algorithms, a machine can be
taught to discover these potential patterns
autonomously and utilize them for certain tasks.
Currently, machine learning technology has been
widely applied in the medical field.
In this research work, a machine learning
algorithm called random forest is used to build a heart
disease prediction system. Some skills such as
Principal Component Analysis (PCA) and the grid
search method are also involved. A heart disease
dataset from Kaggle is utilized in this work for
training and testing. Experiments are conducted using
percentage split and cross validation to confirm this
approach's efficacy. The goal is to make accurate heart
disease predictions based on new data.
2 RELATED WORK
Djerioui et al. did a research work in which
Neighborhood Component Analysis (NCA) was
applied for feature selection and the Support
Vector Machine (SVM) model was built for heart
disease prediction (Djerioui et al 2019).
Experiments were conducted and the accuracy was
compared with the accuracy of some other
methods under the same conditions. It was seen
that the idea could make predictions more accurately.
Islam et al. conducted a study aiming to predict heart
disease as early as possible (Islam et al 2020). PCA
was used for dimensionality reduction and the k-
means algorithm was combined with Genetic
Huang, J.
Heart Disease Prediction Based on the Random Forest Algorithm.
DOI: 10.5220/0012798700003885
Paper published under CC license (CC BY-NC-ND 4.0)
In Proceedings of the 1st International Conference on Data Analysis and Machine Learning (DAML 2023), pages 503-508
ISBN: 978-989-758-705-4
Proceedings Copyright © 2024 by SCITEPRESS – Science and Technology Publications, Lda.
503
Algorithms for the task of clustering. The confusion
matrix was generated and the results of many metrics
were calculated in the experiments, which proved the
effectiveness of the idea. Repaka et al. designed a
prediction system for heart disease using the Naive
Bayesian algorithm (Repaka et al 2019). After
multiple evaluation experiments, the proposed
technique was finally proved to be better than several
other existing classification methods. Ahmed et al.
designed a hybrid model that involved both the SVM
algorithm and the K-Nearest Neighbor (KNN)
algorithm (Ahmed et al 2023). It was displayed in the
experimental results that this hybrid model based on
two algorithms performed better than the models
based on one of the two algorithms individually. Ali
et al. designed a hybrid model called χ2-DNN for
heart disease prediction (Ali et al 2019). χ2 statistical
model was applied to avoid overfitting caused by
irrelevant features, and the best configuration of Deep
Neural Network (DNN) was obtained with the
exhaustive search method. Sah et al. suggested an
ensemble method to detect heart disease (Patro et al
2022). The optimal feature subset was selected and
prediction was done with Meta classifier algorithms.
The outperformance of the proposed method was
confirmed through the evaluation based on various
metrics. Ulloa-Cerna et al. did a research work where
several Convolutional Neural Networks (CNN) were
applied and their outputs were concatenated into a
feature vector, which passed through a classification
pipeline to generate the final prediction result for heart
disease (Ulloa-Cerna et al 2022). Almazroi et al. used
a Keras-based method to diagnose heart disease
(Almazroi et al 2023). Different architectures of the
dense neural network were tried in their work and
many heart disease datasets were involved. Finally,
the method was proven to be effective.
3 METHODOLOGY
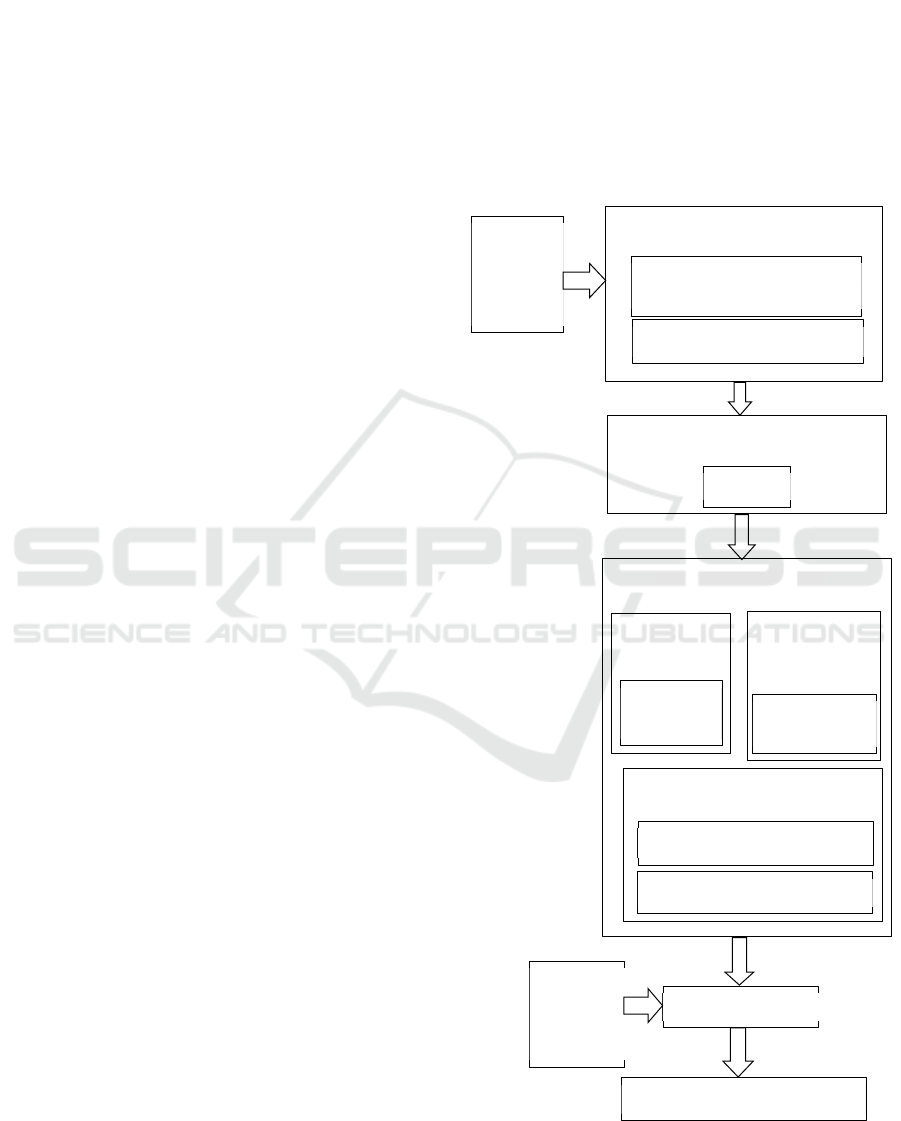
The research work is summarized in Fig. 1. The
original heart disease dataset needs to be preprocessed,
which means that some categorical variables are
transferred into dummy variables and then the
attribute data are standardized. After data
preprocessing, dimensionality reduction is applied to
the data using Principal Component Analysis (PCA).
Actually, the PCA model is packaged together with
the classification model (Random Forest) using
make_pipeline. As for the Random Forest model,
which is the core algorithm of this work, there are
some important hyper-parameters that can have some
impact on the prediction effect. Therefore, parameter
tuning is implemented here using the grid search
method (GridSearchCV) to find the optimal
combination of these hyper-parameters. The input
data were utilized to train the model which finally
serves as a useful classifier for heart disease prediction.
Another fundamental part of the methodology is the
performance evaluation. Percentage split and cross
validation are used for the evaluation of the algorithm,
which are demonstrated in detail in IV B and IV C.
Key components in the methodology are
demonstrated in detail in the following sections.
Figure 1: Methodology of the research work.
Data Preprocessing
Obtain Dummy
Variables
Standardization
Dimensionality Reduction
PCA
Model Training
Algorith
m
Random
Forest
Performance Evaluation
Percentage Split
Trained Model
New
Patient
Data
Cross Validation
Heart
Diseas
e
Dataset
Grid
Search
Heart Disease Prediction
Parameter
Tunin
g
DAML 2023 - International Conference on Data Analysis and Machine Learning
504

3.1 Data Preprocessing
Two key parts of data preprocessing are obtaining
dummy variables and standardization.
Dummy variables are a method of converting
categorical variables into binary variables, typically
having values of 0 or 1. In data modeling, unlike
continuous variables, unordered categorical variables
require the transformation to dummy variables, since
their original values (category values) cannot be
directly retained as input to the model due to the
different effects of switching between different
categories on the dependent variable. A variable with
n class attributes can be converted into n-1 dummy
variables. Particularly, each dummy variable
represents a category. 0 means the original value is not
this category value while 1 means the opposite. If the
original categorical value is the one not included in
these n-1 categories, all n-1 dummy values are 0.
Standardization of data refers to scaling the data
proportionally to fit within a small specific range. The
method is often utilized to deal with the problem of
the difference of measurement units of the original
data.
3.2 Dimensionality Reduction Using PCA
Dimensionality reduction is usually used to accelerate
algorithm execution speed and reduce noise
interference. PCA is a technique that reduces the
dimensions by transferring multiple indicators into a
few comprehensive indicators through orthogonal
transformation. The goal of PCA is to maximize the
dispersion of the projected data (represented by
variance in mathematics). The method is performed as
follows:
Step 1: As for the given sample matrix, calculate
its correlation coefficient matrix as C.
Step 2: Determine C’s the eigenvectors and
eigenvalues.
Step 3: Select the eigenvectors corresponding to
the largest eigenvalues and project the data into the
new space they form.
3.3 Classification Using Random Forest
Random Forest utilizes multiple decision trees for
classification. Each individual decision tree can be
seen as an independent classifier, and the results of
categories output by the model are the mode of the
categories output by these individual decision trees.
Assuming there are k trees in the random forest and M
attributes and the training set’s size is n. The algorithm
is as follows:
Step 1: Sample n times from the training set with
replacement to form a new sub-training set D.
Step 2: Build a decision tree model using D.
Step 3: Repeat steps 1 and 2 k times for the
construction of a random forest made up of k
decision trees.
As for the step of building a single decision tree
(step 2), the detailed procedure is described as
follows:
Step 1: Generate a root node.
Step 2: Randomly select m features, where m<M.
Step 3: Split the node based on the m features
selected in step 2 and a certain optimal splitting
criterion.
Step 4: For each newly generated node, repeat
steps 2 and 3 until all the leaf nodes are produced or
the depth of the tree reaches the maximum depth.
3.4 Parameter Tuning Using
GridSearchCV
Grid Search is a typical parameter tuning method,
which selects the parameter combination with the
highest model accuracy from the given hyper-
parameter range through loop traversal. In this work,
GridSearchCV is imported to adjust the hyper-
parameters of the Random Forest algorithm including
n_estimators, max_depth, criterion, and so on.
3.5 Performance Metrics
Metrics involved in the evaluation experiments
implemented in this research work are described as
follows.
The ratio of accurately predicted samples to all
predicted samples is known as accuracy. The
equation of accuracy is given in (1).
Accuracy=
(
TP+TN)/(TP+TN+FP+FN) (1)
Precision reflects how many percentages of the
samples predicted to be ‘positive’ are indeed
‘positive’. The equation of precision is given in (2).
Precision =
TP/(TP+FP) (2)
Recall reflects how many percentages of the
‘positive’ samples are actually predicted as ‘positive’.
The equation of precision is given in (3).
Recall =
TP/(TP+FN) (3)
The harmonic average of the precision and recall is
known as the F1 score. The equation of the F1 score is
given in (4).
F1=2∗Precision∗Recall/(Precision+Recall) (4)
3.6 Experimental Results
Several experiments are conducted using percentage
split and cross validation. In the following sessions,
Heart Disease Prediction Based on the Random Forest Algorithm
505

the dataset used in the experiments and the process
and the results of experimental evaluation based on the
two methods mentioned above are expounded in detail.
3.7 Dataset Introduction
In this work, a dataset obtained from Kaggle is utilized.
There are 13 attributes involved in the dataset. To be
specific, numeric attributes include age, trestbps,
thalach, and so on. Age represents how old a person is,
ranging from 29 to 77. Trestbps is the resting blood
pressure and it ranges from 94 to 200. Thalach is the
maximum heart rate which lies between 71 and 202.
Chol is the serum cholesterol ranging from 126 to 564.
Ca represents how many major vessels are colored by
flourosopy and its value can be 0 or 1 or 2 or 3 or 4.
Oldpeak is the ST depression induced by exercise
relative to rest, lying between 0 and 6.2. Two boolean
variables are fbs and exang. Fbs shows whether or not
fasting blood sugar level is higher than 120 mg/dl and
exang shows whether the person has angina related to
exercise. The remaining five attributes are nominal.
Sex refers to whether a person is male (represented by
1) or female (represented by 0). Cp is the type of chest
pain, with 0, 1, 2, and 3 representing four different
types respectively. Restecg is the resting
electrocardiogram, with 0, 1, and 2 representing three
different states. Thal is the heart’s defect type, with 1,
2, and 3 representing three different types. Slope refers
to the peak exercise ST
segment’s slope, 0, 1, and 2
meaning ‘up’, ‘flat’, and ‘down’ respectively. The
target class of the dataset represents whether or not a
person is suffering from a heart disease. There are
totally 1025 instances and no values are missing.
3.8 Experimental Evaluation Based on
Percentage Split
Percentage split means dividing the dataset into two
parts according to a certain percentage, one for training
and the other for testing. This method tends to be
represented in the form of a%-(100-a)%. For instance,
70%-30% means that in the training set, there are 70%
of the data, while the other 30% are utilized for testing.
According to this idea, several experiments are
conducted based on different partition percentages. For
each given split percentage, the dataset is split
randomly under the premise of meeting the
corresponding percentage requirement. TABLE I
shows the results.
Table 1: Experimental Results Based on Percentage Split.
Split
Percentage
Metrics
Accuracy Precision Recall
F1
score
50%-50% 0.932 0.950 0.919 0.934
60%-40% 0.971 0.986 0.958 0.972
70%-30% 0.990 0.982 1.000 0.991
80%-20% 1.000 1.000 1.000 1.000
The evaluation results vary with the change in
split percentage. In terms of accuracy, the value
increases as the percentage of the training set
increases, and it reaches 1 when the data used for
training reaches 80% of all data. In terms of
precision, the value shows some fluctuations, rather
than an absolutely monotonous trend, as the split
percentage changes, and the optimal value of the
split percentage is also 80%-20%. In terms of recall,
the more the training set accounts for, the higher the
value of the metric is, and the value can reach 1
when 70% of the data are utilized for training. In
terms of F1 score, the value of the metric is also
positively correlated with the percentage of the
training set, and the score increases to 1 when the
training set increases to 80% of the dataset. As for
the overall pattern, when the entire dataset is fixed,
more samples in the training set can contribute to
better performance of the algorithm, which is in line
with common sense since more training data can
help the model learn more sufficiently. According to
the table, when the training set accounts for greater
than 60%, the values of the metrics are all above
0.95, which is a quite satisfactory outcome. From
these results, it is concluded that the method applied
in this work can perform well in the task of
predicting heart disease if the model is fully trained.
3.9 Experimental Evaluation Based on
Cross Validation
Cross validation means that after dividing the dataset
into multiple parts, each part is alternately utilized for
testing while the remaining parts are utilized for
training and finally the average performance is
obtained after multiple training and testing. This
method is commonly referred to as k-fold cross
validation. To be specific, k rounds of training and
testing are conducted after the dataset is split into k
parts. Each time, one part is used for testing and the
other k-1 parts form a training set. By calculating
the average value of the results of these k
experiments(each part is selected as the testing set
exactly once), the evaluation result is obtained. The
DAML 2023 - International Conference on Data Analysis and Machine Learning
506

experiments are done based on different values of k
and TABLE II shows the results.
Table 2: Experimental Results Based on Cross Validation.
Folds
Metrics
Accuracy Precision Recall F1 score
3 0.983 0.974 0.989 0.981
5 0.994 0.994 1.000 0.994
7 0.997 0.989 0..991 0.995
10 0.997 0.994 1.000 0.997
The results vary with the change in the number
of folds(k). In terms of accuracy, its value shows an
increasing trend as the number of folds increases,
and the value remains relatively stable after the
number of folds reaches 7. In terms of precision,
when there are more and more folds, the value of the
metric fluctuates, and it reaches the maximum value
when there are 5 folds or 10 folds. In terms of recall,
the case is similar, which means that no obvious
monotonous trend is found and the best scenario is
when the number of folds is 5 or 10. In terms of F1
score, more folds can contribute to a higher score,
and the highest F1 score in the experiments is 0.997,
when there are 10 folds. As is seen in the definition
of cross validation, more folds mean a higher
proportion of training set, which makes the model
learn more sufficiently, often leading to better
performance. Sometimes there is a decline in some
metrics when the number of folds increases, which
is possibly due to overfitting. Overall, the values of
metrics calculated in the experiments are greater
than 0.97, which shows excellent performance.
These results show that the method for predicting
heart disease in this paper is really effective.
4 CONCLUSION
In this work, a prediction system centered on the
random forest algorithm is implemented to realize
high-accuracy prediction of heart disease. A heart
disease dataset including physical indicators of 1025
people and whether they are suffering from heart
disease is selected from Kaggle to complete the
research. The original data are preprocessed and
dimensionality reduction is done with PCA. The
core prediction model is trained based on random
forest and the parameters are adjusted with the grid
search method. In the evaluation experiment,
percentage split and cross validation are applied to
test the model. According to the results, the
prediction method is proven to be quite effective,
with all the metrics greater than 0.9 in all the
experiments. It is concluded that random forest is a
very promising technology with great potential for
application in heart disease prediction.
In the future, it is very promising to further
develop this research work into an intelligent
diagnostic system. By connecting with conventional
medical examination equipment, new real-time data
can be imported into the system, which can
automatically make predictions. What is more,
although the method using random forest performs
well on the dataset selected, there is still room for
improvement. The prediction effect may be further
improved if some other supervised learning
algorithms are added through ensemble learning.
REFERENCES
F. B. Ahmad, R. N. Anderson, “The leading causes of death
in the US for 2020,” Jama, vol. 325, no. 18, pp. 1829-
1830, 2021.
K. L. Ho, Q. G. Karwi, D. Connolly, et al, “Metabolic,
structural and biochemical changes in diabetes and the
development of heart failure,” Diabetologia, vol. 65,
no. 3, pp. 411-423, 2022.
M. Djerioui, Y. Brik, M. Ladjal, et al, “Neighborhood
component analysis and support vector machines for
heart disease prediction,” Ingénierie des Systèmes d
Inf., vol. 24, no. 6, pp. 591-595, 2019.
M. T. Islam, S. R. Rafa, M. G. Kibria, “Early prediction of
heart disease using PCA and hybrid genetic algorithm
with k-means,” in 2020 23rd International Conference
on Computer and Information Technology (ICCIT).
IEEE, 2020, pp. 1-6.
A. N. Repaka, S. D. Ravikanti, R. G. Franklin, “Design and
implementing heart disease prediction using naives
Bayesian,” in 2019 3rd International conference on
trends in electronics and informatics (ICOEI). IEEE,
2019, pp. 292-297.
R. Ahmed, M. Bibi, S. Syed, “Improving Heart Disease
Prediction Accuracy Using a Hybrid Machine
Learning Approach: A Comparative study of SVM
and KNN Algorithms,” International Journal of
Computations, Information and Manufacturing
(IJCIM), vol. 3, no. 1, pp. 49-54, 2023.
L. Ali, A. Rahman, A. Khan, et al, “An automated diagnostic
system for heart disease prediction based on χ2
statistical model and optimally configured deep neural
network,” Ieee Access, vol. 7, pp. 34938-34945, 2019.
S. P. Patro, N. Padhy, R. D. Sah, “An Ensemble Approach
for Prediction of Cardiovascular Disease Using Meta
Classifier Boosting Algorithms,” International Journal
of Data Warehousing and Mining (IJDWM), vol. 18,
no. 1, pp. 1-29, 2022.
A. E. Ulloa-Cerna, L. Jing, J. M. Pfeifer, et al,
“RECHOmmend: an ECG-based machine learning
Heart Disease Prediction Based on the Random Forest Algorithm
507

approach for identifying patients at increased risk of
undiagnosed structural heart disease detectable by
echocardiography,” Circulation, vol. 146, no. 1, pp. 36-
47, 2022.
A. A. Almazroi, E. A. Aldhahri, S. Bashir and S. Ashfaq, “A
Clinical Decision Support System for Heart Disease
Prediction Using Deep Learning,” IEEE Access, vol.
11, pp. 61646-61659, 2023.
DAML 2023 - International Conference on Data Analysis and Machine Learning
508
