
Mortality Prediction of Diabetes and Parameter Analysis Based on
Joint EDA and SVM
Jye-Lin Chien
Computer Science and Engineering, National Taiwan Ocean University, Taipei, Taiwan, China
Keywords: Diabetes, Exploratory Data Analysis, Support Vector Machine, Cross-validation.
Abstract: In an era marked by a steadily increasing number of diabetes patients, diabetes has become a global concern.
The World Health Organization (WHO) reported that between 2000 and 2019, the number of deaths linked
to diabetes rose by 3%. As a result, the goal of this study is to look at the death rate among diabetics and give
patients analytical insights to help them take quick preventive action against fatalities. First, Exploratory Data
Analysis (EDA) techniques are utilized to visualize data and understand its features, structure, and
relationships. Second, the Support Vector Machine (SVM) model is employed for classification tasks, aiming
to find an effective hyperplane that separates these samples. Last, the obtained accuracy and highest cross-
validation score can be used to analyze the performance of diabetes mortality rate analysis among different
SVM models. After analysis and evaluation, the SVM linear kernel model has been identified as an effective
classifier. Among the three SVM models with different kernels, the polynomial kernel exhibits the highest
accuracy, while the linear kernel demonstrates the highest cross-validation score. Experimental findings
underscore the substantial impact of the “diabetes pedigree function” on patient mortality rates.
1 INTRODUCTION
The World Health Organization (WHO) statistics
show that from 108 million in 1980 to 422 million in
2014, the number of people with diabetes mellitus
(DM) increased steadily. DM resulted in 1.5 million
fatalities directly and 460,000 kidney-related deaths
indirectly in 2019. Between 2000 and 2019, the
number of deaths attributed to diabetes increased by
3%. In middle-income and low-income countries, the
diabetes mortality rate even rose to 13%. Diabetes is
prone to causing elderly individuals to lose their
ability for independent living. In addition, Type 2
diabetes (T2DM) is the most common. Moreover,
over the past few years, the number of individuals with
this type of DM has sharply increased worldwide.
In recent years, researchers have applied various
machine-learning algorithms to construct models
related to diabetes . For example: The Auto-
Regressive Integrated Moving Average model
(ARIMA) was fused with the Support Vector Machine
(SVM), and the fusion approach was contrasted with
the ARIMA, SVM, and Artificial Neural Network
(ANN) models by Yu L L et al. (Yu et al 2021). For
the purpose of early diabetes identification, Zeki A. M.
and colleagues separately utilized the machine
learning techniques Random Forest (RF), Naive
Bayes (NB), and Logistic Regression (LR) (Zeki et al
2021). The trial findings showed that RF had the
highest accuracy compared to the other two
approaches. Currently, SVM stands out as an excellent
classification model with notable generalization
capabilities and has been applied across various fields
(Shao et al 2012 & Simarmata and Kam 2010). For
instance, Shao L S et al. employed SVM learning
principles to study the prediction of housing damage
caused by open-pit mining explosions (Shao et al
2012). SVM has also found numerous applications in
the medical field, such as Wee J L et al., who
employed an SVM model to predict linear B-cell
epitopes with lengths that vary between 12 to 20
amino acids (Simarmata and Kam 2010).
The main objective of this project is to develop an
efficient analytical model for diabetes prediction using
machine learning. Firstly, in the preprocessing stage,
exploratory data analysis (EDA) is introduced to
understand the data's features, structure, and
relationships. Gaining insights into the data's
properties and structure by the characteristics of data
visualization. Secondly, SVM is introduced to build
the analytical model, utilizing the SVM model to find
a hyperplane that effectively separates these samples
Chien, J.
Mortality Prediction of Diabetes and Parameter Analysis Based on Joint EDA and SVM.
DOI: 10.5220/0012799900003885
Paper published under CC license (CC BY-NC-ND 4.0)
In Proceedings of the 1st International Conference on Data Analysis and Machine Learning (DAML 2023), pages 481-485
ISBN: 978-989-758-705-4
Proceedings Copyright © 2024 by SCITEPRESS – Science and Technology Publications, Lda.
481
for the classification task. Thirdly, the obtained
accuracy and highest cross-validation score can be
used to compare the performance of diabetes mortality
rate analysis among different SVM models with
various kernel functions. Through analysis and
evaluation, the SVM linear kernel model has been
identified as an effective classifier by discerning
significant factors. Among the three SVM models
under different kernels, the polynomial kernel exhibits
the highest accuracy, while the linear kernel
demonstrates the highest cross-validation score.
Experimental findings underscore the substantial
impact of the diabetes pedigree function on patient
mortality rates. Predicting the likelihood of mortality
in diabetes patients can assist them in taking
preventive measures to reduce the possibility of death
by managing their health.
2 METHODOLOGY
2.1 Dataset Description and
Preprocessing
The Diabetes Factors dataset from Kaggle contains
768 data points with 9 variables (ARVIDSSON 2023).
The dataset consists of two components. The first type
is information about the patient and their health status:
Pregnancies (number of pregnancies), Blood Pressure,
Glucose (Impaired fasting glucose, IFG), Skin
Thickness, BMI (body mass index, 𝐵𝑀𝐼
,Insulin, Age and Diabetes Pedigree
Function (The likelihood of diabetes can be calculated
based on the age of the subject and their family history
of diabetes using a Diabetes pedigree function). The
second type is the outcome, which is the patient
survival state: a binary categorical variable with
values of 'alive' and 'dead'. The study separates the
feature variable and target variable from the Data
Frame. For classification purposes, 80% of the dataset
is used as the testing set, while 20% is used as the
training set.
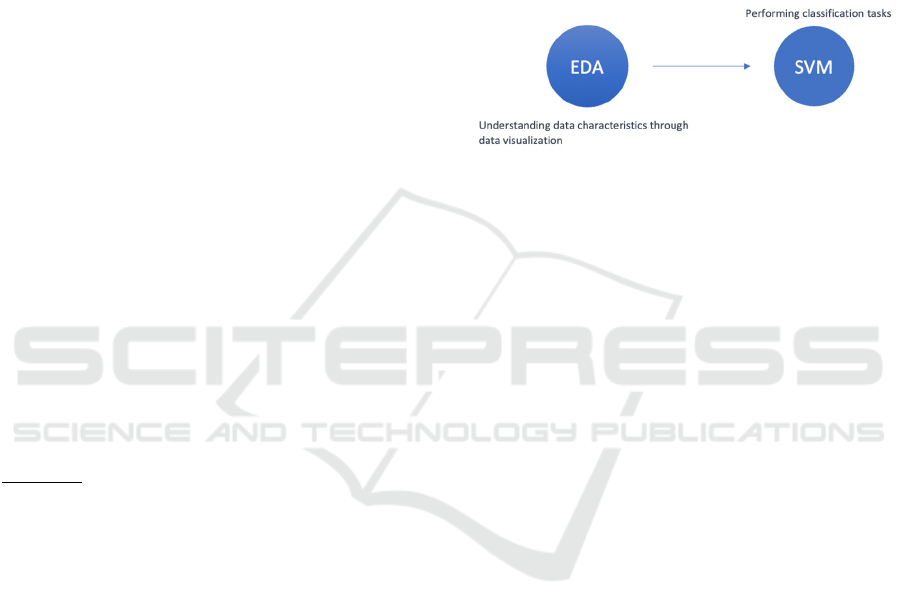
2.2 Proposed Approach
The main goal of this project is to use machine
learning to build an accurate diabetes forecasting
model. Following the process depicted in Fig. 1,
firstly, in the preprocessing phase, EDA is introduced
to comprehend the features, structure, and
relationships within the data. Gaining insights into
data characteristics and structure through data
visualization. Secondly, SVM is employed to build the
analytical model. SVM exhibits strong generalization
capabilities in classification tasks, effectively
handling high-dimensional data and identifying
optimal separating hyperplanes between different
classes, thus achieving high accuracy in classification.
SVM is utilized for predicting the presence of diabetes
by learning relationships between various features to
make classification decisions. Lastly, the obtained
accuracy, cross-validation scores, and the highest
cross-validation score allow us to deduce the
significant factors influencing diabetes.
Figure 1: Flow Chart Process (Picture credit: Original).
2.2.1 EDA
EDA is a data analysis method that utilizes data
visualization techniques, such as bar charts and pie
charts, to understand the characteristics of features.
Its purpose is to gain insights into the data, identify
anomalies, and analyze correlations through
visualizations and statistical tools. Visualization
refers to using bar plots, scatter plots, box plots, etc.,
to understand the distribution of data and the
occurrence of outliers. Statistical tools refer to finding
the maximum and minimum values of the data, mode,
mean, values of various percentiles, and the
frequency of occurrence of different values. To
understand the distribution of age and outcomes
within the dataset, this study employed various data
visualization techniques such as bar charts and pie
charts. EDA enables us to identify which features
might have an impact on diabetes prediction and how
to prepare the data in the required format for training
machine learning models. The general steps of EDA
are as follows: Firstly, an overview of the data is
conducted. Secondly, data missingness and
anomalies are examined. Thirdly, the distribution of
the target variable is observed. Finally, features are
categorized into categorical and numerical features,
followed by a more detailed analysis of these two
types of features.
2.2.2 SVM
SVM is a supervised learning algorithm primarily
used for classification and regression problems. In
order to achieve perfect separation, SVM seeks out a
DAML 2023 - International Conference on Data Analysis and Machine Learning
482
decision boundary and maximizes the margin
between two classes. In this study, non-linear SVM is
employed. The underlying idea is to translate data
points into a higher dimensional space, converting
initially linearly inseparable data into linearly
separable data in the higher dimensional space,
allowing for better categorization. Non-linear SVM
can handle different types of data by utilizing various
kernel functions. The computation performed by
kernel functions is a similarity measure. When the
similarity between two sets of data input into the
kernel function is higher, the output value becomes
larger, and vice versa. SVM exhibits strong
generalization capabilities and excels in dealing with
small-sample data, high-dimensional data, and non-
linear data. There are several different kinds of kernel
functions, including linear kernel, polynomial kernel,
and Radial Basis Function (RBF) kernel. In this
paper, SVM is employed to construct a classification
model for predicting diabetes outcomes.
2.2.3 Accuracy
Accuracy is used to calculate the proportion of correct
predictions in all predictions made by a model and
can be expressed as a percentage. The accuracy of this
study is utilized to calculate the ratio of samples that
have been correctly identified to all samples. The
formula is as follows:
𝐴𝑐𝑐𝑢𝑟𝑎𝑐𝑦
𝑁
𝑇
1
where 𝑁 represent number of correctly classified
samples, and 𝑇 represent total number of samples.
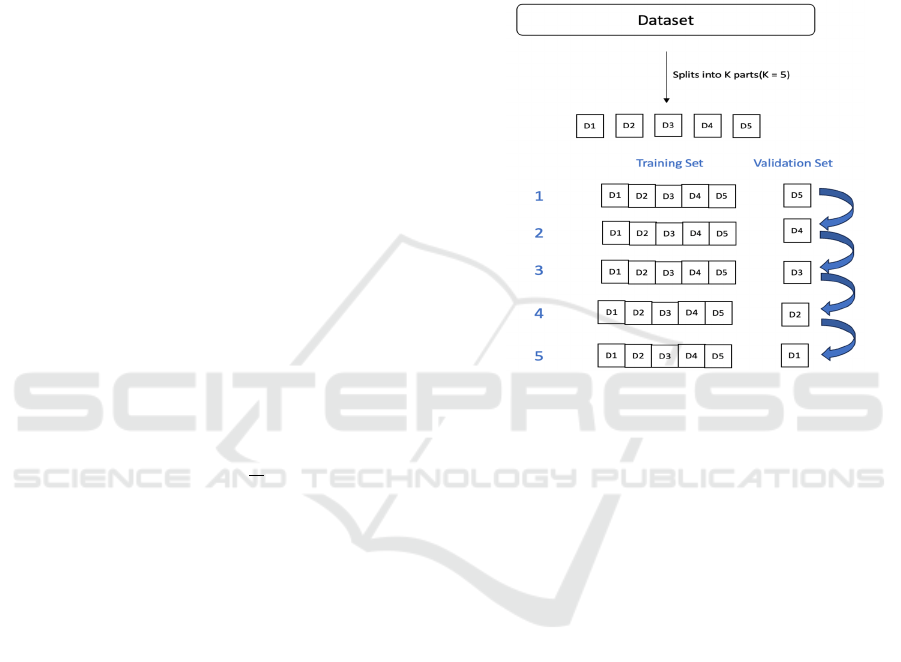
2.2.4 Cross-Validation
Cross-validation involves dividing the sample into
multiple small subsets, with some used for testing and
others for training. This helps to avoid bias introduced
by relying solely on specific training and testing
datasets in statistical analysis. There are various
approaches to Cross-Validation, such as k-fold cross-
validation, Leave-One-Out cross-validation, and
holdout cross-validation. Fig. 2 illustrates the use of
k-fold cross-validation in this study. The data will be
initially split into K subsets for the k-fold cross-
validation procedure, with one subset utilized for
validation and the remaining K-1 subsets being used
for training. A validation error is computed for each
validation subset. The process is then repeated K
times, with the remaining subsets being used for
training and a different subset being used as the
validation set each time. This results in K validation
errors, which are then averaged to obtain a single
evaluation metric for assessing the model's
performance. In this study, the dataset is partitioned
into 5 subsets, and each subset is used for training and
validation, producing 5 accuracy scores. By
identifying the maximum accuracy score among these
5 scores, the concept of "Highest Cross-Validation" is
introduced. This metric aids in evaluating the model's
stability and generalization performance across
various data distributions.
Figure 2: Flowchart of the experiment (Picture credit:
Original).
2.3 Implementation Details
The study utilizes Python 3.10 and the Scikit-learn
library to implement SVM models. Data visualization
is conducted using the Seaborn and Matplotlib
libraries. This study is being carried out on Kaggle
Notebooks. In this study, the SVM model chooses a
linear kernel to perform classification on a linear
hyperplane.
3 RESULTS AND DISCUSSION
After analysis and evaluation, the SVM linear kernel
model is considered effective in achieving
classification by identifying important factors. The
data analysis process involves five steps to optimize
and evaluate the decision tree model. First, the SVM
model with polynomial, RBF, and linear kernels is
trained using all input variables from the training
dataset. Secondly, to compare stability and accuracy,
the Highest Cross-Validation and accuracy are
calculated for each of the three different kernels.
Third, a feature importance assessment is conducted
by calculating the relevance scores of each feature in
Mortality Prediction of Diabetes and Parameter Analysis Based on Joint EDA and SVM
483
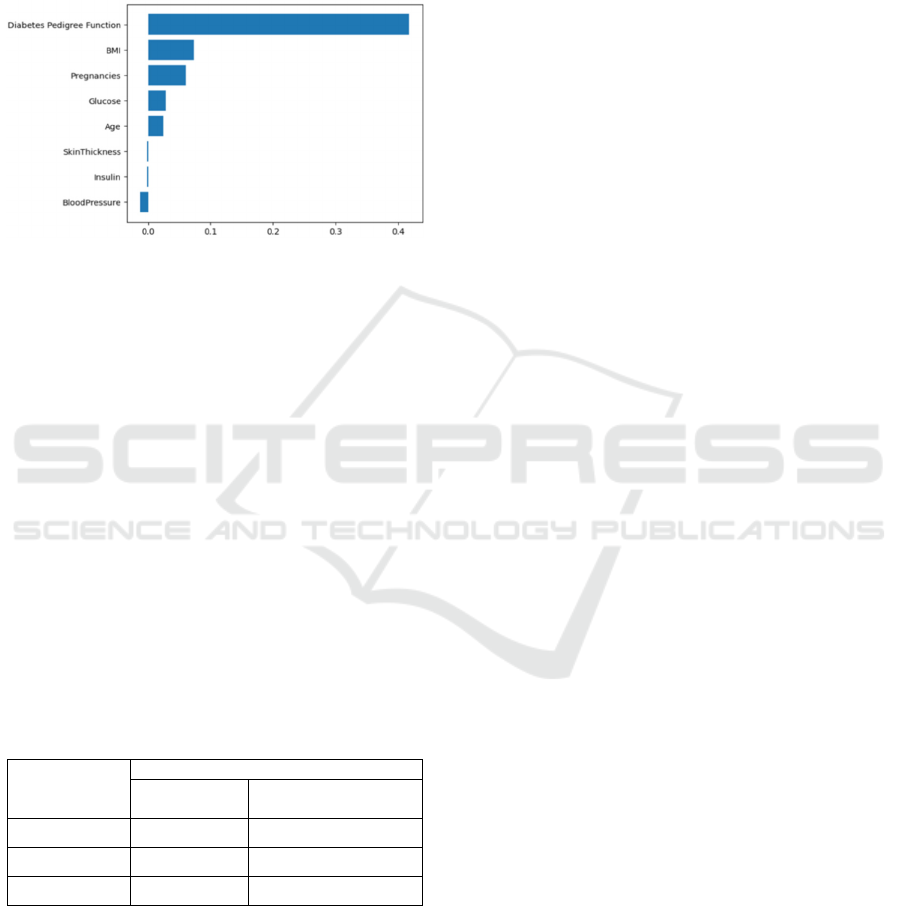
the SVM model with a linear kernel. The importance
of each feature in classification is shown in Fig. 3. One
feature stands out as more significant than others:
"Diabetes Pedigree Function." Lastly, a performance
evaluation is carried out to assess the predictive
ability, stability, and discriminative power of the
trained models.
Figure 3: Feature Importance Plot (Picture credit: Original).
Table 1 presents the comparison results of the
SVM models under the three kernels. The polynomial
kernel achieves the highest accuracy, while the linear
kernel has the Highest Cross-Validation. Based on the
analysis above, it is evident that the "Diabetes
Pedigree Function" feature significantly influences the
accuracy of the SVM model's prediction of the
likelihood of mortality in DM patients. The specific
values of this feature serve as valuable indicators and
help determine whether a DM patient is likely to die.
These findings hold practical significance for the
medical industry. Collecting the family medical
history of DM patients can provide insights into
whether a patient faces a higher risk of mortality
compared to others. By understanding the health status
and basic information of DM patients, doctors can
take early measures to reduce the likelihood of patient
mortality.
Table 1: Classification Report.
Model
Performance
Accuracy
Highest
Cross-Validation
RBF 76.62% 79.08%
Linear 75.32% 81.04%
Polynomial 75.97% 79.08%
4 CONCLUSION
This paper introduces the SVM to construct the
analysis model. First, EDA is employed to determine
which features might impact diabetes prediction and
how to prepare the data in the required format for
training machine learning models. In this study,
multiple data visualization techniques such as bar
charts and pie charts are used to understand the data
needed for the research. Second, SVM is employed to
predict the presence of diabetes. Linear SVM is used
to make classification decisions by learning
relationships between different features. Last,
obtained accuracy, cross-validation scores, and the
highest cross-validation score lead to identifying
significant factors influencing diabetes. The results
indicate that the "Diabetes Pedigree Function" feature
has a significant impact on the mortality rate of
patients with diabetes. Using this model, researchers
have gained a clear understanding of the main
elements contributing to the mortality rate in diabetes
patients. In the future, studying the impact of dietary
habits on the susceptibility of the general population
to diabetes will be considered as the research objective
for the next stage. This type of analysis on disease risk
assessment could provide valuable assistance for the
advancement of the medical industry and the
implementation of preventive measures for patients.
REFERENCES
L. Yu, T. Chen, H. Jin, B. F. Xu, “Blood Glucose
Prediction is based on the Combination of a Support
Vector Machine and Auto-Regressive Integrated
Moving Average Model,” Chinese Journal of Medical
Physics, vol. 33, 2021 pp. 381-384
M. U. Emon, M. S. Keya, M. S. Kaiser, M. A. islam, T.
Tanha, M. S. Zulfiker, “Primary Stage of Diabetes
Prediction using Machine Learning Approaches,” 2021
International Conference on Artificial Intelligence and
Smart Systems (ICAIS), IEEE, 2021, pp. 364-367
A. M. Zeki, R. Taha, S. Alshakrani, “Developing A
Predictive Model for Diabetes Using Data Mining
Techniques,” 2021 International Conference on
Innovation and Intelligence for Informatics,
Computing, and Technologies (3ICT), IEEE, 2021, pp.
24-28
J. H. Li, Q. R. Gu, “Application Research of Neural
Networks and Data Mining Techniques in Medical
Diagnosis,” Journal of Engineering Science and
Educational Studies, vol. 7, 2010, pp. 154-169
X. Tong, C. Yang, Q. Meng, “Construction of a Risk
Assessment Model for Diabetic Nephropathy in
Traditional Chinese Medicine ("Tong Bing Yi Zheng")
Based on Multi-Label Machine Learning,” Chinese
Journal of General Practice, vol. 20, 2022, p. 6
X, Bai, B. Chen, X. Gao, J. Li, “Correlation Between
Diabetes and Body Composition of Based on Decision
Tree and Neural Network,” 2019 Chinese Control and
Decision Conference (CCDC), IEEE, 2019, pp. 4992-
4997
DAML 2023 - International Conference on Data Analysis and Machine Learning
484

W. Tang, M. Gao, Y. Shen, “Type 2 Diabetes Patients' 3-
Month Blood Sugar Prediction Based on Machine
Learning Algorithms,” Chinese Journal of Disease
Control, vol. 23, 2019, p. 5
L. Shao, Y. Bai, Y. Qiu, Z. Du, “LS-SVM 2012 analysis
model and its application for prediction residential
house's damage against blasting vibration from open pit
mining,” Journal of China Coal Society, vol. 37, 2012,
p. 10
L. Wee, D. Simarmata, Y. Kam, “SVM-based prediction of
linear B-cell epitopes using Bayes Feature Extraction,”
BMC genomics, BioMed Central, 2010
JOAKIM ARVIDSSON, “Diabetes Factors” Kaggle, 2023,
https://www.kaggle.com/datasets/joebeachcapital/diab
etes-factors
Mortality Prediction of Diabetes and Parameter Analysis Based on Joint EDA and SVM
485
