
Comparative Analysis of Machine Learning Models in Predictive
Analytics for Residential Energy Consumption
Hongyuan Jia
Computer Science and Engineering Department, University of California, San Diego, La Jolla, U.S.A.
Keywords: Residential Energy Consumption, Machine Learning, Regression Models, Sustainable Living, Predictive
Analytics.
Abstract: Today, household energy consumption patterns are crucial for a sustainable living environment. Many
researchers have made contributions in this field. Some researchers use various machine learning models to
predict household appliance energy consumption, such as long short-term memory (LSTM) deep neural
network, Naive Bayes, and Support Vector Machines. Still other researchers try to reduce electricity usage by
maximizing the use of solar power in homes. This study sets out to provide an in-depth analysis of household
energy usage patterns, focusing specifically on appliance energy consumption over approximately 4.5 months.
Careful analysis was conducted using a dataset merged with meteorological data from an in-home wireless
sensor network and the nearest airport weather station. In this research, we explored an array of regression
techniques: linear, Ridge, KNN, decision tree, and random forest. By testing multiple models, random forest
regression was the more suitable model for this data set because of its better performance. This study seeks
to enrich the growing domain of sustainable living and energy management, emphasizing enhanced energy
efficiency within residential settings.
1 INTRODUCTION
Energy has always been a frequently discussed issue.
With the increasing global awareness of
environmental protection, household energy has
become the focus of research in recent years.
Counterintuitively to many people, household energy
consumption accounts for a very large proportion.
The total household energy consumption in the world
is 7749 million tons of oil equivalent, which is more
than twice the consumption of all other types of
energy (Chen and Chen 2011). Household energy
consumption affects society's energy needs and
environmental protection goals. Moreover, home
energy is also a significant expense for low-income
families. Low-income households in Maryland, USA,
need to spend more than 10% of their annual income
on energy expenses (Irwin et al 2014). To reduce
carbon emissions and financial pressure on low-
income households, in-depth research and analysis of
home energy is necessary.
Analyzing large amounts of data is an efficient way
to solve these problems. By leveraging large amounts
of data for analysis, it is possible to gain a deeper
understanding of patterns and trends in energy use.
And use this to develop improvement plans that are
beneficial to home energy. In this study, the dataset
recorded a range of household energy use and
environmental parameters at 10-minute intervals for
4.5 months. Data sources include multiple sensors in
the home, and the nearest airport weather station. The
focus is on many aspects of household energy use,
particularly the energy consumption of appliances.
This study utilizes a series of regression models,
including linear regression, ridge regression, KNN
regression, as well as decision trees and random
forests, to analyze and predict household energy
consumption. By in-depth comparison of the
performance data of these models, the objective is to
find the best solution for this problem.
2 RELATED WORK
In the field of household energy consumption, a large
number of researchers have made contributions.
Researchers in the Philippines try to reduce energy
consumption in households by predicting the
probability of appliance use. They use Bayes' theorem
to predict the probability of using home appliances by
learning a large number of family members' living
Jia, H.
Comparative Analysis of Machine Learning Models in Predictive Analytics for Residential Energy Consumption.
DOI: 10.5220/0012800500003885
Paper published under CC license (CC BY-NC-ND 4.0)
In Proceedings of the 1st International Conference on Data Analysis and Machine Learning (DAML 2023), pages 251-255
ISBN: 978-989-758-705-4
Proceedings Copyright © 2024 by SCITEPRESS – Science and Technology Publications, Lda.
251

habits, and then develop a suitable plan (Pastorfide et
al 2017). In order to give residents a clearer
understanding of their electricity bills, researchers
used the concepts of the Nearest Neighbor Algorithm
and Markov Chain to try to predict next month's
electricity bills. The training samples for this machine
learning model are past electricity bills and home
appliance usage (Rajasekaran et al 2017). For low-
income families, electricity bills are sometimes an
expense that cannot be ignored, and this forecast
helps them plan their financial expenditures in
advance for the next month. Hybrid approaches
combining Long Short-Term Memory (LSTM) Deep
Neural Networks with other models also exhibit
strong efficacy in forecasting energy usage
(Kouziokas 2019). Auto regressive integrated moving
average (ARIMA) is also used by some researchers to
predict future energy consumption with high
accuracy (Shorfuzzaman and Hossain 2021).
Moreover, certain scholars have adopted alternative
strategies, developing a range of machine learning
techniques to optimize solar energy utilization in
homes equipped with solar power systems.
Maximizing the utilization of solar energy is
minimizing the consumption of electrical energy
(Kilinç et al 2021). As one of the most power-
consuming appliances in the home, air conditioners
are also a suitable entry point to study the energy
consumption of air conditioners (Bantan et al 2017).
Cross entropy algorithm is also a direction of many
researchers, who use it to predict energy consumption
(Dong et al 2020). There are also researchers who
focus on the impact of user behavior and
psychological factors on household energy
consumption. They use SVM models to record and
predict many households to determine their energy
consumption (Wenninger et al 2019).
3 METHODOLOGY
Linear regression is a method in statistics to estimate
the relationship between two variables. In the realm
of machine learning, it is an algorithm for predicting
a continuous target variable. The following formula
is the formula for this model:
𝑦 = 𝛽
+ 𝛽
𝑥
+ 𝛽
𝑥
+ ⋯ + 𝛽
𝑥
+ 𝜖 (1)
where y is the target variable and x1, x2....xn is the
explanatory variable or feature. Linear regression
determines coefficients by reducing the sum of
squared deviations, typically achieved through
techniques like gradient descent. Coefficient beta is
measured by mean squared error (MSE). Linear
regression is used in many fields such as biology and
engineering.
Ridge regression is an extension of linear
regression that introduces an L2 regularization term.
Its role is to stabilize estimation and reduce
overfitting. Its formula is as follows:
𝛽
=arg min
(
|
𝑌−𝑋𝛽
|
2
2
+ 𝜆
|
𝛽
|
2
2
) (2)
Y is the response variable vector, X is the design
matrix, β is the coefficient vector, and λ is the
regularization parameter responsible for controlling
the regularization strength. The L2 regularization
term acts as a constraint to prevent the absolute value
of the coefficient from being too large. Ridge
regression introduces a bias-variance trade-off in
parameter estimation, minimizing the prediction error
through appropriate λ values.
K-Nearest Neighbor (KNN) regression is a
memory-based learning method. Predict a continuous
output variable by evaluating K neighbors. Its
theoretical basis comes from the idea of local
approximation, that is, averaging the output variables
of local instance points to make predictions. This
method does not rely on any explicit parameters, it is
a non-parametric method.
𝑌
(𝑥)=
∑
𝑌
∈
()
(3)
Y(x) is the predicated value, Nk(x) represents the
sample set containing the k nearest neighbors of x, Yi
represents the output value of a sample, and k
represents a predetermined number of neighbors. In
KNN regression, several points should usually be
paid attention to to ensure performance. Number of
nearest neighbors (choice of k), distance measure,
weight assignment, data preprocessing,
computational efficiency.
Decision tree regression is a widely-used
supervised learning technique suitable for both
classification and regression challenges. The basic
principle is to divide the sample space into multiple
subspaces through a series of feature tests. One
advantage of a decision tree is its ability to provide
clear explanations, which makes it more than simple
to see and understand a model's decision paths. The
decision tree's nodes are divided based on the test
results of a specific feature. The optimal split point of
a node is determined through some algorithms, such
as information gain and Gini impurity. Their formulas
are:
𝐸𝑛𝑡𝑟𝑜𝑝𝑦
(
𝑆
)
= −
∑
𝑝
(
𝑥
)
log
𝑝(𝑥) (4)
𝐺𝑖𝑛𝑖 𝐼𝑚𝑝𝑢𝑟𝑖𝑡𝑦
(
𝑆
)
=1−
∑
𝑝
(
𝑥
)
(5)
DAML 2023 - International Conference on Data Analysis and Machine Learning
252
The decision tree construction usually starts with
the root node, contains all samples, and then
recursively splits to the leaf nodes. Leaf nodes usually
represent a single prediction category or predicted
value.
Random forest regression is a collective learning
approach that merges the forecasts of several decision
trees to enhance the model's accuracy and
consistency. Especially in regression problems,
random forest regression can provide accurate
prediction results. Random forest obtains the final
prediction by averaging the predictions of these trees.
Here is the formula:
𝑌
=
∑
𝑇
(𝑋)
(6)
Y is the prediction result of the random forest, n is
the number of trees, Ti(X): the forecasted outcome
from the i-th tree, where X represents the input
feature vector.
4 EXPERIMENTAL RESULT
This study employs a multivariate time series dataset
to create a regression model of appliance energy
consumption in buildings. The dataset contains 19735
instances and 29 real-type attributes. The data was
recorded over a period of about 4.5 months and was
recorded every 10 minutes. Each wireless device
sends temperature, humidity readings approximately
every 3.3 minutes, and this information is then
consolidated into 10-minute intervals. Energy usage
is logged every 10 minutes using the m-bus energy
meter. Additionally, the dataset includes
meteorological data sourced from the Chivres Airport
weather station in Belgium. The data set records in
detail information such as timestamps, energy
consumption of home appliances, energy
consumption of lighting equipment, temperatures in
different areas, and temperature and humidity outside
the building.
In the study, linear regression model is one of the
first algorithms adopted to predict household energy
consumption influenced by several environmental
factors. The R-squared value is 0.1225, which is a
relatively low value. Upon evaluation, both the MSE
and MAE values appear to be considerably elevated,
registering at 9530.72 and 55.17, respectively. MSE
and MAE are important indicators to measure the
accuracy of model predictions. They indicate the
discrepancy between the predicted model output and
the actual value. In this case, they mean that the
prediction accuracy is low.
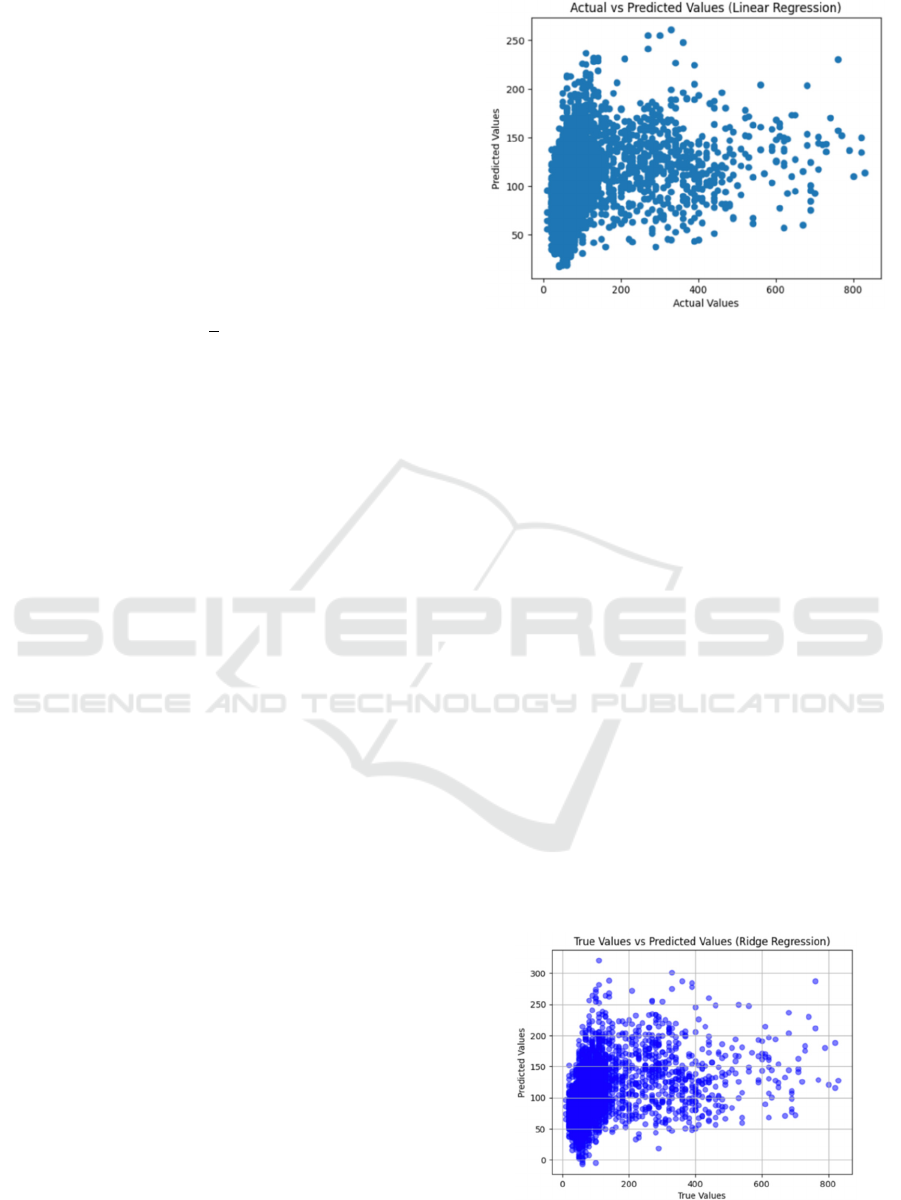
Figure 1: The result of Linear Regression (Picture credit:
Original).
The Fig. 1 shows that the data points are widely
distributed with no obvious pattern, which may
indicate that the linear regression model is not the best
model for this data set. This data set includes many
factors that may affect energy consumption, such as
temperature, humidity, and time. Linear regression
models may not capture the complex interactions and
nonlinear relationships between these factors.
Although the performance of this model is not very
good, it can still provide some valuable information
for this study.
This study explores the effectiveness of the ridge
regression model in predicting household energy
consumption. Ridge regression is a modified form of
linear regression that incorporates an L2
regularization term to manage the model's complexity
and avoid overfitting. Ridge regression has an R^2 of
0.1661. Although this is higher than linear regression,
it is still very low. Upon evaluating the model's mean
square error and root mean square error, the
respective values for MSE and MAE to be 9097.88
and 53.66. Although this value is still relatively high,
it is a sign of improvement.
Figure 2: The result of Ridge Regression (Picture credit:
Original).
Comparative Analysis of Machine Learning Models in Predictive Analytics for Residential Energy Consumption
253
The Fig. 2 is consistent with linear regression, and
there is no big difference. There is a large discrepancy
between the model's predictions and actual values. In
order to seek greater improvements, this study will
test more other models.
The KNN regression model is one of the models
used in this study. The KNN regression model has a
R^2 value of 0.7699137230387139.The value is not
very high, but it is a good starting point. This model
can explain most of the variance. The MSE value and
MAE value of KNN regression are 18530 and 108.
This value is relatively high, indicating that we can
make some improvements in accuracy.
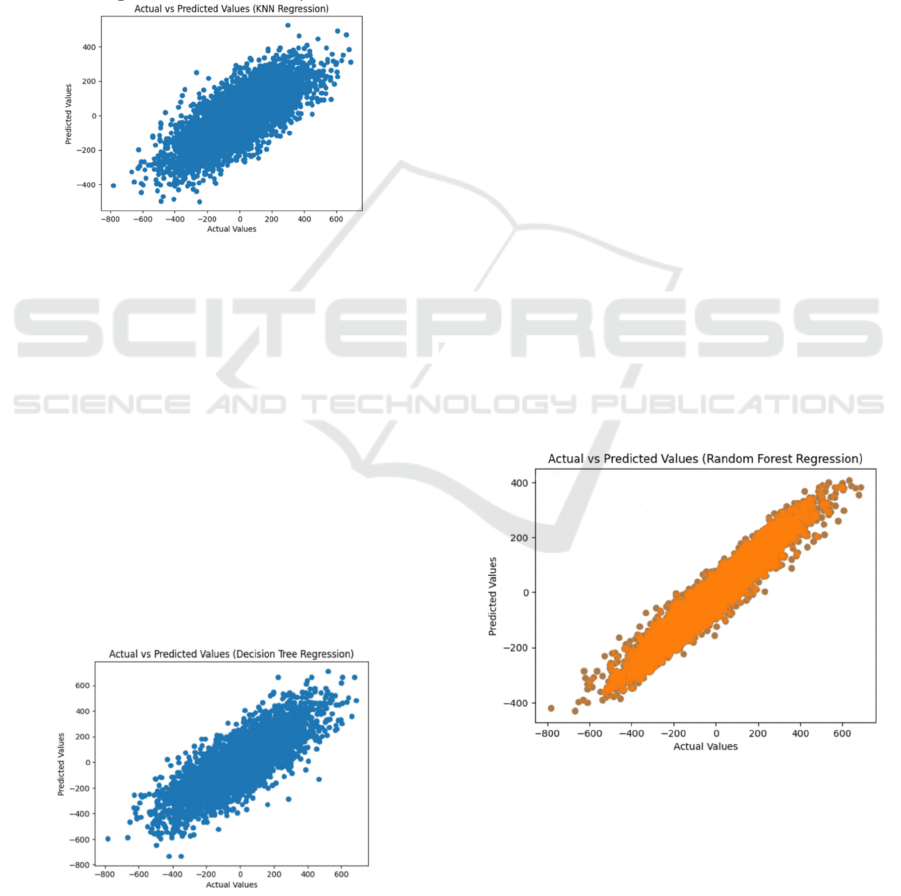
Figure 3: The result of KNN Regression (Picture credit:
Original).
The Fig. 3 is the scatter plot of the KNN regression
model. The scatter plot looks unfocused and far from
our ideal situation. Models can be affected by noise
or outliers. The dataset contains multiple features,
including time, temperature, humidity, etc., and the
changes of these features over the time series may be
non-linear, which makes it difficult for the KNN
model to capture these non-linear relationships.
The decision tree regression model shows a
significant improvement compared to the KNN
regression model. After our calculation, its R^2 value
is 0.905393447536025. The MAE and MSE of
decision tree regression are 96 and 14999
respectively, which are still very high numbers.
Figure 4: The result of Decision Tree Regression (Picture
credit: Original).
The Fig. 4 is a scatterplot of decision tree
regression. Although the model can capture the main
trends, there is still a large deviation between the
predicted and actual values. One advantage of
decision trees is that they do not require excessive
data preprocessing to produce easily interpretable
results. But as a non-linear model, when dealing with
our complex data set involving multiple rooms,
decision tree regression requires the creation of a
complex decision rule to fit the data. This may cause
decision trees to be sensitive to overfitting and noise.
The random forest regression model demonstrated
its powerful predictive power in this study. Its R^2
value is 0.963881328340319 and its variance is
0.8815. The model is able to explain most of the
variance. The MAE value is 58.821, while the MSE
value is 6014. These two values are lower than the
first two, and the prediction accuracy of the model is
higher. Parameters are one of the keys to the
performance of random forest regression models.
To obtain higher performance, this study uses
Randomized Search technology to find the best
parameters. RandomizedSearchCV is a class in the
Scikit-Learn library. First, the parameter space and
model are passed to RandomizedSearchCV, then it
will randomly select a parameter combination in the
given parameter grid. It will run for 3 rounds, each
round selecting a different part as the test set, then
calculating the average score and selecting the
parameter combination with the highest score. Good
parameters make a considerable contribution to the
performance of the model.
Figure 5: The result of Random Forest Regression (Picture
credit: Original).
It can be seen from the Fig. 5 that the overall
relationship presents a clear linear relationship. The
model fits the main trends of the data well. In this
case, the random forest model improves prediction
accuracy and model stability by integrating multiple
DAML 2023 - International Conference on Data Analysis and Machine Learning
254

decision trees, which allows it to better capture
complex relationships and nonlinear patterns in the
data. This model allows for a better understanding of
energy consumption, allowing for more effective
energy management strategies.
5 CONCLUSION
This study aims to analyze energy use patterns in
households, specifically focusing on energy
consumption of household appliances. By using a
variety of advanced regression models, the study
aggregates and analyzes multiple factors that
influence household energy consumption. In this
research, we utilized a variety of models: linear,
Ridge, KNN, decision tree, and random forest
regressions, all of which played a significant role in
the study. Finally, the most suitable model for this
study was determined through comparison. This not
only provides us with real-time and accurate energy
usage information, but also provides us with powerful
tools and methods to optimize and improve home
energy management. In the future, through further
research and experiments, these insights and
strategies will be applied to actual home energy
management systems to achieve more efficient and
sustainable home energy use. By using modern
models, household appliance energy consumption
can be further optimized.
REFERENCES
Z. M. Chen and G. Q. Chen, “An overview of energy
consumption of the globalized world economy,”
Energy Policy, vol. 39, no. 10, pp. 5920–5928, 2011.
G. Irwin, N. Banerjee, A. Hurst, and S. Rollins,
"Understanding context governing energy consumption
in homes," in CHI '14 Extended Abstracts on Human
Factors in Computing Systems (CHI EA '14), 2014, pp.
2443–2448.
J. J. Pastorfide et al., "Usage prediction of appliances in
Filipino households using Bayesian algorithm," in 2017
IEEE 9th International Conference on Humanoid,
Nanotechnology, Information Technology,
Communication and Control, Environment and
Management (HNICEM), 2017, pp. 1-6.
R. G. Rajasekaran, S. Manikandaraj, and R. Kamaleshwar,
"Implementation of Machine Learning Algorithm for
predicting user behavior and smart energy
management," in 2017 International Conference on
Data Management, Analytics and Innovation
(ICDMAI), 2017, pp. 24-30.
G. N. Kouziokas, "Long Short-Term Memory (LSTM)
Deep Neural Networks in Energy Appliances
Prediction," in 2019 Panhellenic Conference on
Electronics & Telecommunications (PACET), 2019,
pp. 1-5.
M. Shorfuzzaman and M. S. Hossain, "Predictive Analytics
of Energy Usage by IoT-Based Smart Home
Appliances for Green Urban Development," in ACM
Trans. Internet Technol. 22, 2, Article 35, 2021, 26
pages.
E. Kilinç, S. Fernandes, M. Antunes, D. Gomes, and R. L.
Aguiar, "Using ML to increase the efficiency of solar
energy usage in HVAC," in 2020 2nd International
Conference on Societal Automation (SA), 2021, pp. 1-
4.
G. M. Bantan, S. L. Tangwe, and M. Simon, "Performance
monitoring and prediction of a domestic split-type air
conditioner," in 2017 International Conference on the
Domestic Use of Energy (DUE), 2017, pp. 220-226.
X. Dong, L. Guo, Z. Zhang, Z. Chen, and B. Liang,
"Simulation Data Generation Method Based on
Improved Cross-entropy Algorithm for the Prediction
of User Electricity Consumption," in 2020 7th
International Forum on Electrical Engineering and
Automation (IFEEA), 2020, pp. 943-948.
M. Wenninger, D. Stecher, and J. Schmidt, "SVM-Based
Segmentation of Home Appliance Energy
Measurements," in 2019 18th IEEE International
Conference On Machine Learning And Applications
(ICMLA), 2019, pp. 1666-1670.
Comparative Analysis of Machine Learning Models in Predictive Analytics for Residential Energy Consumption
255
