
An Analysis Research of White Wine Quality Using Three Machine
Learning Models
Haoxuan Liu
Information of Technology, The University of Sydney, Sydney, Australia
Keywords: Wine Quality Analysis, Support Vector Machine, Machine Learning Model, Random Forest, Naive Bayes.
Abstract: In today's society, wine has become an indispensable drink on people's tables due to abundant material wealth.
Understanding wine quality is crucial in this context. In this work, three popular machine learning models—
Support Vector Machine (SVM), Naive Bayes, and Random Forest—are compared through analysis of the
white wine dataset. The evaluation metrics employed to assess their performance include precision, recall,
and F1 score, providing a comprehensive evaluation of their quality analysis capabilities on white wine data.
Results indicate that Random Forest and SVM performed well, achieving satisfactory accuracy and other
white wine quality analysis metrics. However, the Naive Bayes model proved unsuitable and could have
performed better, underscoring the significance of model selection in machine learning for different datasets
and problem domains. This study offers valuable insights into wine quality analysis, emphasizing
performance variations among machine learning models. The aforementioned conclusions include noteworthy
practical consequences for both the wine business and its clients.
1 INTRODUCTION
In today's society, wine has become integral to
people's daily lives, especially in social and
celebration events. More and more people are
interested in the quality and taste of wine and are
eager to enjoy high-quality wine. However, wine
quality is affected by many factors, and the complex
interactions between these factors make the
prediction of wine quality challenging.
The prediction and analysis of wine quality has
always been one of the critical tasks for the wine
industry and wine lovers. Through in-depth research
and analysis of the chemical properties of wine, we
can better understand the impact of different factors
on wine quality, thereby improving wine production
quality and consumer satisfaction.
Traditionally, manually predicting wine grades is a
time-consuming and labor-intensive task that requires
professional sommeliers and years of experience.
However, as technology develops, machine learning
and data analysis techniques have become an efficient
and accurate method for predicting wine quality. The
objective of this project is to investigate and examine
the dataset on white wine quality available in the
machine learning repository at UCI and in order to
construct an effective model for predicting wine
quality. This study will employ various machine
learning techniques to determine the most suitable
method for solving this problem. First, we will
perform an in-depth understanding and data
preprocessing of the white wine quality dataset. We
will then select, build, train and optimize SVM, Naive
Bayes, and Random Forest models. Next, this study
will evaluate the model using the same evaluation
conditions: accuracy, recall and f1 score.
2 RELATED WORK
Before this study, many scholars had conducted in-
depth research on wine quality issues. Z. Dong et al.
divided the data set into two parts: one that includes
all Bordeaux wine data from 2000 to 2016, and the
other that pertains to the famous 1855 Bordeaux wine
data set (Dong et al 2020). They used three machine
learning models for analysis. In addition, the authors
adopted the MLP model, which in addition to
standard models, also achieved high accuracy results,
which is very suitable for this study (Shaw et al 2019).
Researchers extracted a variety of physical and
chemical characteristics and analyzed the impact of
486
Liu, H.
An Analysis Research of White Wine Quality Using Three Machine Learning Models.
DOI: 10.5220/0012800600003885
Paper published under CC license (CC BY-NC-ND 4.0)
In Proceedings of the 1st International Conference on Data Analysis and Machine Learning (DAML 2023), pages 486-491
ISBN: 978-989-758-705-4
Proceedings Copyright © 2024 by SCITEPRESS – Science and Technology Publications, Lda.

these characteristics on wine quality through
correlation, as described in a study (Nandan et al
2023). In a separate study, researchers employed
genetic algorithms to develop a comprehensive
method for predicting wine quality, classifying it into
three levels: high, medium, and low (Chiu et al 2021).
Data mining algorithms have also proven effective in
analyzing wine quality (Shruthi 2019). Additionally,
the issue of uneven sample distribution in the white
wine dataset was addressed in a study that utilized
SMOTE technology (Hu et al 2016).
Some scholars have tried different models and
found that the J48 model also achieved good results
in analyzing wine quality (Manisha et al 2021).
The relationship between them and wine was revealed
by calculating the Pearson correlation coefficient of
each variable, as demonstrated in the study by Dahal
et al (2021).
3 EXPERIMENTAL METHOD
This experiment will use three models, including
SVM, random forest, and naive Bayes, to perform
data preprocessing to address the sample imbalance
problem in the white wine data set to achieve the
experimental goals better.
This investigation utilized three primary machine
learning models, namely SVM, Naive Bayes, and
Random Forest. This experiment fed white wine
quality data into these three models to compare their
performance on this dataset, including precision,
recall and F1 score. Through this comparison, we can
evaluate which machine learning model performs
better when dealing with this dataset. In addition to
considering a single metric, to obtain a full evaluation
of the model's overall performance.
The SVM is a binary classification model. It
achieves the prediction of the sample category by
introducing a particular plane to divide the data points
into two groups. In the SVM algorithm, the critical
task is to determine the position and direction of the
separation plane so that it can achieve the best
division effect between two groups of data points.
The basic idea is to map the initial data space to a
higher-dimensional feature space employing a non-
linear transformation on the fly. In this new space, the
aim is to find the optimal linear classification
interface. This method introduces an appropriately
defined inner product function to achieve this non-
linear transformation (Dai and Dong 2020).
The distance between any point and the hyperplane:
𝛾 =
‖
𝑤
‖
|𝑤𝑥 + 𝑏| (1)
The decision boundary:
Sign(wx+b) (2)
Naive Bayes methods are derived from the
mathematical principle of Bayes' theorem. In fact,
Bayes' theorem resembles conditional probability. Its
basic idea is to take two random events, A and B, and
find the probability that event B will occur given that
event A.
𝑃
𝐵
|
𝐴
=
(|)
(
)
()
(3)
The interesting thing about Bayes' theorem is that
the probability of B is continuously evaluated when
some conditions are known. In the Naive Bayesian
approach, we further assume that the features are
independent, simplifying the computation. When
viewed from a classification perspective, the main
goal of Naive Bayes is to establish an efficient
mapping that relates new data points to a range of
possible classifications in a particular problem
domain (Yang 2018).
Random forest is considered as a derivative method
of decision tree, and random forest is also an
ensemble method. A random forest is basically a
forest of multiple smaller decision trees, each of
which makes an individualized prediction for a
particular data sample. By majority voting these
individual prediction values, the maximum value
predicted by each tree is obtained as the final overall
prediction value (Trivedi and Sehrawat 2018).
Usually, the best decision tree is obtained without
pruning.
4 EXPERIMENTAL RESULT
In order to make the data have a better representation
in different models, so this experiment first
preprocessed the wine data. The experiment
compares which step is more helpful for the accuracy
of the model analysis, normalization processing or
standardization under the same model. Normalization
was more helpful in predicting the results before
presenting the same model. The reason for the greater
influence of normalization is that the white wine
dataset is sample-uneven in Fig.1.
An Analysis Research of White Wine Quality Using Three Machine Learning Models
487
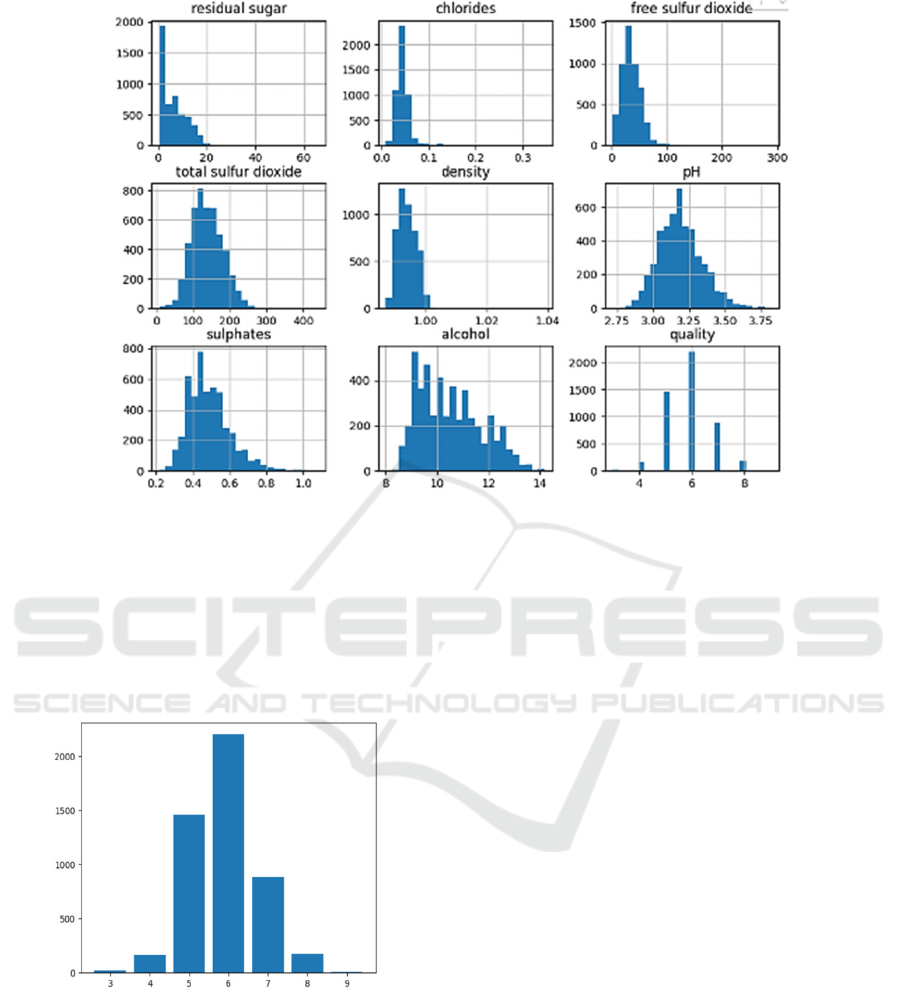
Figure 1: Unbalanced data (Picture credit: Original).
This research extensively examined the dataset's
"quality" variable. This column shows 3, 4, 5, 6, 7, 8,
and 9 values. Note the lack of 0 ,1 and 2 in the initial
quality check. In addition, there is another factor to
consider. This shows that the dataset has incomplete
"quality" values due to data collection or processing
restrictions.
Figure 2: Unbalanced quality data (Picture credit: Original).
Fig. 2 shows that the sample distribution is
substantially different from the "quality" values
currently available. Some quality levels have many
samples, while others have few. Inhomogeneity can
affect machine learning modeling by biasing models
toward categories with more data and failing on
categories with less examples. Therefore, while
modeling machine learning, the technique to address
uneven class distribution must be carefully
considered. This is essential to guarantee the model
can handle varied inhomogeneities and improve
performance and robustness.
So in order to deal with this issue, in this
experiment also the data-level techniques primarily
address this issue by modifying the distribution of the
dataset, achieved through adjusting the sampling of
data. This can involve either reducing the number of
instances (under-sampling) or increasing the
instances (oversampling) (Hu et al 2016).
To enhance the clarity of the link between various
features, this study presents the correlation between
these attributes in Fig. 3. The utilization of correlation
analysis facilitates users in acquiring insights into the
aspects that exert the most substantial influence on
the quality of white wine. The chart clearly
demonstrates that the concentration of alcohol has a
substantial influence in potentially influencing the
quality of white wine. Fig. 3 demonstrates a
significant association between the concentration of
alcohol and the quality of white wine. The findings
indicate that there is a positive correlation between
the alcohol percentage of white wines and their
quality scores.
DAML 2023 - International Conference on Data Analysis and Machine Learning
488

Figure 3: Wine data attributes heatmap (Picture credit: Original).
Balance the sample sizes as much as possible
thereby making a stronger connection between the
model and the data. The experiment involves
partitioning the dataset into two subsets, specifically,
the dataset is divided into two subsets, called the
training set and the test set, with percentages of 80%
and 20% respectively.
This study focuses on analyzing which model will
perform well in the white wine dataset by comparing
three models: SVM, Simple Bayes and Random
Forest. By comparing the accuracy, f1 score, and
recall of these three models, it is determined which
model is the most suitable for this dataset.
An SVM model represents the instances of a
dataset as points in a space, with the objective of
creating the widest possible gap to separate instances
of different classes. SVM is capable of performing
classification for non-linear data as well (Kumar et al
2020). In the SVM model, the initial selection this
research made was a linear kernel function.
Nevertheless, the results obtained from this
experiment were somewhat unsatisfactory, with an
accuracy rate of just around 50.5%. Due to the
presence of probable non-linearity in the dataset, it
was seen that the linear kernel was not appropriate
and thus led to suboptimal performance. In order to
tackle this issue, we choose to utilize the 'rbf' kernel,
since it exhibits a stronger alignment with the
fundamental structure of the data. As a result, there
was a significant enhancement in accuracy and other
performance indicators, with an approximate
achievement of 65%. The previous modification
highlighted the significance of kernel selection in
SVM modelling. The Naive Bayes classifier is less
appropriate for categorizing the quality of wine
because of its very low accuracy. The Naive Bayes
algorithm can be classified as a white-box
classification method due to its characteristic of
assigning probabilistic contributions to positive and
negative samples for each attribute (Dong et al 2020).
The accuracy of the naïve bayes is just 41%.
Although use a Gaussian Bayesian model in this
research, the final accuracy is still not ideal. The
reason should be that the Naive Bayes algorithm often
misclassified the data, so it is not suitable for this data
set.
The strategic selection of important parameters,
namely "criterion," "n_estimators," and "max_depth,"
plays a crucial role in the Random Forest method.
These parameters determine the criteria for data
partitioning, the number of trees in the forest, and the
depth of each individual tree. The utilization of this
particular method serves as a strong preventive
measure against overfitting, hence enhancing the
model's capacity to generalize. Within the confines of
our experimental framework, the decision to establish
the number of trees at 300 was the pinnacle of
meticulous calibration. The Random Forest algorithm
demonstrated exceptional performance, achieving a
remarkable accuracy rate of 67% and a significantly
better F1 score. These results further underscore the
algorithm's superiority when compared to alternative
techniques. The results of SVM and random forest
have good performance when forecasting the level of
white wine, but Naive Bayes is not suitable for
classifying these data. Their highest data performance
was 67%, and their worst accuracy was 41%
An Analysis Research of White Wine Quality Using Three Machine Learning Models
489
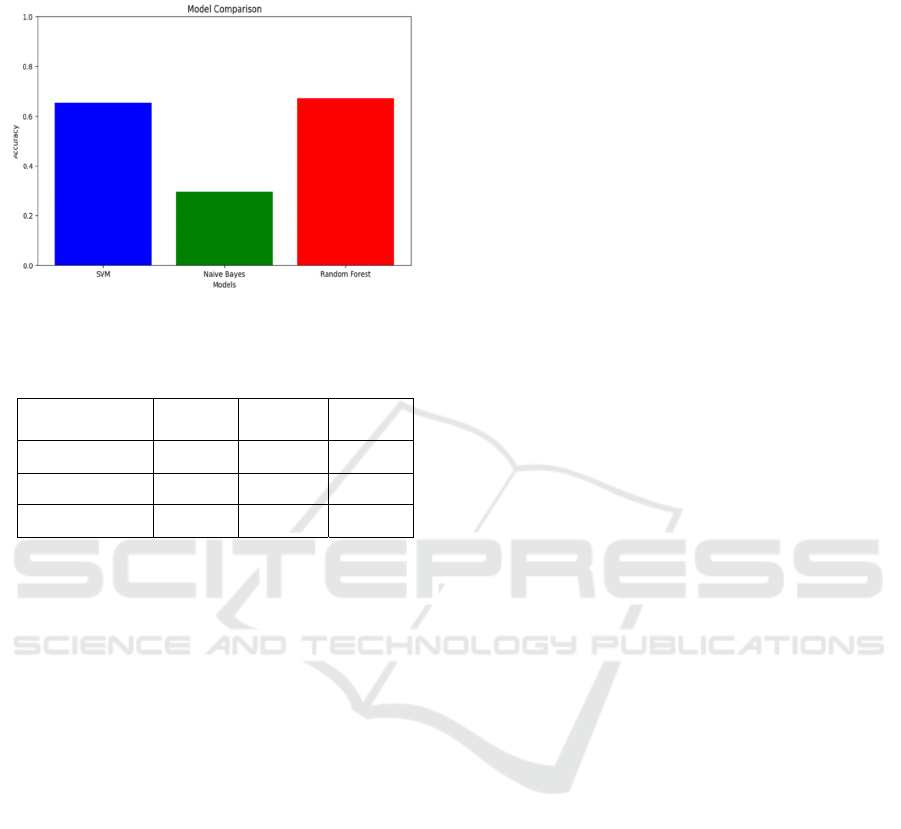
In Fig.4 and Table 1, the experimental results can
clearly show the relevant results of each model.
Figure 4: Comparison results of three models (Picture credit:
Original)
.
Table 1: Results display of three models.
Accuracy
Recall
F1 score
SVM 0.65 0.65 0.64
Naive Bayes 0.41 0.29 0.27
Random Forest 0.67 0.67 0.67
5 CONCLUSION
This study aims to analyze the white wine dataset and
compare the performance of three models: SVM,
Naive Bayes, and Random Forest on this dataset.
Determine which model best fits the dataset by
comparing the accuracy, F1 score, and recall of the
three models. With an accuracy of almost 67% and
other index values. The researchers determined that
the random forest model exhibited superior
performance. The SVM model has a little inferior
level of accuracy compared to the random forest
model, but it also shows excellent analytical and
predictive capabilities in the white wine data set.
Considering the possibility that the data may not be
linear and the linear kernel function results in
suboptimal accuracy, this research tried to change the
kernel function to a Gaussian kernel function, which
fits the data form better. Hence, the accuracy and
other results were about 65%. The worst-performing
model is the Naive Bayes model. After multiple
optimizations of this model, its accuracy is only 41%.
The reason for this result is that the uneven sample
distribution of the data set affects the model's
accuracy. Since the Naive Bayes method is a white-
box classification method and often needs to be more
accurate for this dataset.
This study fills a research gap regarding white wine
data and the fit between the three models we
employed. This study gives readers a deeper
understanding of the correlation between accuracy
across datasets and different models.
Due to the author's limited academic level and
insufficient optimization capabilities for models such
as Naive Bayes, the expressiveness of the model has
yet to reach a high level. In the future, the author will
continue to delve into machine learning and learn
algorithms for optimizing machine models. Improve
technical level.
REFERENCES
Z. Dong, X. Guo, S. Rajana, and B. Chen, “Understanding
21st Century Bordeaux Wines from Wine Reviews
Using Naïve Bayes Classifier,” Beverages, 2020, pp. 5
B. Shaw, A. K.Suman, and B. Chakraborty, “Wine Quality
Analysis Using Machine Learning,Emerging
Technology in Modelling and Graphics”, Emerging
Technology in Modelling and Graphics, 2019.
M. Nandan, H. Raj Gupta and M. Mondal, "Building a
Classification Model based on Feature Engineering
for the Prediction of Wine Quality by Employing
Supervised Machine Learning and Ensemble
Learning Techniques," International Conference on
Computer, Electrical & Communication Engineering
(ICCECE), 2023, pp. 1-7.
T. H. -Y. Chiu, C. Wu, and C. -H. Chen, “A Generalized
Wine Quality Prediction Framework by Evolutionary
Algorithms,” International Journal of Interactive
Multimedia and Artificial Intelligence, 2021, p. 60.
P. Shruthi, "Wine Quality Prediction Using Data Mining,"
Environment, Computing & Communication
Engineering (ICATIECE), 2019, pp. 23-26.
G. Hu, T. Xi, F. Mohammed and H. Miao, "Classification
of wine quality with imbalanced data," IEEE
International Conference on Industrial Technology,
2016, pp. 1712-1217.
K. Manisha, P. Richa, J. Mayurika and K. Manish,
“Analysis of white wine using machine learning
algorithms,” Materials Today: Proceedings, 2021, pp.
11087-11093.
K. R. Dahal, J.N. Dahal, H. Banjade, S. Gaire, “Prediction
of Wine Quality Using Machine Learning Algo-
rithms,” Open Journal of Statistics, 2021, pp. 278-289.
T. -T. Dai and Y. -S. Dong, “Introduction of SVM Related
Theory and Its Application Research,” 3rd
International Conference on Advanced Electronic
Materials, 2020, pp. 230-233.
F. -J. Yang, “An Implementation of Naive Bayes Classifier,”
International Conference on Computational Science
and Computational Intelligence (CSCI), 2018, pp.
301-306.
DAML 2023 - International Conference on Data Analysis and Machine Learning
490

A. Trivedi and R. Sehrawat, "Wine Quality Detection
through Machine Learning Algorithms,"
International Conf. on Recent Innovations in
Electrical, Electronics & Communication
Engineering (ICRIEECE), 2018, pp. 1756-1760.
S. Kumar, K. Agrawal and N. Mandan, "Red Wine Quality
Prediction Using Machine Learning Techniques,"
International Conf. on Computer Communication
and Informatics (ICCCI), 2020, pp. 1-6.
An Analysis Research of White Wine Quality Using Three Machine Learning Models
491
